

Abstract
Study Design
Comparison of sodium concentration ([23Na]) and proton T2 relaxation time between normal and degenerated discs in a rabbit model.
Objective
The purpose of this article is to evaluate quantitative [23Na] and T2 characteristics of discs associated with degenerative changes.
Summary of Background Data
Intervertebral disc degeneration (IDD) is a common chronic condition that may lead to back pain, limited activity, and disability. Non-invasive imaging method to detect early IDD is vital to follow disease progression and guide clinical treatment and management.
Methods
Dual-tuned (DT) MRI of rabbit discs was performed using a 3T. Thirteen rabbits were included in the study; six control rabbits (24 normal discs) and seven rabbits with annular-puncture-induced disc degeneration (9 degenerated discs, 19 intact internal-control discs). DT MRI of discs were performed at baseline and 12-week post-stab. [23Na] and T2 were measured and compared among three groups of discs.
Results
The mean [23Na] were 274.8 ± 40.2 mM for the normal discs, 247.2 ± 27.7 mM for the internal-control discs, and 190.6 ± 19.1 mM for the degenerated discs. The corresponding T2 for three groups were: 97.1 ± 12.1 ms, 93.7 ± 11.9 ms, and 79.0 ± 9.1 ms, respectively. The [23Na] is highly correlated with the T2 in the degenerated discs (r = 0.90, P < 0.01). The mean percent decrease from the normal to degenerated discs were in 30.6% in [23Na] and 18.6% in T2, while those from the internal-control to degenerated discs were 22.9% in [23Na] and 15.6% in T2.
Conclusion
While both [23Na] and T2 changes in discs were associated with the disc-punctured rabbits, greater change in [23Na] is observed at 12-week post-stab compared to T2 change. Since T2 and [23Na] reflect different disc properties, performing both imaging under same condition will be helpful in the evaluation of disc degeneration.
Keywords: Dual-tuned proton/sodium MR imaging, Sodium concentration, T2 relaxation time, Intervertebral disc degeneration, Rabbit model
Introduction
Biochemical changes in early-staged intervertebral disc degeneration (IDD) include the reduction of proteoglycan (PG) content1 and collagen degradation in the nucleus pulposus (NP)2. Eventually the degenerating disc loses its nucleus hydration and hydrostatic pressure, leading to structural changes at the later stages of degeneration3,4. Current imaging modalities can detect late stage changes, after structural compromise has already occurred. However, detection of IDD at the early stage with techniques capable of providing information about biochemical changes has the potential to guide novel biologic therapeutic approaches. Biologic treatments such as gene- and cell-based therapies, aimed at promoting matrix production and loss of functional cells, will likely have greater efficacy in the earlier stage of IDD, prior to destruction of disc matrix. This underscores the importance of establishing novel imaging modalities which provide more detailed biologic information.
Quantitative magnetic resonance imaging (MRI) is reported to be capable of early diagnosis of IDD. For example, proton (1H) T2 relaxation time is sensitive to the changes in collagen and/or water content in discs5. T2 decreases with IDD to detect changes in the early stage 6-9. However, due to the signal sources of T2 (i.e., small amount of collagen in NP and strong water dependency), the sensitivity of T2 alone to detect the early IDD may be insufficient. The highly negatively-charged glycosaminoglycan (GAG) side chains of PG attract positive sodium (23Na) ions, and the amount of GAG is strongly correlated with sodium concentration, [23Na]10-12. Therefore, [23Na] measured by 23Na-MRI has the potential to be used for the diagnosis of early stage IDD13. Thus, dual-tuned (DT) 1H/23Na-MRI of degenerated discs will benefit from 1H anatomic detail coupled with superior information about early physiology and molecular changes of T2 and [23Na], which will facilitate improved assessment of outcomes in biologic treatments aimed at the early stages of IDD.
This study is the second part of our two-part investigation series on DT 1H/23Na-MRI of discs. The first part (Part 1: Dual-tuned proton/sodium magnetic resonance imaging of the lumbar spine in a rabbit model, Spine, 2012; resubmitted) described the development of a novel DT MRI technique of the rabbit spine and the quantification of [23Na] in discs. This second part focused on the application of the technique for the evaluation of IDD in a well-established rabbit model of disc degeneration. In this study, we acquired in-vivo 1H/23Na MR images of the rabbit discs in normal control and in experimental rabbits after annular-puncture induced IDD. T2 and [23Na] of the discs were measured and compared to investigate their association with IDD.
Materials and Methods
All MRI was performed using a 3T (Siemens Medical Solutions, Germany). A multi-channel DT 1H/23Na radiofrequency (RF) coil was used for in-vivo 1H/23Na-MRI of the rabbit discs as described in details in Part 1 paper.
Animal preparation
Thirteen rabbits (New Zealand White, 5.2 ± 0.4 kg, Myrtle’s rabbitry) were used for the study following approval by Institutional Animal Care and Use Committee. Of the thirteen rabbits, six animals served as normal controls (N = 24 ‘normal’ discs). The remaining seven underwent annular-puncture of the lumbar discs to induce IDD14. A 16-guage hypodermic needle (BD Biosciences, San Jose, CA) was used to puncture the outer 5 mm of two or three of L2-3, L3-4, and L4-5 discs (N = 9 ‘degenerated’ discs). This technique has been shown to reproducibly induce progressive IDD over the course of 20 – 24 weeks14. The undisturbed L1-2, L5-6, and L6-S1 discs served as ‘internal-control’ discs (N = 19). The rabbits were scanned at baseline prior to the intervention and at twelve weeks post-operation. Normal and injured discs were harvested at 20 weeks for H&E and Safranin O/fast green histological analysis as previously described 14.
MRI of lumbar discs
For the disc anatomy imaging, T2-weighted turbo-spin-echo (TSE) and dual echo steady state (DESS) 1H MR images were acquired at 0.6-mm resolution and 3-mm thickness (Fig. 1). For the T2 measurement of the discs, T2-weighted images were acquired with multiple T2-preparation times (Tprep) 15 – 100 ms, and the gradient-echo acquisition at 0.8-mm resolution and 4-mm thickness (Fig. 2A). T2-preparation was implemented with non-selective RF pulse15,16. For the biochemical disc imaging, 23Na MR images were acquired without re-positioning the rabbit following the 1H-MRI (Fig. 3); ultra-short echo time (TE) spiral sequence17 with 0.27-ms TE at 2-mm isotropic resolution.
Fig. 1.
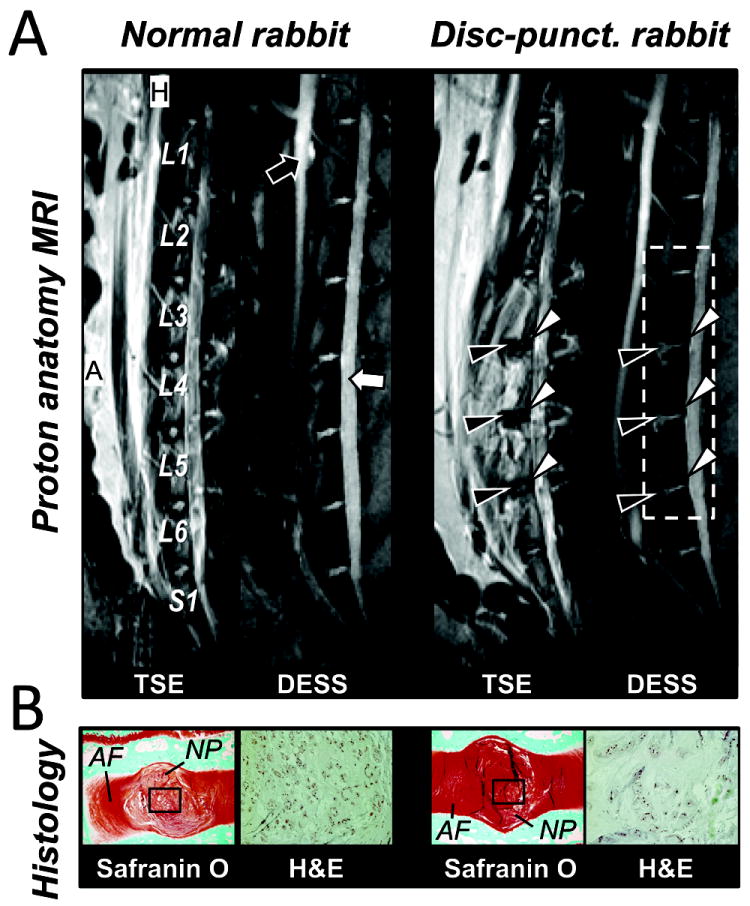
Rabbit lumbar spine MR anatomy and histology. A, 1H MR image of L1 to S1 of the normal and the disc-punctured rabbit; (Left panel) T2-weighted TSE and (right panel) DESS image in sagittal view. Black arrows indicate the descending/ascending aorta vessel and white arrows indicate the CSF in spinal cord. Edema regions (black arrowheads) and degenerated discs (white arrowheads) due to the disc-stab injury. B, Histology images. Safranin O (left panels) and H&E histology images (right panels) acquired from the normal and the injured degenerated discs. Black rectangles are the regions of H&E images. MR parameters were measured in the area indicated by white dotted rectangle in right panel. Abbreviation; A – Anterior and H – head. Same abbreviation was used in the following figures.
Fig. 2.
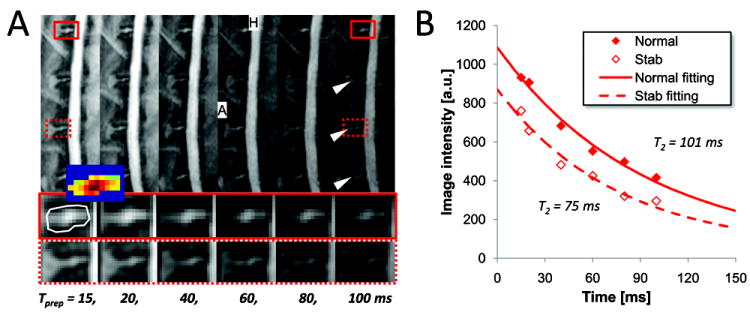
Disc ROI selection and T2 calculation. A, T2-preparation images at different Tprep. (Middle and bottom) Magnified disc images of the normal and the punctured-disc in red-solid and red-dotted rectangle. White arrowheads point the degenerated discs by the disc-stab injury. (Inset) Thresholded disc-only image in the ROI (white contour). B, T2 fitting of the T2-preparation images data in the normal and the punctured-disc ROI.
Fig. 3.
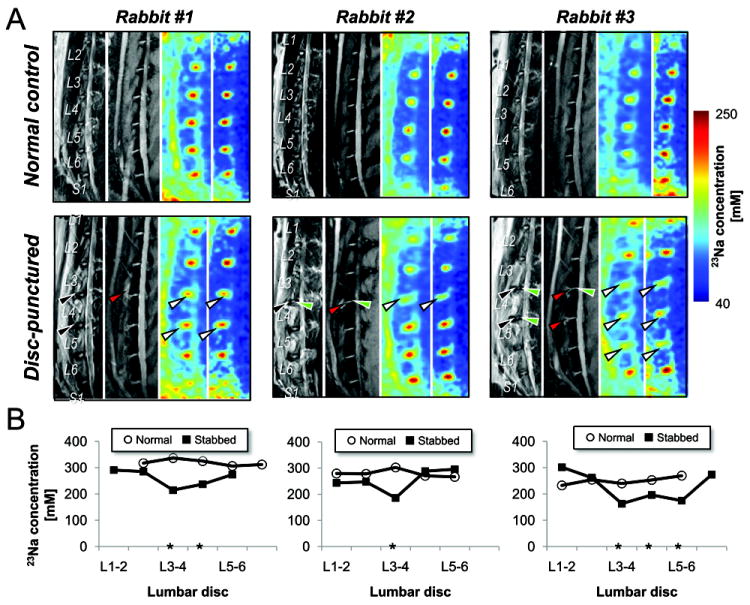
1H- and 23Na-MRI of three representative disc-punctured rabbits discs. A, TSE, DESS and 23Na (of single slice and projection in LR depth direction) MR images from left to right panel. (Upper panels) before and (lower panels) twelve-week after stab surgery. Black and red arrowheads indicate the edema regions caused by the stab injury, and white arrowheads represent the region of sodium decrease in the degenerated discs. B, Plot of [23Na] changes associated with the degeneration from each three subject. Asterisk (*) points the discs with sodium decrease due to the stab.
Image processing and data analysis
23Na image processing was carried out as described in Part I paper. Disc-only regions of interest (ROI), including both NP and annulus fibrosus (AF) (white-contours in Fig. 2A), were manually segmented from the neighboring tissues using an average of multi-time-points T2-weighted images. Then, the pixels of non-disc or AF with low intensity were thresholded under the mean intensity within the ROI. Mean time-series data in the segmented-threshold ROI were used to calculate T2 by fitting of single-component exponential decay curve with Tprep (Fig. 2B). The maximum 23Na signal was projected in left-right and anterior-to-posterior direction of the spine (rightmost panels in Fig. 3A), and the local maximum in NP was used as the [23Na] of that disc.
T2 and [23Na] of each disc were measured at each level from L2-3 to L5-6 lumbar segment positioned at the coil center to minimize B1-field inhomogeneity particularly at the edge of the coil. Mean T2 and [23Na] were calculated by averaging the values among the animals in the normal and disc-punctured rabbit groups. The relationship of T2 and [23Na] in the discs was investigated within the normal and disc-punctured rabbit group (Fig. 4).
Fig. 4.
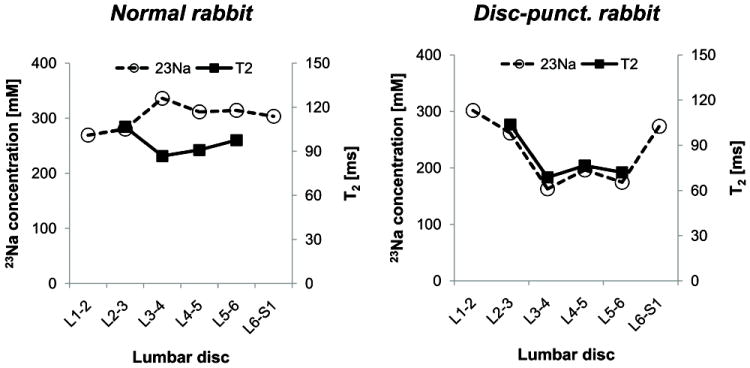
Measurement of T2 and [23Na] in the discs of a normal (left panel) and a disc-punctured rabbit (right panel) of representative animals. Lumbar discs from L3-4 to L5-6 were punctured. Note that the measured T2 and [23Na] parameter show the similar pattern of change in the disc-punctured rabbit, while not clear in the normal rabbit.
Disc degeneration due to the stab damage was determined by visual inspection based on TSE and DESS images – those image intensities and features are sensitive to the disc changes. Degeneration was defined as disc with lower image intensity and/or thinner size compared to the internal-control discs (white-arrowheads in Fig. 1). MR measured parameters were compared between all three disc groups.
Statistical analysis comparing [23Na] and T2 in the normal vs. the degenerated discs was performed using an F-test (N1 = 24 normal, N2 = 9 degenerated discs) to compare the discs sampled from different rabbit group. Analysis comparing MR parameters between the internal-control vs. the degenerated discs was performed using one-tail paired t-test (N = 6 rabbits); the internal-control and degenerated discs data were collected from same disc-punctured rabbits and those were averaged, respectively (Table 1, Fig. 6A). The relationship between T2 and [23Na] in the degenerated discs was also investigated using correlation coefficient (r) (Fig. 6B). In addition, the percentage change of T2 and [23Na] was calculated across the normal, internal-control, and degenerated discs (Table 2).
Table 1.
T2 and [23Na] in the rabbit discs. The rabbits are grouped as the normal and the disc-punctured rabbit. The discs are subdivided into the normal (from the intact normal rabbits), the internal-control and the degenerated discs (from the disc-punctured rabbits).
| T2 (ms) | [23Na] (mM) | |
|---|---|---|
| Discs of normal rabbits (N = 24) | 97.1 ± 12.1 | 274.8 ± 40.2 |
| Discs of disc-punctured rabbits (N = 28) | 89.0 ± 12.9 | 229.0 ± 36.7 |
| Internal control discs (N = 19) | 93.7 ± 11.9 | 247.2 ± 27.7 |
| Degenerated discs (N = 9) | 79.0 ± 9.1 | 190.6 ± 19.1 |
Fig. 6.
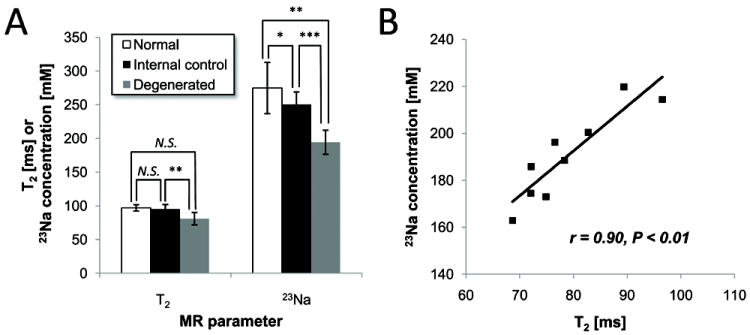
T2 and [23Na] in discs between different disc groups. A, T2 and [23Na] between the normal, the internal-control and the degenerated discs. B, Correlation of T2 and [23Na] in the degenerated discs. Correlation coefficient between T2 and [23Na] is r = 0.90, P < 0.01 (N = 9 discs). * P < 0.1, ** P < 0.05, *** P < 0.001, N.S. non-significant.
Table 2.
Various pair-wise comparisons of MR parameters between the rabbit groups, and between the disc groups. The changes (%) were defined ΔS/So, where ΔS is the difference of two compared mean signals and So is the baseline signal.
| ΔT2 | Δ[23Na] | |
|---|---|---|
| Normal vs. punctured rabbit disc | 8.4 | 16.7 |
| Internal control vs. degenerated disc | 15.6 | 22.9 |
| Normal vs. degenerated disc | 18.6 | 30.6 |
| Normal vs. internal control disc | 3.5 | 10.0 |
Results
1H-MRI
MRI findings were consistent with the histology evidences (Figs. 1 and 2). TSE and DESS images of the punctured discs showed clear differences in intensity and morphology compared to the normal discs (Fig. 1A). The puncture-induced damage produced edema adjacent to the target discs (black-arrowheads in Fig. 1A). The degenerated discs showed hypo-intensity in TSE and showed lower disc height than the normal disc in DESS (white-arrowheads in Fig. 1A). Histological analysis (Fig. 1B) revealed an intact AF with a normal pattern of fibrocartilage lamellae and a normal round NP– with distinct boundary between the AF and NP. Degenerated disc AF had wavy appearance with rupture patterned fiber, and the border between AF and NP was less distinct (compare Safranin O histology images in Fig. 1B). Normal disc showed normal cellularity with large vacuolates and smaller chondrocye-like cells in the gelatinous structure of the matrix while degenerated disc showed moderate/severe decrease in the number of cells and fewer vacuoles, and severe condensation of the extracellular matrix due to the loss of most of content of NP (compare H&E images in Fig. 1B). IDD was also evident in T2-preparation images (compare two lower panels in Fig. 2A). T2-preparation image of the disc demonstrated the highest intensity at NP over all different Tprep (two lower panels in Fig. 2A), therefore the mean intensity value of T2-preparation image within ROI was more weighted to NP component (Inset of Fig. 2A). The measured T2 of the injured disc was an average of 26 s shorter than that of the internal-control disc (Fig. 2B).
23Na-MRI
High [23Na] in the normal discs was demonstrated by 23Na MR image compared to surrounding other tissues (3rd and 4th panels in Fig. 3A). Measurement of [23Na] is highly reproducible, with the coefficient of variation 5.3% (six rabbits and three sessions) described in Part 1 paper. IDD was indicated by decreased [23Na] in the punctured discs (white-arrowheads in Fig. 3A, asterisks in Fig. 3B) compared to the internal-control and normal baseline discs. 23Na changes appear more apparent than the image intensity and thickness change (lower panels in Figs. 3A and B) - the measured sensitivities were 20%, 21%, 32% (intensity change in TSE), 1%, 36%, 6% (thickness change in DESS) and 20%, 31%, 36% ([23Na] change) for these three rabbits, respectively.
Quantitative MR parameters were summarized in Table 1. The mean T2 and [23Na] of the normal discs were 97.1 ± 12.1 ms and 274.8 ± 40.2 mM, respectively; the variation of [23Na] here is higher than that measured within an animal, and is therefore increased by group averaging. The mean T2 and [23Na] of puncture-induced degenerated discs were 79.0 ± 9.1 ms and 190.6 ± 19.1 mM, respectively, while those of the internal-control discs were 93.7 ± 11.9 ms and 247.2 ± 27.7 mM, respectively. Generally, T2 tended to decrease from L2-3 to L5-6, but no systematic change in [23Na] was observed in lumbar discs (data not shown).
[23Na] and T2 did not demonstrate any clear positive correlation in normal discs (left panel of Fig. 4). [23Na] and T2 both decreased in the disc-punctured rabbits in a similar changing pattern over the lumbar discs (right panel of Fig. 4). Scatter plots of [23Na] vs. T2 were created for the normal and disc-punctured rabbits (Fig. 5). T2 was weakly negatively-correlated to the [23Na] in the normal rabbits (r = -0.41, P < 0.05, N = 24 discs) (left panel of Fig. 5). On the contrary, T2 and [23Na] in the disc-punctured rabbits were highly positively correlated (r = 0.63, P < 0.01, N = 28 discs) (right panel of Fig. 5).
Fig. 5.
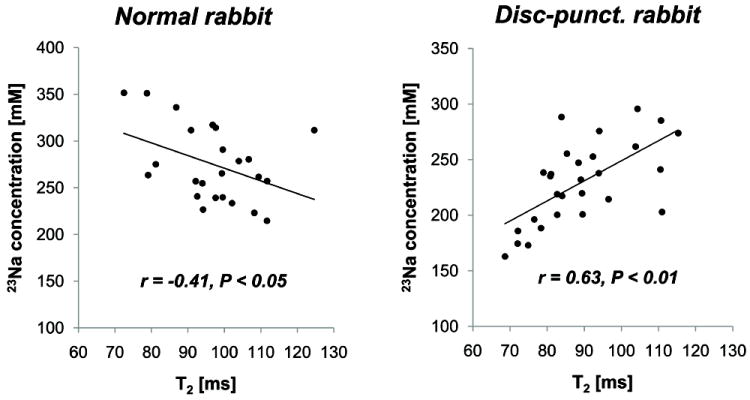
Scatter plot of T2 and [23Na] in the lumbar discs (L2-3 to L5-6) of the normal (left panel) and the disc-punctured rabbits (right panel). Note that two MR parameters are highly correlated to each other in the disc-punctured rabbits, while moderate negative in the normal rabbits.
Comparing T2 and [23Na] between the normal and degenerated disc, only the [23Na] showed statistically significant difference (P < 0.03, N1 = 24 normal discs, N2 = 9 degenerated discs) (Fig. 6A). On the other hand, both the [23Na] and T2 were statistically different between the internal-control vs. degenerated discs (P < 0.02, N = 7 rabbits) (Fig. 6A). In addition, T2 in the degenerated discs showed high correlation to the [23Na], r = 0.90 (P < 0.01, N = 9 discs) (Fig. 6B). The mean decrease from the normal to degenerated discs were in 30.6% in [23Na] and 18.6% in T2, while those from the internal-control to degenerated discs were 22.9% in [23Na] and 15.6% in T2. The mean [23Na] was 10.0% less and T2 measurements were 3.5% lower in the internal-control discs than the normal discs (Table 2).
Discussion
This study aimed to evaluate quantitatively T2 and [23Na] characteristics of discs associated with IDD in a rabbit model. We demonstrated that T2 and [23Na] of degenerated discs are correlated, suggesting a close relationship between physiological and biochemical changes associated with IDD at 12-week post-operation. These non-invasive measurements have the potential to reveal subtle molecular changes and thus advance our understanding of IDD progression. This has important application for assessing efficacy of therapeutic treatments in longitudinal studies. However, it is noted that the rabbit model with annular-disc-puncture is an injury-induced IDD 14, while the IDD in human is multi-factorial. Therefore, our findings may only be generalized to degenerative changes which occur after an annular injury in the rabbit model. Nevertheless, these outcomes will be useful in future pre-clinical studies of treatment for IDD using this well-established model. In addition, only 16-guage needle puncture was used in the current study, and it is possible that different MR changes would be observed in studies utilizing larger needle diameters, which have been shown to have an effect on the biomechanical properties of the disc 18,19.
As an alternative MR parameter, T1ρ is correlated with the amount of PG in NP20 and decreases in degenerated discs21. Therefore, the fixed-charge-density in NP and T1ρ is linearly correlated22; the collagen is also tightly related with T1ρ but the mechanism is not clear 23. T2 and T1ρ are highly correlated and are sensitive to the IDD in human lumbar disc6. In our rabbit experiment, T2 was highly correlated with the [23Na] in degenerated discs (Fig. 6B). Other studies that examined the relationship between T2, T1ρ, and fixed-charge-density in NP have supported these results. Further direct comparison between those MR parameters in NP needs to be investigated, and the study of those relationships at different disease stage may provide a means to follow IDD progression.
T2 decreased with normal lumbar discs level but did not reach statistical significance in our study, which is similar to the human study6. However, [23Na] did not decrease or increase with the discs level. Since PG content at lumbar disc level seems to be changed with the age24,25, it is not clear the [23Na] decreases with the disc level. Consequently, the inverse relationship of T2 and [23Na] in normal lumbar discs is not unexpected (Fig. 5). Although the relationship of [23Na] with disc level is not clear, our results may be caused by possibly excessive correction of B1-field inhomogeneity over lumbar discs because we assumed constant [23Na] across the discs. Further study is warranted for the comparison of tissue PG and MR [23Na] measurement to explain this observation.
In the annular-punctured degenerated discs, T2 and [23Na] were strongly correlated (Fig. 6B), suggesting that those MR parameters are sensitive to the disc changes. The result could be related to the characteristics of T2 and [23Na], as both are sensitive to sodium-water content changes which are followed by PG loss. However, the source of 23Na-MRI is only sodium ion in tissue, while that of T2 is water content (with collagen effects) as well as local susceptibility due to internal/external factors (see Supplementary materials). Thus, the different sources on 23Na and T2 MRI may bring the different sensitivity to IDD. In our study, only [23Na] could differentiate the three different discs status (normal, internal-control vs. degenerated) (Fig. 6A); T2 only between the internal-control and degenerated discs were different with statistical significance. Our results suggest that [23Na] is more sensitive to disc changes than T2 under different conditions. Indeed, the [23Na] change in the degenerated discs compared to the normal discs (30.6%) was higher than the corresponding T2 change (18.6 %). Moreover, the internal-control discs were different from the normal discs; 3.5% change in T2 and 10.0% change in [23Na]. The results agree with other reports that the internal-control discs in disc-punctured rabbits can be affected and deteriorated through mechanical loading changes in the spine14. Changes in [23Na] demonstrated higher sensitivity to the disc damage with wider dynamic range than T2, suggesting that 23Na-MRI can be applied for the detection of early biochemical changes associated with IDD.
There are the limits of current DT MRI experiment of the rabbit discs: 1) Disc morphology is changed due to physical damages from the disc-stab surgery, 2) It is practically impossible to select same disc region in multi-slice 1H sagittal imaging across different sessions, and 3) The size of sodium coil marginally cover the lumbar discs and the noises increase in the coil boundary, so center-positioning of rabbit discs is necessary over different sessions. Due to the above technical difficulties, it was not possible to obtain the data at exactly same disc regions for each session. Therefore, three-dimensional MRI with larger DT coil is more appropriate for the comparison study between different sessions.
In conclusion, we demonstrated T2 and [23Na] changes associated with IDD in a rabbit model using DT MRI. Compared to the internal-control discs, the degenerated discs showed changes in both T2 and [23Na], but [23Na] changes were more sensitive to the differences in disc status than T2 changes. Since T2 and [23Na] are related to different disc properties (i.e., collagen and water vs. PG content in NP), performing both imaging under same condition will provide greater molecular details regarding IDD process.
Supplementary Material
Key Points.
Studies on MR imaging of intervertebral discs have shown that sodium concentration in disc nucleus pulposus measured by MR imaging is sensitive to the proteoglycan changes while T2 relaxation time measured by proton MR imaging is related to the collagen and/or water property changes.
The evaluation of these MR imaging biomarkers under controlled experimental model would allow us to determine the sensitivity of the biomarkers for detecting the disease process and clinical applicability for the diagnosis of early IDD.
In this study, we measured and compared T2 and sodium concentration changes in the degenerated discs in a rabbit model, and concluded that the sodium concentration is more sensitive than T2 measurement to the disc changes. Since T2 and sodium concentration are related to different disc properties (i.e., collagen and/or water versus proteoglycan content, which are key matrix constituents and affected during the disc degeneration), performing both imaging in same imaging session will be helpful to understand the disc degeneration process and those mechanisms at the level of molecular change.
Acknowledgments
The work was supported partly by the Radiological Society of North America (RSNA) Research Scholar grant RSCH1025 to CHM and NIH/NCCAM grant K08AT004718-02 to GS. The authors gratefully acknowledge Drs. Julie Myers-Irvin, Xiang He and Tiejun Zhao for providing extensive communication and generous support of MR pulse sequences.
The device(s)/drug(s) that is/are the subject of this manuscript is/are not intended for human use. Radiological Society of North America and NIH/NCCAM grant funds were received to support this work. One or more of the author(s) has/have received or will receive benefits for personal or professional use from a commercial party related directly or indirectly to the subject of this manuscript: e.g., honoraria, gifts, consultancies, royalties, stocks, stock options, decision making position.
References
- 1.Pearce RH, Grimmer BJ, Adams ME. Degeneration and the chemical composition of the human lumbar intervertebral disc. Journal of Orthopaedic Research. 1987;5:198–205. doi: 10.1002/jor.1100050206. [DOI] [PubMed] [Google Scholar]
- 2.Boyd LM, Richardson WJ, Allen KD, et al. Early-onset degeneration of the intervertebral disc and vertebral end plate in mice deficient in type IX collagen. Arthritis and Rheumatism. 2008;58:164–71. doi: 10.1002/art.23231. [DOI] [PubMed] [Google Scholar]
- 3.Adams MA, Roughley PJ. What is intervertebral disc degeneration, and what causes it? Spine. 2006;31:2151–61. doi: 10.1097/01.brs.0000231761.73859.2c. [DOI] [PubMed] [Google Scholar]
- 4.Urban J, McMullin J. Swelling pressure of the lumbar intervertebral discs: Influence of age, spinal level, composition, and degeneration. Spine. 1988;13:179–87. doi: 10.1097/00007632-198802000-00009. [DOI] [PubMed] [Google Scholar]
- 5.Xia Y. Magic-angle effect in magnetic resonance imaging of articular cartilage: a review. Investigative radiology. 2000;35:602–21. doi: 10.1097/00004424-200010000-00007. [DOI] [PubMed] [Google Scholar]
- 6.Blumenkrantz G, Zuo J, Li X, et al. In vivo 3.0-tesla magnetic resonance T1rho and T2 relaxation mapping in subjects with intervertebral disc degeneration and clinical symptoms. Magnetic resonance in medicine. 2010;63:1193–200. doi: 10.1002/mrm.22362. [DOI] [PMC free article] [PubMed] [Google Scholar]
- 7.Chiu EJ, Newitt DC, Segal MR, et al. Magnetic resonance imaging measurement of relaxation and water diffusion in the human lumbar intervertebral disc under compression in vitro. Spine. 2001;26:437–44. doi: 10.1097/00007632-200110010-00017. [DOI] [PubMed] [Google Scholar]
- 8.Kerttula L, Kurunlahti M, Jauhiainen J, et al. Apparent diffusion coefficients and T2 relaxation time measurements to evaluate disc degeneration. A quantitative MR study of young patients with previous vertebral fracture. Acta radiologica. 2001;42:585–91. doi: 10.1080/028418501127347241. [DOI] [PubMed] [Google Scholar]
- 9.Perry J, Haughton V, Anderson PA, et al. The value of T2 relaxation times to characterize lumbar intervertebral disks: preliminary results. American journal of neuroradiology. 2006;27:337–42. [PMC free article] [PubMed] [Google Scholar]
- 10.Urban JP, Winlove CP. Pathophysiology of the intervertebral disc and the challenges for MRI. Journal of magnetic resonance imaging. 2007;25:419–32. doi: 10.1002/jmri.20874. [DOI] [PubMed] [Google Scholar]
- 11.Antoniou J, Pike GB, Steffen T, et al. Quantitative magnetic resonance imaging in the assessment of degenerative disc disease. Magnetic resonance in medicine. 1998;40:900–7. doi: 10.1002/mrm.1910400616. [DOI] [PubMed] [Google Scholar]
- 12.Shapiro EM, Borthakur A, Gougoutas A, et al. 23Na MRI accurately measures fixed charge density in articular cartilage. Magnetic Resonance in Medicine. 2002;47:284. doi: 10.1002/mrm.10054. [DOI] [PMC free article] [PubMed] [Google Scholar]
- 13.Wang C, McArdle E, Fenty M, et al. Validation of sodium magnetic resonance imaging of intervertebral disc. Spine. 2010;35:505–10. doi: 10.1097/BRS.0b013e3181b32d3b. [DOI] [PMC free article] [PubMed] [Google Scholar]
- 14.Sobajima S, Kompel JF, Kim JS, et al. A slowly progressive and reproducible animal model of intervertebral disc degeneration characterized by MRI, X-ray, and histology. Spine. 2005;30:15–24. doi: 10.1097/01.brs.0000148048.15348.9b. [DOI] [PubMed] [Google Scholar]
- 15.McCommis KS, Koktzoglou I, Zhang H, et al. Improvement of hyperemic myocardial oxygen extraction fraction estimation by a diffusion-prepared sequence. Magnetic resonance in medicine. 2010;63:1675–82. doi: 10.1002/mrm.22427. [DOI] [PMC free article] [PubMed] [Google Scholar]
- 16.Witschey WR, 2nd, Borthakur A, Elliott MA, et al. Artifacts in T1 rho-weighted imaging: compensation for B(1) and B(0) field imperfections. Journal of magnetic resonance. 2007;186:75–85. doi: 10.1016/j.jmr.2007.01.015. [DOI] [PMC free article] [PubMed] [Google Scholar]
- 17.Zhao T, Qian Y, Hue Y, et al. Implementation of a 3D isotropic ultra-short TE (UTE) sequence. Proceedings of International society of magnetic resonance in medicine. 2009;17:2662. [Google Scholar]
- 18.Elliott DM, Yerramalli CS, Beckstein JC, et al. The Effect of Relative Needle Diameter in Puncture and Sham Injection Animal Models of Degeneration. Spine. 2008;33:588–96. doi: 10.1097/BRS.0b013e318166e0a2. [DOI] [PubMed] [Google Scholar]
- 19.Wang J-L, Tsai Y-C, Wang Y-H. The Leakage Pathway and Effect of Needle Gauge on Degree of Disc Injury Post Anular Puncture: A Comparative Study Using Aged Human and Adolescent Porcine Discs. Spine. 2007;32:1809–15. doi: 10.1097/BRS.0b013e31811ec282. [DOI] [PubMed] [Google Scholar]
- 20.Johannessen W, Auerbach JD, Wheaton AJ, et al. Assessment of human disc degeneration and proteoglycan content using T1rho-weighted magnetic resonance imaging. Spine. 2006;31:1253–7. doi: 10.1097/01.brs.0000217708.54880.51. [DOI] [PMC free article] [PubMed] [Google Scholar]
- 21.Majumdar S. Magnetic resonance imaging and spectroscopy of the intervertebral disc. NMR in biomedicine. 2006;19:894–903. doi: 10.1002/nbm.1106. [DOI] [PubMed] [Google Scholar]
- 22.Wang C, Witschey W, Elliott MA, et al. Measurement of intervertebral disc pressure with T 1rho MRI. Magnetic resonance in medicine. 2010;64:1721–7. doi: 10.1002/mrm.22560. [DOI] [PMC free article] [PubMed] [Google Scholar]
- 23.Borthakur A, Mellon E, Niyogi S, et al. Sodium and T1ρ MRI for molecular and diagnostic imaging of articular cartilage. NMR in Biomedicine. 2006;19:781–821. doi: 10.1002/nbm.1102. [DOI] [PMC free article] [PubMed] [Google Scholar]
- 24.Scott JE, Bosworth TR, Cribb AM, et al. The chemical morphology of age-related changes in human intervertebral disc glycosaminoglycans from cervical, thoracic and lumbar nucleus pulposus and annulus fibrosus. Journal of anatomy. 1994;184:73–82. [PMC free article] [PubMed] [Google Scholar]
- 25.Adams P, Muir H. Qualitative changes with age of proteoglycans of human lumbar discs. Annals of Rheumatic Diseases. 1976;35:289–96. doi: 10.1136/ard.35.4.289. [DOI] [PMC free article] [PubMed] [Google Scholar]
Associated Data
This section collects any data citations, data availability statements, or supplementary materials included in this article.