

Abstract
Objective:
To examine the association of body mass index (BMI) and metabolic status with cognitive function and decline.
Methods:
A total of 6,401 adults (71.2% men), aged 39–63 years in 1991–1993, provided data on BMI (normal weight 18.5–24.9 kg/m2, overweight 25–29.9 kg/m2; and obese ≥30 kg/m2) and metabolic status (abnormality defined as 2 or more of 1) triglycerides ≥1.69 mmol/L or lipid-lowering drugs, 2) systolic blood pressure ≥130 mm Hg, diastolic blood pressure ≥85 mm Hg, or antihypertensive drugs, 3) glucose ≥5.6 mmol/L or medications for diabetes, and 4) high-density lipoprotein cholesterol <1.04 mmol/L for men and <1.29 mmol/L for women). Four cognitive tests (memory, reasoning, semantic, and phonemic fluency) were administered in 1997–1999, 2002–2004, and 2007–2009, standardized to z scores, and averaged to yield a global score.
Results:
Of the participants, 31.0% had metabolic abnormalities, 52.7% were normal weight, 38.2% were overweight, and 9.1% were obese. Among the obese, the global cognitive score at baseline (p = 0.82) and decline (p = 0.19) over 10 years was similar in the metabolically normal and abnormal groups. In the metabolically normal group, the 10-year decline in the global cognitive score was similar (p for trend = 0.36) in the normal weight (−0.40; 95% confidence interval [CI] −0.42 to −0.38), overweight (−0.42; 95% CI −0.45 to −0.39), and obese (−0.42; 95% CI −0.50 to −0.34) groups. However, in the metabolically abnormal group, the decline on the global score was faster among obese (−0.49; 95% CI −0.55 to −0.42) than among normal weight individuals (−0.42; 95% CI −0.50 to −0.34), (p = 0.03).
Conclusions:
In these analyses the fastest cognitive decline was observed in those with both obesity and metabolic abnormality.
Prospective studies suggest that overweight and obesity, particularly in midlife, are risk factors for dementia.1–6 Early studies relating adiposity to dementia provided conflicting results until it became evident that age modified this association.2,7 Higher body mass index (BMI) in elderly individuals is associated with lower dementia risk; possible explanations include weight loss during the preclinical phase of dementia (reverse causation) and selection biases because of competing risks of death related to high BMI. Recent evidence suggests that in younger populations, in whom dementia is rare, obesity is a risk factor for poor cognitive outcomes in cross-sectional8,9 and prospective analyses.8–11 It is hypothesized that obesity-related pathology that leads to cognitive decline takes many years to develop, and BMI in midlife rather than at older ages may reflect the long-term effect of obesity on cognition.2
Although obesity is typically accompanied by unfavorable metabolic profiles, such as high glucose, adverse lipid levels, and elevated blood pressure, this is not always the case. Recent attempts to capture this heterogeneity include concepts such as metabolically healthy obesity (MHO), used to describe individuals with a BMI ≥30 kg/m2 combined with an otherwise healthy metabolic profile.12,13 Although there is considerable evidence to show adverse effects of obesity on health,14–16 research suggests that the MHO phenotype is not associated with increased risk of cardiovascular disease.17–19 However, the evidence is far from conclusive,20–22 and little is known about the impact of MHO on cognitive function.
The objective of the present study was to examine the association between midlife obesity phenotypes, including MHO, and cognitive function in early old age. We also assess associations with cognitive decline, based on 3 assessments over 10 years. A standardized definition was used to categorize individuals based on their BMI and metabolic profile using data on dyslipidemia, hypertension, and hyperglycemia.20
METHODS
Participants.
Data are drawn from the Whitehall II cohort, established in 1985 among 10,308 (67% men) British civil servants.23 All civil servants aged 35–55 years in 20 London-based departments were invited to participate by letter, and 73% agreed. The study design consists of a clinical examination, carried out by a trained team of nurses in facilities specially hired for this purpose, approximately every 5 years: 1985–1988, 1991–1993, 1997–1999, 2002–2004, and 2007–2009.
Standard protocol approvals, registrations, and patient consents.
All participants provided written informed consent, and the University College London ethics committee approved this study.
Measurements.
BMI (assessed 1991–1993).
Weight was measured to the nearest 0.1 kg with participants in underwear on Soehnle electronic scales with digital readout (Leifheit AS, Nassau, Germany). Height was measured to the nearest 1 mm with participants in bare feet using a stadiometer with the participant standing erect with head in the Frankfurt plane. Reproducibility (intraclass correlation) of the weight and height measurements over 1 month, undertaken on 331 participants, was 0.99. BMI (weight in kilograms/height in meters squared) was categorized using the World Health Organization classification24: <18.5 kg/m2, underweight; 18.5–24.99 kg/m2, normal weight; 25–29.99 kg/m2, overweight; and ≥30 kg/m2, obese, with the <18.5 kg/m2 category (n = 80) removed from the analysis.
Metabolic status (assessed 1991–1993).
We used standard operating protocols to measure the various components to define metabolic status. Blood pressure was the mean of 2 measures using a Hawksley random-zero sphygmomanometer (Lynjay Services Ltd., Worthing, UK). Venous blood was taken in the fasting state or at least 5 hours after a light, fat-free breakfast. Serum for lipid analyses was refrigerated at −4°C and assayed within 72 hours. High-density lipoprotein (HDL) cholesterol was measured by precipitating non-HDL cholesterol with dextran sulfate-magnesium chloride using a centrifuge and measuring cholesterol in the supernatant. Serum triglyceride was determined by an enzymatic colorimetric method (glycerol phosphate oxidase-phenol + aminophenazone). Fasting blood glucose was measured using the glucose oxidase method25 on a YSI model 2300 StatPlus Analyzer (YSI Corporation, Yellow Springs, OH) (mean coefficient of variation 2.9%–3.3%). Medication data (antihypertensive drugs, lipid-lowering drugs, and medication for diabetes) were coded using the British National Formulary.
The definition of metabolic abnormality was 2 or more of the following components20: 1) triglycerides ≥1.69 mmol/L or lipid-lowering drugs, 2) systolic blood pressure ≥130 mm Hg, diastolic blood pressure ≥85 mm Hg, or antihypertensive drugs, 3) glucose ≥5.6 mmol/L or medications for diabetes, and 4) HDL cholesterol <1.04 mmol/L for men and <1.29 mmol/L for women. We used this definition along with data on BMI to create 6 categories: normal weight-metabolically normal, overweight-metabolically normal, obese-metabolically normal, normal weight-metabolically abnormal, overweight-metabolically abnormal, and obese-metabolically abnormal.
Covariates (assessed 1991–1993).
Included were age, sex, and education, the highest qualification on leaving full-time education and categorized as lower secondary school or less, higher secondary school (usually achieved at age 18), university, or higher degree.
Cognitive function (assessed 1997–1999, 2002–2004, and 2007–2009).
Cognitive testing was introduced to the study in 1997–1999 and undertaken on all participants who consented. The cognitive test battery consists of4standard tasks. First, a timed test (10 minutes) of reasoning, the Alice Heim 4-I, composed of a series of 65 verbal and mathematical reasoning items of increasing difficulty is given26 Second, a 20-word free recall test to test short-term verbal memory is used. In addition,2measures of verbal fluency,27 phonemic and semantic, are combined in the analysis. Subjects were asked to recall in writing in 1 minute for each test as many words beginning with S (phonemic fluency) and as many animal names (semantic fluency) as they could. Besides these 3 scores (memory, reasoning, and verbal fluency), a global cognitive score was created using all the tests described above by first standardizing the raw scores on each test to z scores (mean 0; SD 1). The z scores were then averaged to yield the global cognitive score. In the longitudinal analysis, the standardization to the z score was performed using the mean and SD from 1997–1999. Previous research has used global scores constructed in this manner to minimize problems due to measurement error on the individual tests.28
Statistical analysis.
All analyses were conducted using STATA 11. Participant characteristics were calculated as percentages or mean (SD), when appropriate, by BMI category. We first examined association of BMI and metabolic status (1991–1993) with the first measure of cognitive function, assessed in 1997–1999 and referred to as the baseline (figure e-1 on the Neurology® Web site at www.neurology.org). In these analyses, we first examined separately the association of BMI categories and each of the 4 components included in the definition of metabolic abnormality with cognition using linear regression. Then, we used the 6 BMI-metabolic status phenotypes to assess the association with cognition using linear regression. All analyses were adjusted for age, sex, and education.
Linear mixed models29 were used to estimate the longitudinal association of the BMI-metabolic status phenotypes (assessed in 1991–1993) with cognitive decline (3 assessments, 1997–1999, 2002–2004, and 2007–2009). Mixed models use all available data over the follow-up, take into account the fact that repeated measures on the same individual are correlated with each other, and can handle missing data. In these analyses both the intercept and the slope (modeled using a linear term) were fitted as random effects, allowing individuals to have different cognitive scores at baseline and different rates of cognitive decline over the follow-up. These models yielded an estimate of mean 10-year decline in cognitive scores and the associated 95% confidence interval (CI) in the 6 BMI-metabolic status groups. These analyses were adjusted for age, sex, and education. The interaction term between gender, time, and the BMI-metabolic status groups suggested similar cognitive decline in men and women (all p values between 0.70 and 0.87), leading us to combine men and women in the analysis. For both the baseline and the longitudinal analysis, we tested for a linear trend as a function of BMI categories in analyses stratified by metabolic status.
RESULTS
Data on BMI and metabolic factors were available in 1991–1993 for 7,793 participants (figure e-1). Compared with the excluded individuals, the participants included in the analyses (n = 6,401) were more likely to be men (71.2% vs 62.4%, p < 0.001), to be younger (49.4 vs 50.4 years in 1991–1993, p < 0.001), and to have a university degree (29.2% vs 19.8%, p < 0.001) and were less likely to be obese (9.1% vs 13.3%, p < 0.0001) and to die over the follow-up (hazard ratio adjusted for age 0.26; 95% CI 0.22–0.31). For 982 participants in the baseline analyses, data on cognitive function were missing in 1997–1999 and were drawn from 2002–2004. Of the 6,401 individuals in the longitudinal analysis on cognitive decline, 4,210 (65.8%) had data at all 3 waves, 1,442 (22.5%) at 2 waves, and 749 (11.7%) at 1 wave.
The characteristics of the 6,401 participants included in the analysis are presented in table 1: 27.6% had high triglycerides, 39.2% had high blood pressure, 21.6% had high fasting glucose, 19.1% had low HDL cholesterol, and 31.0% had 2 or more metabolic abnormalities. The most common risk factor combinations were 15.1% with high blood pressure-high triglycerides, 11.8% with high blood pressure-high glucose, 11.7% with low HDL cholesterol-high triglycerides, 9.4% with high blood pressure-low HDL cholesterol, 8.2% with high fasting glucose-high triglycerides, and 4.8% with high glucose-low HDL cholesterol. An adverse metabolic profile, on all 4 markers, was more prevalent in obese participants than in their nonobese counterparts. Of the 582 obese individuals, 60.1% (n = 350) were categorized as being metabolically abnormal.
Table 1.
Sample characteristics at baseline (phase 3, 1991–1993)
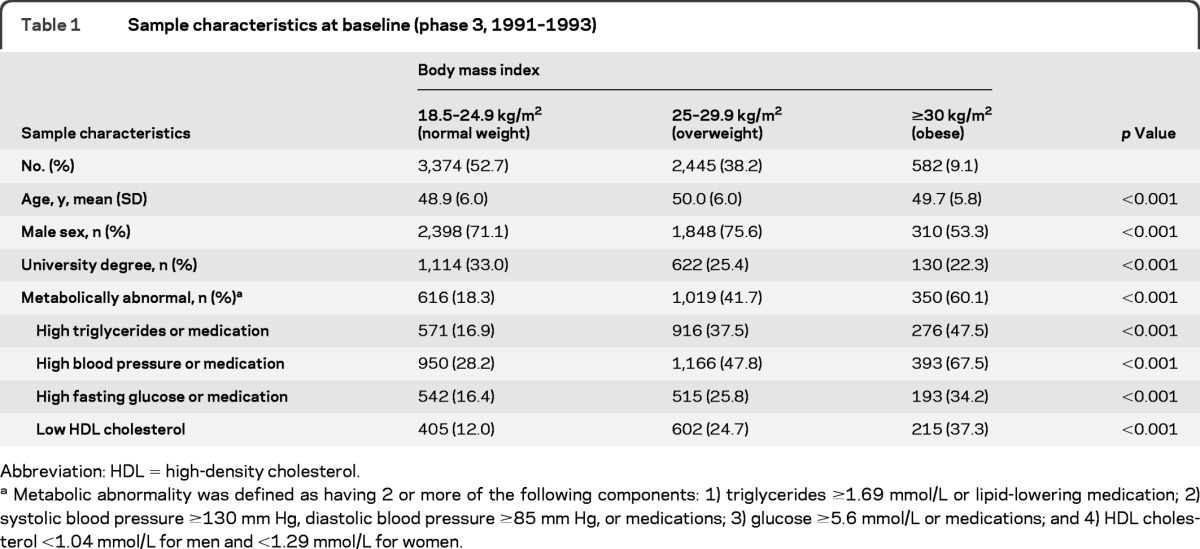
Abbreviation: HDL = high-density cholesterol.
Metabolic abnormality was defined as having 2 or more of the following components: 1) triglycerides ≥1.69 mmol/L or lipid-lowering medication; 2) systolic blood pressure ≥130 mm Hg, diastolic blood pressure ≥85 mm Hg, or medications; 3) glucose ≥5.6 mmol/L or medications; and 4) HDL cholesterol <1.04 mmol/L for men and <1.29 mmol/L for women.
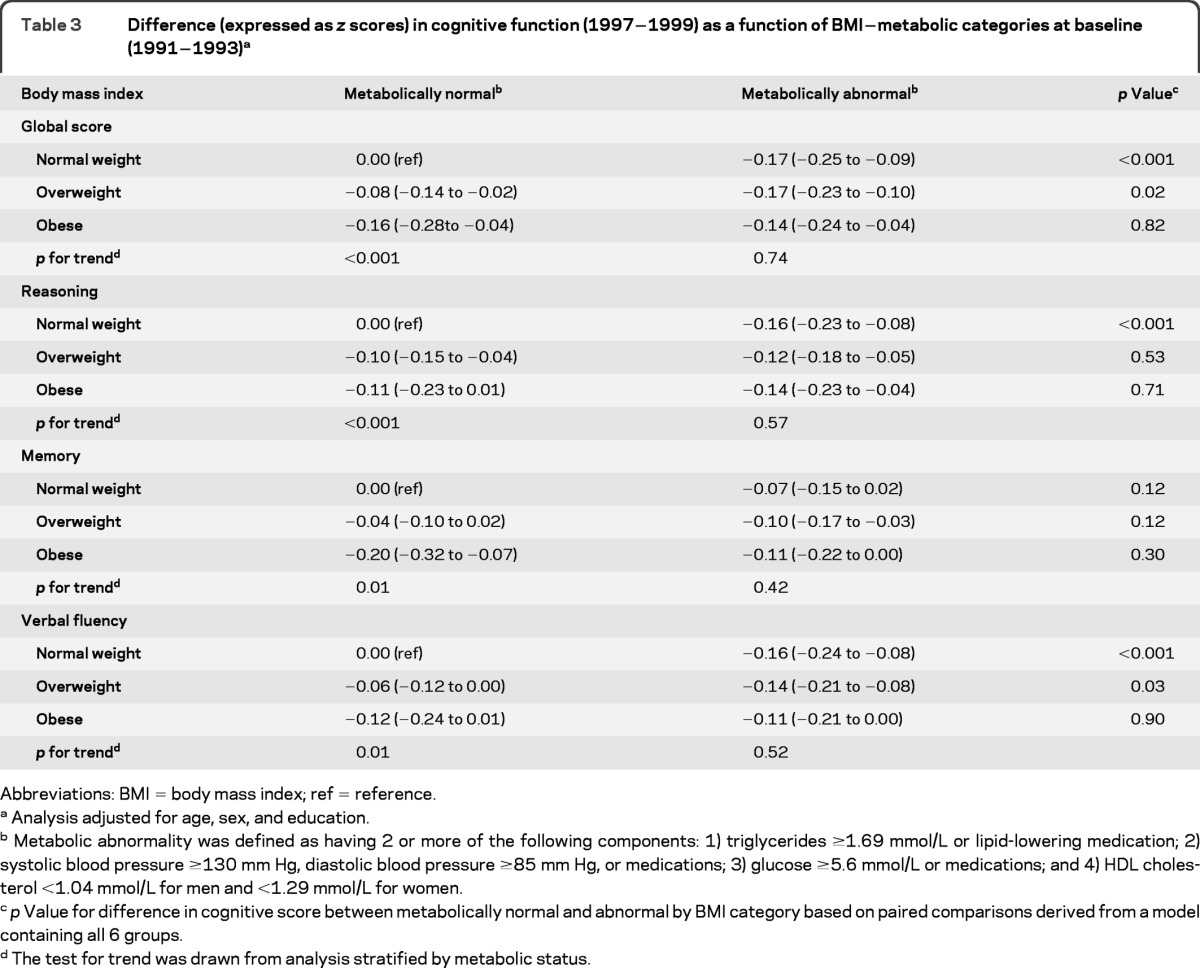
Table 2 presents the baseline associations of BMI categories and metabolic status markers with reasoning, memory, verbal fluency, and global cognition. BMI categories and all components used to define metabolic abnormality, except the fasting glucose component, were associated with cognitive function (separate models were used to derive estimates). Table 3 shows these associations using the 6 BMI-metabolic categories; compared with the normal weight-metabolically normal group, all the other 5 groups had poorer global cognitive scores. In the metabolically normal group, there was a graded association between higher BMI and lower cognition as indicated by the tests for trend (all p < 0.01) (table 3). This was not the case in those who had metabolic abnormalities (p for trend ranged from 0.42 to 0.74). We also undertook pairwise comparisons as a function of metabolic status (right-hand column, table 3) by changing the reference category but keeping all 6 groups in the analysis. For global cognition, these analyses show that in the normal weight group cognition was poorer in participants with metabolic abnormalities than in those who were metabolically normal (p < 0.001). This was also true for the overweight individuals (p = 0.02) but not the obese individuals (p = 0.82). In fact, there were no differences between the metabolically normal and abnormal obese individuals on scores of reasoning (p = 0.71), memory (p = 0.30), or verbal fluency (p = 0.90).
Table 2.
Association (expressed as z scores) between metabolic factors and BMI at baseline (1991–1993) and cognition (1997–1999)a

Abbreviations: BMI = body mass index; HDL = high-density lipoprotein; ref = reference.
Separate analyses for each exposure, adjusted for age, sex, and education.
Metabolic abnormality was defined as having 2 or more of the following components: 1) triglycerides ≥1.69 mmol/L or lipid-lowering medication; 2) systolic blood pressure ≥130 mm Hg, diastolic blood pressure ≥85 mm Hg, or medications; 3) glucose ≥5.6 mmol/L or medications; and 4) HDL cholesterol <1.04 mmol/L for men and <1.29 mmol/L for women.
Reference category in these analyses is composed of those without the metabolic abnormality in question.
Table 3.
Difference (expressed as z scores) in cognitive function (1997−1999) as a function of BMI−metabolic categories at baseline (1991−1993)a
Abbreviations: BMI = body mass index; ref = reference.
Analysis adjusted for age, sex, and education.
Metabolic abnormality was defined as having 2 or more of the following components: 1) triglycerides ≥1.69 mmol/L or lipid-lowering medication; 2) systolic blood pressure ≥130 mm Hg, diastolic blood pressure ≥85 mm Hg, or medications; 3) glucose ≥5.6 mmol/L or medications; and 4) HDL cholesterol <1.04 mmol/L for men and <1.29 mmol/L for women.
p Value for difference in cognitive score between metabolically normal and abnormal by BMI category based on paired comparisons derived from a model containing all 6 groups.
The test for trend was drawn from analysis stratified by metabolic status.
Table 4 presents 10-year cognitive decline in the 6 BMI-metabolic status categories. These results show decline in global cognition of approximately  SD (−0.40; 95% CI −0.42 to −0.38) in the normal weight-metabolically normal group. Except for global cognition, the rate of decline was mostly similar in all groups, implying that the baseline association (table 3), the relative difference in cognitive scores between these categories, tracks over time. For the global score there was some evidence of greater cognitive decline in the metabolically abnormal-obese group compared with the normal weight (both metabolically normal and abnormal) individuals (p = 0.03, pairwise comparison). The test for trend (p = 0.03) in the metabolically abnormal group suggested faster cognitive decline with increasing BMI.
Table 4.
10-year cognitive decline (expressed as z scores) by BMI categories and metabolic status at baseline (1991–1993)a

Abbreviation: BMI = body mass index.
Analysis using mixed models, adjusted for age at baseline, sex, education, and their interactions (when p < 0.10) with time and with the BMI−metabolic status measure.
Metabolic abnormality was defined as having 2 or more of the following components: 1) triglycerides ≥1.69 mmol/L or lipid-lowering medication; 2) systolic blood pressure ≥130 mm Hg, diastolic blood pressure ≥85 mm Hg, or medications; 3) glucose ≥5.6 mmol/L or medications; and 4) HDL cholesterol <1.04 mmol/L for men and <1.29 mmol/L for women.
p Value for difference in cognitive score between metabolically normal and abnormal by BMI category based on paired comparisons derived from a model containing all 6 groups.
The test for trend was drawn from analysis stratified by metabolic status.
DISCUSSION
The present study assessed the association of phenotypes defined using BMI categories and metabolic status with cognitive function and decline. Our results show that cognition at baseline and cognitive decline over the 10-year follow-up were similar in the metabolically normal-obese (or metabolically healthy-obese) and the metabolically abnormal-obese individuals. In the metabolically normal group, lower BMI was associated with better cognition at baseline and similar cognitive decline as a function of BMI, suggesting that baseline differences were maintained but did not increase over time. In the metabolically abnormal group, there were no differences in cognitive performance at baseline as a function of BMI. However, the longitudinal analysis in this group, statistically significant only for the global measure, suggests faster cognitive decline over 10 years with increasing BMI.
The results at baseline provide no support for an accumulation of risk arising from the presence of both obesity and metabolic abnormality. Thus, either obesity or metabolic abnormality is sufficient to affect cognition, and these factors seem not to exert additive influences on cognition. The longitudinal analyses appear to suggest some accumulation of risk, with the decline being somewhat greater in individuals with both metabolic abnormalities and obesity. We note that this trend is evident for all tests but statistically significant only for the global cognitive score. Because measurement error is minimized in this type of global score,28 there appears to be some evidence of accumulation of risk concerning cognitive decline. However, there was no evidence that the metabolically normal obese group had a better cognitive profile than the metabolically abnormal obese group.
In relation to cardiovascular disease, some17–19 but not all, previous studies20–22 have reported better outcomes for metabolically healthy obese than for metabolically unhealthy obese individuals. Our results show this not to be the case for cognitive function. Some of the attempts to examine obesity phenotypes have constructed 4 groups: normal weight, overweight, obese healthy, and obese unhealthy.30 However, it is clear from previous results31 and our data that the normal and overweight groups are not homogeneous in terms of metabolic health. Our results show that among normal-weight and overweight individuals, an adverse metabolic profile was associated with poorer cognitive function. In our sample, 18% of the normal-weight individuals had metabolic abnormalities, a somewhat lower figure than the 21.1% in women and 30.1% in men reported for North American data using slightly different criteria to define metabolic abnormalities.12 The poorer cognition in the normal weight-metabolically abnormal group in our data cannot be attributed to these individuals having become obese at the end of the follow-up. BMI data from the end of the follow-up, concurrent with the cognitive testing, showed that a similar proportion of individuals in the normal weight-healthy and normal weight-unhealthy group (1.8% vs 1.6%) had become obese at the end of the follow-up.
Because age is known to modify the association between adiposity and cognitive outcomes,2,7 we examined this association in individuals whose mean age was 56 years at the start of the cognitive testing. The magnitude of the effect at baseline was important; for example, in metabolically normal individuals, the difference in global cognitive score for obese individuals (0.16 SD, table 3) was comparable to 3.8 years of cognitive decline (the 10-year decline being 0.42 SD in this group, table 4). However, the longitudinal analyses show faster decline as a function of BMI status only in the metabolically abnormal group. The cross-sectional and longitudinal analyses taken together suggest that the effects of BMI and metabolic status persist over time, with some suggestion of a faster decline in those with an adverse BMI and metabolic profile.
There is considerable evidence from single studies and meta-analyses to suggest that obesity in midlife is associated with poorer cognition9,10 and greater risk of dementia in later life.1,2,5,6 The extent to which these associations are causal remains unclear. Cognitive reserve,32 genetic factors,33 or fetal exposures34 could also underlie these associations. Because our results were robust to adjustment for education and other markers of reserve such as height and occupation (results not shown), cognitive reserve is an unlikely explanation for our findings. Besides examining the effect of genetic factors and putative fetal exposures, further research also needs to take into account the duration of obesity and metabolic status and perhaps assess cognitive decline over a longer follow-up to allow better understanding of the association between obesity and cognition.
There are several plausible mechanisms underlying the association between obesity and adverse cognitive outcomes. Vascular pathologies (white matter lesions, lacunar infarcts, hypoperfusion, blood vessel inflammation, and cerebrovascular disease) are seen to be the primary mechanism underlying this association.2 Other possible mechanisms relate to secretions of adipose tissue, leptin, and adiponectin in particular, which affect the aging brain.2,6 Previous studies have shown high BMI to be associated with poor performance in multiple cognitive domains.8,10,35 Our results show associations at baseline across the cognitive domains examined.
There is considerable evidence to show adverse effects of obesity on health.14–16 As obesity becomes more prevalent (400 million adults were obese in 2005 with the figure projected to rise to more than 700 million by 2015),36 questions are raised about the ubiquity of its impact on health. The idea of an obesity spectrum suggests that the severity and duration of obesity are important.37 Recent analysis using data from nearly 900,000 individuals show that each 5 kg/m2 higher BMI was associated with approximately 30% higher overall mortality.16 There is also emerging evidence of the effect of duration of obesity, every 2 obese-years increasing mortality risk by 6%.38 In addition, it is known that early life measures of obesity predict late life measures, which provides evidence of longitudinal stability or tracking.39 Thus, to estimate the impact of obesity on cognition, the number of years lived with obesity is likely to be important.
The main strengths of this study include the large sample size, comprehensive assessment of cognition, and the 5-year delay between the assessment of the exposure and the first cognitive measure, ruling out, to some extent, reverse causation biases. We used a battery of cognitive tests and present results using the global cognitive score, allowing replication across studies in the future. The most important limitation of the study is that participants of the Whitehall II study are mainly office-based civil servants, not fully representative of the British population because the study does not include the unemployed or individuals in blue collar professions.
In sum, given the rapid increase in obesity levels globally, it is important to estimate its impact on health from a public health point of view. If the concept of MHO holds, then the estimation of the negative impact of obesity on health needs to be revisited. Our data suggest no such heterogeneity in the impact of obesity on cognitive performance in early old age, because obese individuals who are otherwise metabolically healthy have a risk of poor cognition similar to that of their obese metabolically unhealthy counterparts.
Supplementary Material
ACKNOWLEDGMENT
The authors thank all participating civil service departments and their welfare, personnel, and establishment officers; the British Occupational Health and Safety Agency; the British Council of Civil Service Unions; all participating civil servants in the Whitehall II study; and all members of the Whitehall II study team. The Whitehall II study team comprises research scientists, statisticians, study coordinators, nurses, data managers, administrative assistants and data entry staff, who make the study possible.
GLOSSARY
- BMI
body mass index
- HDL
high-density lipoprotein
- MHO
metabolically healthy obesity
Footnotes
Supplemental data at www.neurology.org
AUTHOR CONTRIBUTIONS
A.S.-M. wrote the first draft and undertook the analysis with A.D., A.S.-M. and A.D. carried out the statistical analysis. All authors contributed to interpretation of results and revisions of the article.
DISCLOSURE
A. Singh-Manoux receives research support from the NIH (NIA R01-AG013196 [PI], NIA R01-AG034454 [PI]), and the British MRC (G0902037 [co-I]). S. Czernichow, A. Elbaz, A. Dugravot, S. Sabia, G. Hagger-Johnson, S. Kaffashian, M. Zins, E.J. Brunner, and H. Nabi report no disclosures. M. Kivimäki receives research support from the NIH (NHLBI R01-HL036310 [PI] and NIA R01-AG034454 [PI]), the British MRC (G0902037 [co-I]), and the Academy of Finland [PI]. Go to Neurology.org for full disclosures.
REFERENCES
- 1. Anstey KJ, Cherbuin N, Budge M, Young J. Body mass index in midlife and late-life as a risk factor for dementia: a meta-analysis of prospective studies. Obes Rev 2011;12:e426–e437 [DOI] [PubMed] [Google Scholar]
- 2. Gustafson D. Adiposity indices and dementia. Lancet Neurol 2066;5:713–720 [DOI] [PubMed] [Google Scholar]
- 3. Xu WL, Atti AR, Gatz M, Pedersen NL, Johansson B, Fratiglioni L. Midlife overweight and obesity increase late-life dementia risk: a population-based twin study. Neurology 2011;76:1568–1574 [DOI] [PMC free article] [PubMed] [Google Scholar]
- 4. Gustafson D, Rothenberg E, Blennow K, Steen B, Skoog I. An 18-year follow-up of overweight and risk of Alzheimer disease. Arch Intern Med 2003;163:1524–1528 [DOI] [PubMed] [Google Scholar]
- 5. Whitmer RA, Gunderson EP, Barrett-Connor E, Quesenberry CP, Jr, Yaffe K. Obesity in middle age and future risk of dementia: a 27 year longitudinal population based study. BMJ 2005;330:1360. [DOI] [PMC free article] [PubMed] [Google Scholar]
- 6. Beydoun MA, Beydoun HA, Wang Y. Obesity and central obesity as risk factors for incident dementia and its subtypes: a systematic review and meta-analysis. Obes Rev 2008;9:204–218 [DOI] [PMC free article] [PubMed] [Google Scholar]
- 7. Luchsinger JA, Patel B, Tang MX, Schupf N, Mayeux R. Measures of adiposity and dementia risk in elderly persons. Arch Neurol 2007;64:392–398 [DOI] [PMC free article] [PubMed] [Google Scholar]
- 8. Cournot M, Marquie JC, Ansiau D, et al. Relation between body mass index and cognitive function in healthy middle-aged men and women. Neurology 2006;67:1208–1214 [DOI] [PubMed] [Google Scholar]
- 9. Sabia S, Kivimaki M, Shipley M, Marmot M, Singh-Manoux A. Body mass index over the adult lifecourse and cognition in late midlife: the Whitehall II cohort study. Am J Clin Nutr 2009;89:601–607 [DOI] [PMC free article] [PubMed] [Google Scholar]
- 10. Elias MF, Elias PK, Sullivan LM, Wolf PA, D'Agostino RB. Obesity, diabetes and cognitive deficit: the Framingham Heart Study. Neurobiol Aging 2005;26(suppl 1): 11–16 [DOI] [PubMed] [Google Scholar]
- 11. Whitmer RA, Gustafson DR, Barrett-Connor E, Haan MN, Gunderson EP, Yaffe K. Central obesity and increased risk of dementia more than three decades later. Neurology 2008;71:1057–1064 [DOI] [PubMed] [Google Scholar]
- 12. Wildman RP, Muntner P, Reynolds K, et al. The obese without cardiometabolic risk factor clustering and the normal weight with cardiometabolic risk factor clustering: prevalence and correlates of 2 phenotypes among the US population (NHANES 1999–2004). Arch Intern Med 2008;168:1617–1624 [DOI] [PubMed] [Google Scholar]
- 13. Karelis AD, Brochu M, Rabasa-Lhoret R. Can we identify metabolically healthy but obese individuals (MHO)? Diabetes Metab 2004;30:569–572 [DOI] [PubMed] [Google Scholar]
- 14. Must A, Spadano J, Coakley EH, Field AE, Colditz G, Dietz WH. The disease burden associated with overweight and obesity. JAMA 1999;282:1523–1529 [DOI] [PubMed] [Google Scholar]
- 15. World Health Organization Diet, Nutrition and the Prevention of Chronic Diseases. WHO Technical Report Series 916. Geneva, Switzerland: World Health Organization; 2003 [PubMed] [Google Scholar]
- 16. Whitlock G, Lewington S, Sherliker P, et al. Body-mass index and cause-specific mortality in 900 000 adults: collaborative analyses of 57 prospective studies. Lancet 2009;373:1083–1096 [DOI] [PMC free article] [PubMed] [Google Scholar]
- 17. Karelis AD, Faraj M, Bastard JP, et al. The metabolically healthy but obese individual presents a favorable inflammation profile. J Clin Endocrinol Metab 2005;90:4145–4150 [DOI] [PubMed] [Google Scholar]
- 18. Calori G, Lattuada G, Piemonti L, et al. Prevalence, metabolic features, and prognosis of metabolically healthy obese Italian individuals: the Cremona Study. Diabetes Care 2011;34:210–215 [DOI] [PMC free article] [PubMed] [Google Scholar]
- 19. Meigs JB, Wilson PW, Fox CS, et al. Body mass index, metabolic syndrome, and risk of type 2 diabetes or cardiovascular disease. J Clin Endocrinol Metab 2006;91:2906–2912 [DOI] [PubMed] [Google Scholar]
- 20. Kuk JL, Ardern CI. Are metabolically normal but obese individuals at lower risk for all-cause mortality? Diabetes Care 2009;32:2297–2299 [DOI] [PMC free article] [PubMed] [Google Scholar]
- 21. Arnlov J, Ingelsson E, Sundstrom J, Lind L. Impact of body mass index and the metabolic syndrome on the risk of cardiovascular disease and death in middle-aged men. Circulation 2010;121:230–236 [DOI] [PubMed] [Google Scholar]
- 22. Lind L, Siegbahn A, Ingelsson E, Sundstrom J, Arnlov J. A detailed cardiovascular characterization of obesity without the metabolic syndrome. Arterioscler Thromb Vasc Biol 2011;31:27–34 [DOI] [PubMed] [Google Scholar]
- 23. Marmot M, Brunner E. Cohort profile: the Whitehall II study. Int J Epidemiol 2005;34:251–256 [DOI] [PubMed] [Google Scholar]
- 24. Obesity: preventing and managing the global epidemic. Report of a WHO consultation. World Health Organ Tech Rep Ser 2000;894:1–253 [PubMed] [Google Scholar]
- 25. Cooper GR. Methods for determining the amount of glucose in blood. CRC Crit Rev Clin Lab Sci 1973;4:101–145 [DOI] [PubMed] [Google Scholar]
- 26. Heim AW. A.H.4 Group Test of General Intelligence. Windsor, UK: NFER-Nelson Publishing Company Ltd.; 1970 [Google Scholar]
- 27. Borkowski JG, Benton AL, Spreen O. Word fluency and brain damage. Neuropsychologica 1967;5:135–140 [Google Scholar]
- 28. Wilson RS, Leurgans SE, Boyle PA, Schneider JA, Bennett DA. Neurodegenerative basis of age-related cognitive decline. Neurology 2010;75:1070–1078 [DOI] [PMC free article] [PubMed] [Google Scholar]
- 29. Laird NM, Ware JH. Random-effects models for longitudinal data. Biometrics 1982;38:963–974 [PubMed] [Google Scholar]
- 30. Stefan N, Kantartzis K, Machann J, et al. Identification and characterization of metabolically benign obesity in humans. Arch Intern Med 2008;168:1609–1616 [DOI] [PubMed] [Google Scholar]
- 31. Ruderman N, Chisholm D, Pi-Sunyer X, Schneider S. The metabolically obese, normal-weight individual revisited. Diabetes 1998;47:699–713 [DOI] [PubMed] [Google Scholar]
- 32. Stern Y. What is cognitive reserve? Theory and research application of the reserve concept. J Int Neuropsychol Soc 2002;8:448–460 [PubMed] [Google Scholar]
- 33. Ho AJ, Stein JL, Hua X, et al. A commonly carried allele of the obesity-related FTO gene is associated with reduced brain volume in the healthy elderly. Proc Natl Acad Sci USA 2010;107:8404–8409 [DOI] [PMC free article] [PubMed] [Google Scholar]
- 34. Gillman MW, Barker D, Bier D, et al. Meeting report on the 3rd International Congress on Developmental Origins of Health and Disease (DOHaD). Pediatr Res 2007;61:625–629 [DOI] [PubMed] [Google Scholar]
- 35. Sturman MT, de Leon CF, Bienias JL, Morris MC, Wilson RS, Evans DA. Body mass index and cognitive decline in a biracial community population. Neurology 2007;70:360–367 [DOI] [PubMed] [Google Scholar]
- 36.Obesity and overweight [online] [Accessed January 14, 2012]. Available at: http://www.who.int/mediacentre/factsheets/fs311/en/
- 37. McEvoy JW, Blaha MJ, Nasir K. “Metabolically benign” obesity: a wolf in sheep's clothing. Atherosclerosis 2011;217:74–76 [DOI] [PubMed] [Google Scholar]
- 38. Abdullah A, Wolfe R, Stoelwinder JU, et al. The number of years lived with obesity and the risk of all-cause and cause-specific mortality. Int J Epidemiol 2011;40:985–996 [DOI] [PubMed] [Google Scholar]
- 39. Ulmer H, Kelleher C, Diem G, Concin H. Long-term tracking of cardiovascular risk factors among men and women in a large population-based health system: the Vorarlberg Health Monitoring & Promotion Programme. Eur Heart J 2003;24:1004–1013 [DOI] [PubMed] [Google Scholar]
Associated Data
This section collects any data citations, data availability statements, or supplementary materials included in this article.