Abstract
Yeast to directly convert cellulose and, especially, the microcrystalline cellulose into bioethanol, was engineered through display of minicellulosomes on the cell surface of Saccharomyces cerevisiae. The construction and cell surface attachment of cellulosomes were accomplished with two individual miniscaffoldins to increase the display level. All of the cellulases including a celCCA (endoglucanase), a celCCE (cellobiohydrolase), and a Ccel_2454 (β-glucosidase) were cloned from Clostridium cellulolyticum, ensuring the thermal compatibility between cellulose hydrolysis and yeast fermentation. Cellulases and one of miniscaffoldins were secreted by α-factor; thus, the assembly and attachment to anchoring miniscaffoldin were accomplished extracellularly. Immunofluorescence microscopy, flow cytometric analysis (FACS), and cellulosic ethanol fermentation confirmed the successful display of such complex on the yeast surface. Enzyme–enzyme synergy, enzyme-proximity synergy, and cellulose–enzyme–cell synergy were analyzed, and the length of anchoring miniscaffoldin was optimized. The engineered S. cerevisiae was applied in fermentation of carboxymethyl cellulose (CMC), phosphoric acid-swollen cellulose (PASC), or Avicel. It showed a significant hydrolytic activity toward microcrystalline cellulose, with an ethanol titer of 1,412 mg/L. This indicates that simultaneous saccharification and fermentation of crystalline cellulose to ethanol can be accomplished by the yeast, engineered with minicellulosome.
Keywords: cellulosic biofuel, multienzyme complex, cellulose degradation, consolidated bioprocessing, self-assembly
Cellulosic biomass is the most abundant renewable resources in the world. Producing a second generation bioethanol from cellulose can sustainably and affordably supply a large proportion of fuel with great environmental benefits and without threatening food supplies and biodiversity (1–3). However, the key difficulty of industrial production of cellulosic bioethanol is in converting cellulose into fermentable sugars (4). In a traditional process, cellulosic biomass is synergistically hydrolyzed by commercial cellulases, but the large consumption of cellulases and the independent steps of saccharification and fermentation make it costly and time-consuming. Lynd et al. (5) proposed a method known as consolidated bioprocessing (CBP) that combines enzyme production, cellulose hydrolysis, and fermentation into a single process. It has been reported to significantly reduce the cost of cellulosic ethanol production (6).
Saccharomyces cerevisiae is an ideal engineered candidate for CBP to achieve the simultaneous cellulose saccharification and ethanol fermentation, because it has high ethanol productivity, strong ethanol tolerance, and clear hereditary information (7, 8). In fact, as early as in the 1990s, researchers have begun to use cell secretion or cell surface display to endow the S. cerevisiae with noncomplexed cellulase systems (9, 10). In such systems, cellulases were either cell-secreted into culture medium as free forms or independently displayed on yeast cell surface. The engineered S. cerevisiae were able to use amorphous cellulose directly, but ethanol yields were quite low. Compared with the noncomplexed cellulase system, enzymes in complexed cellulase system (cellulosome) are assembled by noncatalytic scaffoldin protein through high-affinity interactions between scaffoldin-borne cohesins and enzyme-borne dockerins (6). Scaffoldin usually contains a cellulose-binding domain (CBD) that can anchor the entire complex onto the cellulosic substrate (11). It has been proposed that the grafting of cellulases onto scaffoldin leads to a spatial enzyme proximity that potentiates the synergism between catalytic units, which is further augmented by the enzyme–substrate targeting through CBD (12). Cellulosome can also minimize the distance over which cellulose hydrolysis products must diffuse, allowing the efficient uptake of oligosaccharides by the host (13, 14).
Bacterial cellulosomes can be classified into two types, i.e., (i) those containing a single scaffoldin, which are characteristic of most mesophilic Clostridia; and (ii) those that present multiple types of scaffoldins such as Clostridium thermocellum (15). In C. thermocellum, the interaction between enzyme-borne type I dockerin and scaffoldin-borne type I cohesin determines the incorporation of cellulases into cellulosome. The interaction between the type II dockerin on cellulosomal scaffoldin and the type II cohesins on anchoring scaffoldin grafts the cellulosome onto the cell surface (16). Theoretically, up to 63 cellulosomal enzymes can be attached to the anchoring scaffoldin. Such an organization may explain why C. thermocellum is so efficient at hydrolyzing microcrystalline cellulose (17). During the past 2 y, several attempts have been reported to construct minicellulosomes with single scaffoldin on the S. cerevisiae surface (18–21). The recombinant yeast has been able to hydrolyze β-glucan, carboxymethyl cellulose (CMC), or amorphous cellulose, and the activity of cellulosome was observed as higher than that of free cellulases. However, the direct conversion of microcrystalline cellulose to ethanol remains a challenge. The low enzyme-display level or activity may lead to a slow catalysis and low fermentation efficiency (18).
In the present work, we demonstrate the functional assembly of cellulosomes with two miniscaffoldins to increase the display level of complex on the S. cerevisiae surface. The type I cohesin–dockerin interaction was introduced to construct minicellulosomes, whereas the type II cohesin–dockerin interaction was used to mediate the anchoring of cellulosomes onto the cell. The species specificity of such two interactions ensures a clear distinction between the cellulosome assembly and cell surface attachment and also makes the grafting of catalytic units controllable. The recombinant S. cerevisiae showed the capability of directly using celluloses, especially microcrystalline cellulose, for bioethanol production.
Results
Minicellulosome Architecture and Its Assembly Mechanism.
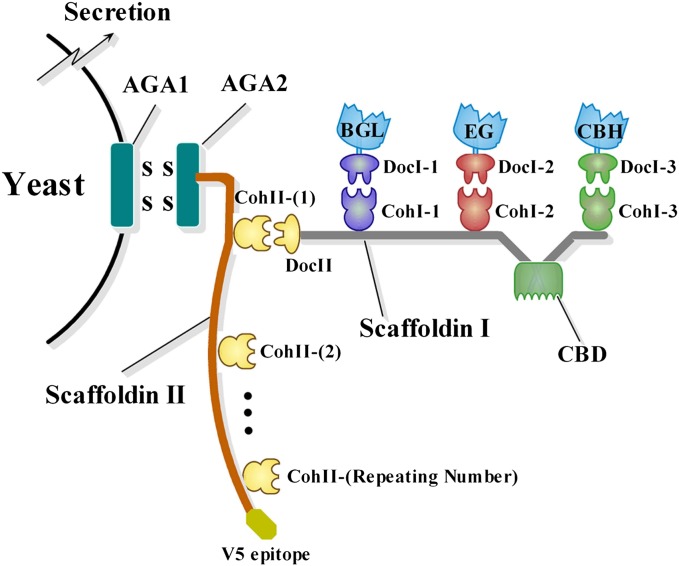
The recombinant strains used in this study are summarized in SI Text. As shown in Fig. 1, the minicellulosome was composed of a scaffoldin I and three catalytic units. Scaffoldin I contained a C-terminal type II dockerin (DocII), a CBD, and three type I cohesins (CohI-1, CohI-2, and CohI-3). The catalytic units included a celCCA [endoglucanase (EG)], a celCCE [cellobiohydrolase (exoglucanase) (CBH)], and a Ccel_2454 [β-glucosidase (BGL)], making the minicellulosome meet the minimum requirement for crystalline cellulose hydrolysis. All of the cloned cellulases used were from mesophilic Clostridia, ensuring the thermal compatibility between cellulose hydrolysis and yeast fermentation. Each cellulase had an exogenous or native type I dockerin (DocI-1, DocI-2, and DocI-3), which could be docked individually with type I cohesins on the scaffoldin I. DocI-1/CohI-1, DocI-2/CohI-2, and DocI-3/CohI-3 were from Clostridium cellulovorans, Clostridium cellulolyticum, and C. thermocellum, respectively, the interactions of which were species-specific (22). The scaffoldin II that contained one to four repeating type II cohesins (CohII) was yeast surface–displayed using a pYD1 Yeast Display Vector Kit (Invitrogen). The C terminus of the scaffoldin II was tagged with a V5 epitope for further immunofluorescence analysis. CohII failed to recognize any type I cohesins; rather, it was bound specifically to DocII. This arrangement served to anchor the whole minicellulosome to the yeast cell surface. Scaffoldin I and cellulases were secreted into culture medium by α-factor and assembled extracellularly. The binding of minicellulosomes onto scaffoldin II inside the cells would increase tremendously the difficulties in surface displaying.
Fig. 1.
Self-surface assembly of minicellulosomes on the yeast cell surface. Scaffoldin II was displayed through AGA1 and AGA2 (a yeast display system); V5 epitope was a tag for immunodetection.
Identification of Yeast Surface Display by Immunofluorescence Analysis.
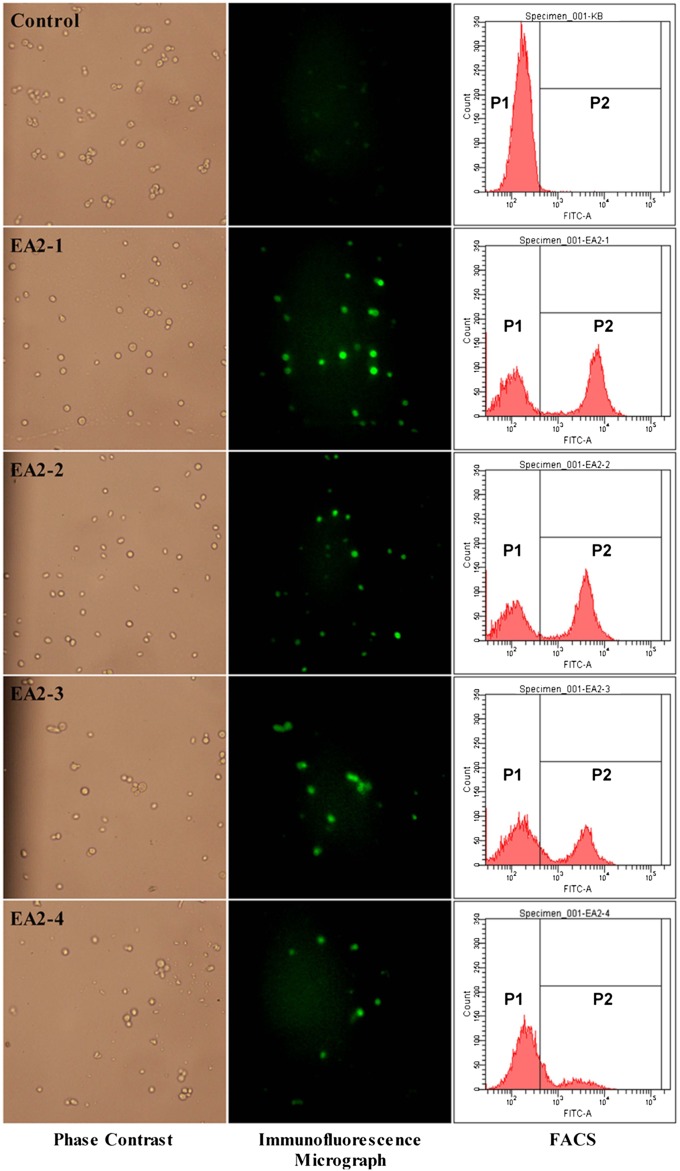
The expression of scaffoldin II on the yeast cell surface was confirmed with immunofluorescence microscopy and flow cytometric analysis (FACS) (Fig. 2). As expected, the control was not immunostained, whereas the recombinant yeast EBY (EA2-1), EBY (EA2-2), EBY (EA2-3), and EBY (EA2-4) were all brightly fluorescent (Fig. 2, immunofluorescence micrograph), indicating that all four different scaffoldin IIs were successfully displayed on the surface of the host. However, the decreasing fluorescent spots observed in EBY (EA2-4) indicate that the display level on this strain was low. FACS data (Fig. 2, FACS) showed similar results: EBY (EA2-1), EBY (EA2-2), and EBY (EA2-3) gave significantly higher fluorescence signals than EBY (EA2-4). The scaffoldin II of EBY (EA2-4) was threefold larger than that of EBY (EA2-1), indicating that large passenger proteins limited the efficiency of surface expression using pYD1 Yeast Display Vector Kit, which was also observed in other display systems (23).
Fig. 2.
Immunofluorescence micrographs and FACS analysis. Yeast cells were probed with mouse anti–V5-FITC monoclonal antibody.
Display Level of Miniscaffoldin II.
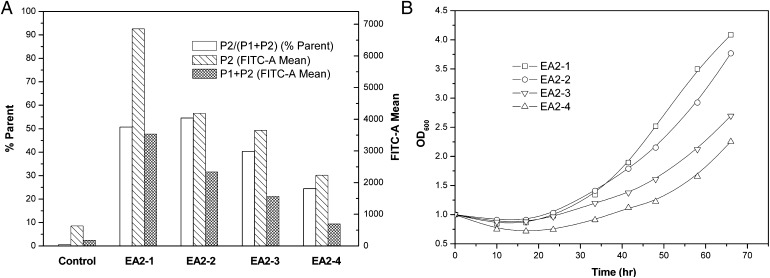
The productivity of minicellulosome depends on the total number of yeast hosts that successfully display scaffoldin II and also depends on the scaffoldin II display levels on such yeasts. The results of FACS analysis (see Fig. 3A) gave the percentage of the positively staining population [P2/(P1 + P2) (% parent)], the mean immunofluorescence intensity of the positively staining population [P2 (FITC-A mean)], and the mean immunofluorescence intensity of all the yeast populations [P1 + P2 (FITC-A mean)].
Fig. 3.
Display level of miniscaffoldin II on the yeast cell surface (A) and cell growth curves during induction (B). Yeast cells were probed with mouse anti–V5-FITC monoclonal antibody. P1 was the negatively staining population, whereas P2 was the positively staining population (see Fig. 2, FACS).
As shown in Fig. 3A, P2/(P1 + P2) (% parent) of EBY (EA2-1) and EBY (EA2-2) were nearly the same (∼50%). Significant declines were observed in EBY (EA2-3) (∼40%) and EBY (EA2-4) (∼25%), suggesting that the percentage of the recombinant yeast cells displaying scaffoldin II decreased when scaffoldin II became larger. It might be caused by the increased metabolic burden and the recombinant plasmids instability. The growth curves of EBY (EA2-1), EBY (EA2-2), EBY (EA2-3), and EBY (EA2-4) during induction (shown in Fig. 3B) might prove such a presumption. As observed, (EA2-3) and EBY (EA2-4) grew much slower than EBY (EA2-1) and EBY (EA2-2). EBY (EA2-1) had the highest P2 (FITC-A mean) (∼7,000) (see Fig. 3A), followed by EBY (EA2-2) (∼4,200), EBY (EA2-3) (∼3,700), and EBY (EA2-4) (∼2,300), indicating that the smaller scaffoldin II had a higher display level on the yeasts that succeeded in scaffoldin II expression. It was consistent with our expectation that the larger fusion protein would take a larger space on the cell surface, resulting in a lower display level, because the cell surface area of each yeast was definite. P1 + P2 (FITC-A mean) was affected by P2/(P1 + P2) (% parent) and P2 (FITC-A mean). Obviously, the highest P1 + P2 (FITC-A mean) was obtained when using EBY (EA2-1) (shown in Fig. 3A), and sharp declines were observed in EBY (EA2-2), EBY (EA2-3), and EBY (EA2-4). Of course, a higher value of P1 + P2 (FITC-A mean) did not indicate higher minicellulosome productivity (discussed below).
Functional Analysis of Minicellulosomes and Optimization of Miniscaffoldin II.
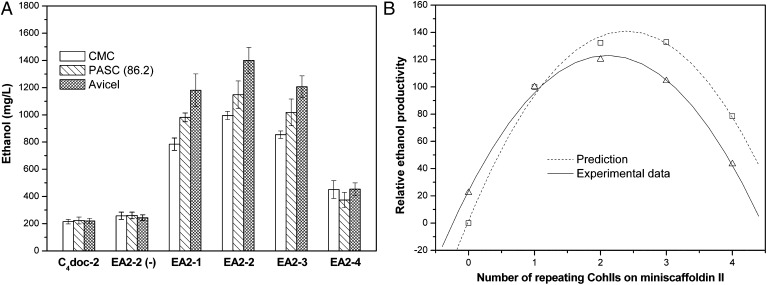
To prove the successful assembly of minicellulosome on the yeast surface and demonstrate its functionality, CMC, phosphoric acid–swollen cellulose [PASC (86.2)], or Avicel (QXTD-Biotechnology, Beijing) was used as the sole carbon source for cellulosic bioethanol production. As shown in Fig. 4A, all of the induced EBY (EA2-1), EBY (EA2-2), EBY (EA2-3), and EBY (EA2-4) showed the capability of directly converting cellulose into ethanol. Cellulose could not get through the cell wall, so it could not be hydrolyzed by intracellular cellulases. Also, the introduced cells were washed twice before fermentation, suggesting that the hydrolysis of cellulose could not be accomplished by the secreted free cellulases. Fig. 4A shows that the ethanol titer of strain EBY [EA2-2 (−)] lacking scaffoldin I was quite low compared with EBY (EA2-1), EBY (EA2-2), EBY (EA2-3), and EBY (EA2-4), indicating that few cellulases were secreted during fermentation. The reason might be the plasmid instability, because the medium used in fermentation did not have any selective pressure for recombinant strains. Therefore, the cellulases functioning in the cellulosic ethanol conversion only possibly appeared on the yeast cell surface, indicating the success in minicellulosome assembly by the recombinant S. cerevisiae EBY100.
Fig. 4.
Functionality of minicellulosomes (A) and optimization of miniscaffoldin II length (B). The data of prediction was the value of P1 + P2 (FITC-A mean, see Fig. 3A) multiplied by the corresponding CohII number; The experimental data means the average ethanol productivity that used CMC, PASC (86.2), and Avicel for the direct fermentation (see Fig. 4A). PASC (86.2) means the cellulose was prepared using 86.2% phosphoric acid. EBY (C4doc-2) was used for CohII = 0.
Interestingly, Avicel was preferred for bioethanol fermentation (see Fig. 4A) in our work, although CMC and PASC were thought more accessible by cellulases (24, 25). The fermentations of S. cerevisiae EBY100 in YPD supplemented with CMC, PASC, or Avicel were compared, and no difference in ethanol titer was found (∼9.5 g/L). Therefore, it could not be the cell physiological changes induced by adding CMC, PASC, or Avicel that caused the difference in ethanol titers. Maybe, the enzyme-proximity synergy (discussed below) and cellulose–enzyme–cell synergy were two of reasons that led to such phenomena. Potential benefits of the cellulose–enzyme–cell complexes for cellulolytic microorganisms have been suggested (6, 14, 26), including preferred access to hydrolysis products and local concentration of cellulases. It has been reported that the binding capacity of CBD was higher for the highly crystalline cellulose (27); thus, using Avicel was most prone to form cellulose–enzyme–cell complex, followed by PASC and CMC. Increasing the viscosity of the medium caused by cellulose would weaken the diffusion of hydrolysis products, indicating the poor fermentation. Addition of CMC induced the highest viscosity, followed by PASC and Avicel. Moreover, it has been reported that swelling of microcrystalline cellulose with the high concentrations of phosphoric acid resulted in a more slowly fermented substrate, despite a decrease in crystallinity and an increase in pore volume (28). This reduced fermentation rate was attributable to the partial conversion of the cellulose from type I to type II allomorph.
Theoretically, the value of P1 + P2 (FITC-A mean) multiplied by the CohII repeating number of corresponding scaffoldin II reflected the minicellulosome productivity. Supposing EBY (EA2-1) was 100%, as shown in Fig. 4B, curves of the prediction and the experimental data for minicellulosome productivity have the similar variation tendency. EBY (EA2-2) had the best performance in cellulosome assembly and bioethanol conversion [995 mg/L, CMC; 1,148 mg/L, PASC (86.2); 1,400 mg/L, Avicel] because of the proper length of scaffoldin II that increased the cellulosome-anchoring level on the cell surface without heavy metabolic burden and serious plasmid instability. Twenty percent (CohII = 0) in experimental data might be induced by incomplete removal of ethanol and glucose before the yeast cells were used in fermentation. For CohII > 1, the experimental data were lower than predicted. It was possible that the steric hindrance among the anchoring minicellulosomes made the scaffoldin II–borne CohIIs not be completely grafted.
Enhancement of Activity by Enzyme–Enzyme Synergy and Enzyme-Proximity Synergy.
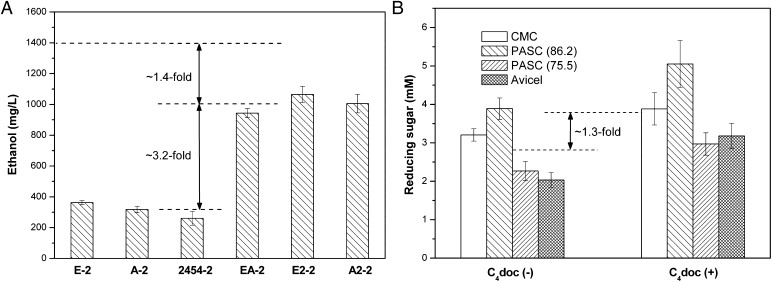
Microorganisms produce multiple enzymes to degrade plant cell materials, known as enzyme systems. Complete hydrolysis of cellulose requires the synergistic action of endoglucanase, exoglucanase, and β-glucosidase (6). In our case, celCCA cuts at random at internal amorphous sites in the cellulose polysaccharide chain, generating oligosaccharides with various lengths and consequently new chain ends. celCCE acts in a progressive manner on the reducing or nonreducing ends of cellulose polysaccharide chains, liberating either glucose or cellobiose as major products. Ccel_2454 hydrolyzes soluble cellodextrins and cellobiose into glucose. Such enzyme–enzyme synergy ensured the recombinant S. cerevisiae EBY100 could directly use cellulose. As observed in Fig. 5A, EBY (E-2), EBY (A-2), and EBY (2454-2) showed a little capacity of cellulosic ethanol production (∼314 mg/L on average), indicating that the unifunctional minicellulosomes were not quite efficient in Avicel hydrolysis. In contrast, the ethanol titer of bifunctional minicellulosome increased to 3.2-fold (∼1,004 mg/L on average). As mentioned above, the corresponding ethanol titer of EBY (EA2-2) was 1,400 mg/L; thus, it was 3.6-fold higher than that of unifunctional minicellulosomes. Moreover, both trifunctional and bifunctional minicellulosomes exhibited higher collective activity than the sum of the activities of individual unifunctional minicellulosomes, indicating that the enzyme–enzyme synergies between celCCA and celCCE, celCCA and Ccel_2454, and celCCE and Ccel_2454 surely existed.
Fig. 5.
Analysis of enzyme–enzyme synergy (A) and enzyme-proximity synergy (B). Avicel was used in A. C4doc (+) and C4doc (−) were cellulases with and without miniscaffoldin I. PASC (75.5) means the cellulose was prepared using 75.5% phosphoric acid.
The enzyme-proximity synergy was also investigated in this study. celCCA, celCCE, Ccel_2454, and miniscaffoldin I produced by Escherichia coli were applied. CMC, PASC (86.5), PASC (75.5), and Avicel were used as cellulosic substrates. As observed in Fig. 5B, complexation of celCCA, celCCE, and Ccel_2454 onto scaffoldin I induced the increase in activity. The hydrolysis ability of cellulases was increased to 1.3-fold on average. Both free cellulases and minicellulosome showed higher activity toward CMC and PASC (86.2) than PASC (75.5) and Avicel. However, the activity enhancement toward highly crystalline cellulose was more obvious [CMC, 1.21-fold; PASC (86.2), 1.30-fold; PASC (75.5), 1.31-fold; Avicel, 1.56-fold]. This is probably attributable to the different binding capacities of CBD on these celluloses.
Direct Fermentation of Microcrystalline Cellulose to Ethanol.
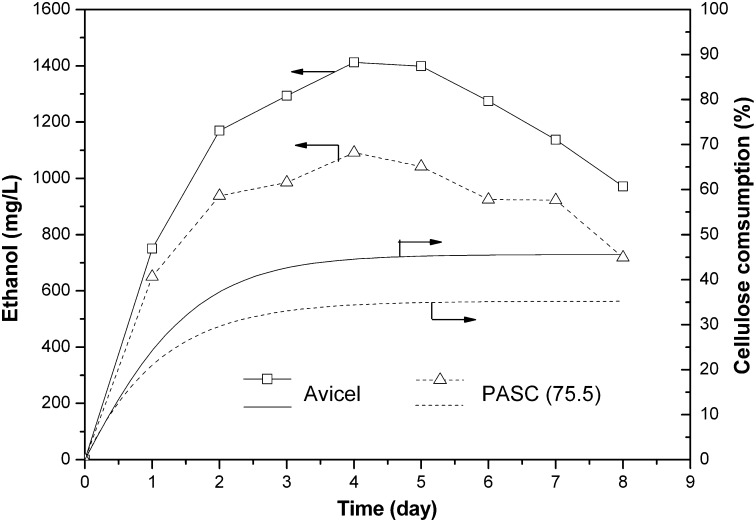
Direct ethanol fermentation from Avicel or PASC (75.5) was examined using EBY (EA2-2). As shown in Fig. 6, Avicel was better as the carbon source than PASC (75.5). Fermentation of PASC prepared by low concentration of phosphoric acid (75.5%) did not improve the ethanol production compared with PASC (86.2) (see Fig. 4A). In this study, the ethanol titer quickly increased within 4 d. The elevation in ethanol production was accompanied by a concomitant increase in cellulose consumption. The maximum bioethanol production of EBY (EA2-2) was 1,412 mg/L for Avicel and 1,091 mg/L for PASC (75.5) after 4 d. After that, ethanol concentration decreased sharply, and the titers reduced to 971 and 719 mg/L for Avicel and PASC (75.5), respectively, after 8 d. This is probably attributable to the availability of ethanol as the carbon source after cellulosome lost the activity (29). Wen et al. (18) reported a yield of 0.31 g of ethanol per gram of PASC (an ethanol titer of ∼1,800 mg/L) using another recombinant EBY100. Accordingly, the maximum cellulose consumption for Avicel and PASC (75.5) in our work should reach 45% (4.5 g/L) and 35% (3.5 g/L). Moreover, the reducing sugar concentrations during the fermentation were below the detection limit. This indicates that all of the reducing sugar was quickly consumed, resulting in no detectable reducing-sugar accumulation in the medium. The glucose in reducing sugar was directly consumed, but the cellobiose should be first converted into glucose by β-glucosidase.
Fig. 6.
Time profiles of the ethanol production from Avicel and PASC (75.5). Cellulose consumption was calculated supposing the yield was 0.31 g of ethanol gram of cellulose (21).
Discussion
Engineering S. cerevisiae as a CBP microorganism by display of minicellulosomes on the cell surface for cellulosic ethanol production has been aggressively investigated. Clear assembly mechanism and specificity between cohesin and dockerin lay the foundation for such investigation. Lilly et al. (30) successfully displayed a chimeric scaffoldin protein from C. cellulolyticum on the S. cerevisiae cell surface. Phenotypic evidence for cohesin–dockerin interaction was established with the detection of a twofold increase in tethered endoglucanase enzyme activity. Ito et al. (31) constructed a surface display system to control the ratio of Trichoderma reesei endoglucanase II and Aspergillus aculeatus β-glucosidase on S. cerevisiae. The recombinant yeast was able to hydrolyze β-glucan to glucose. To date, only two groups have successfully constructed trifunctional minicellulosome on S. cerevisiae, accomplishing the combining cellulase production, cellulose hydrolysis, and ethanol fermentation into a single step. Wen et al. (18) reported that the trifunctional minicellulosomes showed enhanced enzyme–enzyme synergy and enzyme-proximity synergy. The engineered yeast could simultaneously break down and ferment PASC to ethanol with a titer of ∼1,800 mg/L. Chen and colleagues (19) assembled minicellulosome in vitro with a yeast-displayed miniscaffoldin and E. coli–produced cellulases. Ethanol productivity reached 3.5 g/L when using PASC as the cellulose substrate. Also, Chen and colleagues reported the surface assembly of a functional minicellulosome by using a synthetic yeast consortium (20, 21). The miniscaffoldin display and cellulases secretion were accomplished by four recombinant S. cerevisiae. The optimized consortium produced 1.87 g/L ethanol from amorphous cellulose.
In these studies, the cellulose saccharification capability of the engineered S. cerevisiae with minicellulosome has been proven, and the cellulolytic activity was found higher than that of free cellulases. However, direct conversion of microcrystalline cellulose remains a challenge. Possible reasons were given previously:
i) Both Wen et al. (18) and Chen and colleagues (19–21) used a single scaffoldin for minicellulosome construction and surface anchoring. Such organization seriously limited the cellulosome productivity. As mentioned, natural microorganisms usually have multiple types of scaffoldins. Some of the scaffoldins are used for cellulosome construction, and the others are for cell surface attachment. With the increase of cohesin numbers on anchoring scaffoldin, the cellulosome display level is raised considerably.
ii) Intracellular assembly of minicellulosome challenges the efficient display of complex. The molecular mass of the natural cellulosome is >3 MDa (15), so direct display of such large protein complex is quite difficult. Displaying anchoring scaffoldins and secreting catalytic and noncatalytic units are usually two independent steps in natural microorganisms. The assembly of units is accomplished outside of the cells (11). In the work of Wen et al. (18), the catalytic and noncatalytic units were assembled inside S. cerevisiae, and then the whole complex was surface-anchored through signal peptide, indicating that the display level of minicellulosome would inevitably decrease. The data showed that their cellulosic ethanol titer was only 51% of that of Chen and colleagues (19).
iii) The cellulose hydrolysis and the ethanol fermentation were not thermally compatible. The EG and BGL in the work of Chen and colleagues (19) were cloned from C. thermocellum. Although the cellulosome of C. thermocellum has great efficiency in cellulose hydrolysis, its optimal temperature for cellulolytic activity is around 72 °C (17). At temperatures below 40 °C, the activity toward microcrystalline cellulose would be completely lost. Even for soluble cellulose (CMC), only <30% of the hydrolysis capability remained. The optimal growth temperature of S. cerevisiae is 30 °C; thus, the cellulases from C. thermocellum was not compatible with the engineered host.
Therefore, heterologous display of minicellulosomes on S. cerevisiae should follow the natural assembly mechanism and capture the relationship among cellulase, cellulosome, cellulose, and the host yeast. In our study, minicellulosomes containing EG, CHB, and BGL were successfully displayed on the cell surface of S. cerevisiae EBY100. The cellulosome construction and its attachment were accomplished by two individual miniscaffoldins, resulting in an increased display level. Cellulases were cloned from C. cellulolyticum, ensuring the thermal compatibility between cellulose hydrolysis and yeast fermentation. Except for the anchoring miniscaffoldin, all of the other cellulosomal units were first secreted by α-factor and then assembled through cohesin–dockerin interaction extracellularly. Unit secretion decreased the complex-display resistance, and the species-specific interaction ensured the cellulosomal units in order distribution. Through enzyme–enzyme synergy, enzyme-proximity synergy, and cellulose–enzyme–cell synergy, the engineered S. cerevisiae EBY100 was able to direct conversion of Avicel to bioethanol. The highest ethanol titer reached 1,412 mg/L after optimizing the anchoring miniscaffoldin length. This report describes recombinant yeasts capable of producing ethanol from microcrystalline cellulose by cell-associated minicellulosome. The research promotes the application of S. cerevisiae as CBP microorganism in cellulosic ethanol production.
Materials and Methods
Strains and Media.
E. coli Top10 was used for genetic manipulations, and E. coli BL21 (DE3) was the host for intracellular expression of cellulases and miniscaffoldin. S. cerevisiae EBY100 (Invitrogen) was used for yeast cell surface display. C. thermocellum ATCC 27405 was laboratory-stored. C. cellulolyticum DSM 5812 and the genomic DNA of C. cellulovorans DSM 3052 were purchased from DSMZ. E. coli cultures were grown in Luria–Bertani (LB) medium (1% tryptone, 0.5% yeast extract, 1% NaCl) supplemented with either 100 μg/mL ampicillin or 50 μg/mL kanamycin. S. cerevisiae EBY100 was grown in YPD medium (1% yeast extract, 2% (wt/wt) peptone, and 2% (wt/wt) glucose). S. cerevisiae EBY100 transformants were selected on -Trp or -Trp-Leu minimal dextrose plates [0.67% yeast nitrogen base with ammonium sulfate and without amino acids (YNB), 2% (wt/wt) glucose, 1.5% (wt/wt) agar, appropriate supplement of Leu]. The recombinant yeasts were precultured in SC-Trp or SC-Trp-Leu medium containing glucose [0.67% YNB, 2% (wt/wt) glucose, 0.01% (adenine, arginine, cysteine, lysine, threonine, uracil), 0.005% (aspartic acid, histidine, isoleucine, methionine, phenylalanine, proline, serine, tyrosine, valine), appropriate supplement of Leu] and were induced in SC-Trp or SC-Trp-Leu medium containing 2% (wt/wt) galactose instead of glucose. The yeast induction medium was supplemented with 10 mM CaCl2.
Plasmid Construction.
Expression cassettes of cellulases and scaffoldin I were first assembled in pUC19 and then introduced into pRS425 (laboratory-stored) or pYD1 (Invitrogen). Scaffoldin IIs were constructed in pET22b (+) (laboratory-stored) and then ligated into pYD1 under GAL1 promoter. Plasmids used for E. coli expression were constructed based on pET28a (laboratory-stored) or pETduet-1 (laboratory-stored). Information regarding the recombinant plasmids is shown in SI Text.
Yeast Surface Display and E. coli Expression.
The recombinant yeasts were precultured in SC-Trp or SC-Trp-Leu medium containing 2% glucose for 36 h at 30 °C. After washing with distilled water, the precultures were subinoculated into induction medium at an OD600 of 1.0 and grown at 20 °C for over 60 h. Protein expression in E. coli was induced with 0.2 mM Isopropyl β-D-1-thiogalactopyranoside (IPTG) at 25 °C for 8 h when cells were grown to an OD600 of 0.5. The E. coli cells harvested were resuspended in a 100 mM Tris-HCl buffer supplemented with 10 mM CaCl2 (pH 5.5) at 20:1 and then disrupted by sonication on ice. Cellular debris was removed by centrifugation for 10 min at 11,000 × g, and the supernatant was stored at −20 °C for further enzyme assays.
Immunofluorescence Microscopy and FACS.
Induced recombinant yeasts were harvested by centrifugation at 8,000 × g and washed two times with PBS. Cells were then resuspended in PBS containing 1 mg/mL BSA and 2 μg/mL mouse anti–V5-FITC antibody (Invitrogen) to an OD600 of 1.0 for 4 h at 4 °C. Before analysis, the cell–antibody complex was washed two times with PBS. Photographs were taken using an immunofluorescence microscope (OPTEC). FACS was analyzed with FACSAria II (BD).
Enzyme Assays.
The supernatants containing cellulases and miniscaffoldin were mixed in 100 mM Tris-HCl buffer with 10 mM CaCl2 (pH 5.5) and kept for 2 h at 4 °C for minicellulosome assembly. The enzymatic activity of cellulases or cellulosome against cellulosic substrates was quantified by 3, 5-dinitrosalicylic acid (DNS) assay. The substrates were Avicel as microcrystalline cellulose, PASC as amorphous cellulose prepared from Avicel as described previously (32), and CMC as soluble cellulose. Cellulases or cellulosome were incubated with 0.1% substrate in 100 mM Tris-HCl buffer with 10 mM CaCl2 (pH 5.5) for 16 h at 30 °C. After addition of DNS and boiling for 2 min, reducing sugars were quantified colorimetrically at an OD of 540 nm.
Fermentation.
After induction, yeast strain was washed twice with YP medium (1% yeast extract, 2% peptone, 10 mM CaCl2) and resuspended in YP medium supplemented with 0.001% ergosterol, 0.042% Tween 80, and 1% Avicel or PASC or CMC to an OD600 of 50. Fermentation was carried out anaerobically in a 50-mL flask at 30 °C with agitation at 250 rpm. The ethanol concentration was determined by gas chromatography (GC-2010; Shimadzu) with a flame ionization detector and a glass column (Porapak Q; 80/100 mesh; 2 m; Sigma-Aldrich).
Supplementary Material
Acknowledgments
This work was supported by National Natural Science Foundation of China Grants 21106007 and 21076017, China Postdoctoral Science Foundation Grant 20110490275, the National Basic Research Program of China (973 Program) Grants 2012CB725200, 2011CB710800, and 2009CB724703, the National High-Tech R&D Program of China (863 Program) Grants 2012AA021404 and 2012AA021402, and the Key Projects in the National Science & Technology Pillar Program during the 12th Five-year Plan Period Grant 2011BAD22B04.
Footnotes
The authors declare no conflict of interest.
This article is a PNAS Direct Submission.
This article contains supporting information online at www.pnas.org/lookup/suppl/doi:10.1073/pnas.1209856109/-/DCSupplemental.
References
- 1.Demain AL, Newcomb M, Wu JHD. Cellulase, clostridia, and ethanol. Microbiol Mol Biol Rev. 2005;69:124–154. doi: 10.1128/MMBR.69.1.124-154.2005. [DOI] [PMC free article] [PubMed] [Google Scholar]
- 2.Zhang HL, Baeyens J, Tan TW. The bubble-induced mixing in starch-to-ethanol fermenters. Chem Eng Res Des. 2012 doi: 10.1016/j.cherd.2012.05.003. [DOI] [Google Scholar]
- 3.Zhang HL, Baeyens J, Tan TW. Mixing phenomena in a large-scale fermenter of starch to bio-ethanol. Energy. 2012 doi: 10.1016/j.energy.2012.05.015. [DOI] [Google Scholar]
- 4.Himmel ME, et al. Biomass recalcitrance: Engineering plants and enzymes for biofuels production. Science. 2007;315:804–807. doi: 10.1126/science.1137016. [DOI] [PubMed] [Google Scholar]
- 5.Lynd LR, van Zyl WH, McBride JE, Laser M. Consolidated bioprocessing of cellulosic biomass: An update. Curr Opin Biotechnol. 2005;16:577–583. doi: 10.1016/j.copbio.2005.08.009. [DOI] [PubMed] [Google Scholar]
- 6.Lynd LR, Weimer PJ, van Zyl WH, Pretorius IS. Microbial cellulose utilization: Fundamentals and biotechnology. Microbiol Mol Biol Rev. 2002;66:506–577. doi: 10.1128/MMBR.66.3.506-577.2002. [DOI] [PMC free article] [PubMed] [Google Scholar]
- 7.Nevoigt E. Progress in metabolic engineering of Saccharomyces cerevisiae. Microbiol Mol Biol Rev. 2008;72:379–412. doi: 10.1128/MMBR.00025-07. [DOI] [PMC free article] [PubMed] [Google Scholar]
- 8.Alper H, Moxley J, Nevoigt E, Fink GR, Stephanopoulos G. Engineering yeast transcription machinery for improved ethanol tolerance and production. Science. 2006;314:1565–1568. doi: 10.1126/science.1131969. [DOI] [PubMed] [Google Scholar]
- 9.Elkins JG, Raman B, Keller M. Engineered microbial systems for enhanced conversion of lignocellulosic biomass. Curr Opin Biotechnol. 2010;21:657–662. doi: 10.1016/j.copbio.2010.05.008. [DOI] [PubMed] [Google Scholar]
- 10.van Zyl WH, Lynd LR, den Haan R, McBride JE. Consolidated bioprocessing for bioethanol production using Saccharomyces cerevisiae. Adv Biochem Eng Biotechnol. 2007;108:205–235. doi: 10.1007/10_2007_061. [DOI] [PubMed] [Google Scholar]
- 11.Doi RH, Kosugi A. Cellulosomes: Plant-cell-wall-degrading enzyme complexes. Nat Rev Microbiol. 2004;2:541–551. doi: 10.1038/nrmicro925. [DOI] [PubMed] [Google Scholar]
- 12.Bayer EA, Belaich JP, Shoham Y, Lamed R. The cellulosomes: Multienzyme machines for degradation of plant cell wall polysaccharides. Annu Rev Microbiol. 2004;58:521–554. doi: 10.1146/annurev.micro.57.030502.091022. [DOI] [PubMed] [Google Scholar]
- 13.Bayer EA, Morag E, Lamed R. The cellulosome—a treasure-trove for biotechnology. Trends Biotechnol. 1994;12:379–386. doi: 10.1016/0167-7799(94)90039-6. [DOI] [PubMed] [Google Scholar]
- 14.Schwarz WH. The cellulosome and cellulose degradation by anaerobic bacteria. Appl Microbiol Biotechnol. 2001;56:634–649. doi: 10.1007/s002530100710. [DOI] [PubMed] [Google Scholar]
- 15.Fontes CMGA, Gilbert HJ. Cellulosomes: Highly efficient nanomachines designed to deconstruct plant cell wall complex carbohydrates. Annu Rev Biochem. 2010;79:655–681. doi: 10.1146/annurev-biochem-091208-085603. [DOI] [PubMed] [Google Scholar]
- 16.Leibovitz E, Béguin P. A new type of cohesin domain that specifically binds the dockerin domain of the Clostridium thermocellum cellulosome-integrating protein CipA. J Bacteriol. 1996;178:3077–3084. doi: 10.1128/jb.178.11.3077-3084.1996. [DOI] [PMC free article] [PubMed] [Google Scholar]
- 17.Johnson EA, Sakajoh M, Halliwell G, Madia A, Demain AL. Saccharification of complex cellulosic substrates by the cellulase system from Clostridium thermocellum. Appl Environ Microbiol. 1982;43:1125–1132. doi: 10.1128/aem.43.5.1125-1132.1982. [DOI] [PMC free article] [PubMed] [Google Scholar]
- 18.Wen F, Sun J, Zhao H. Yeast surface display of trifunctional minicellulosomes for simultaneous saccharification and fermentation of cellulose to ethanol. Appl Environ Microbiol. 2010;76:1251–1260. doi: 10.1128/AEM.01687-09. [DOI] [PMC free article] [PubMed] [Google Scholar]
- 19.Tsai SL, Oh J, Singh S, Chen R, Chen W. Functional assembly of minicellulosomes on the Saccharomyces cerevisiae cell surface for cellulose hydrolysis and ethanol production. Appl Environ Microbiol. 2009;75:6087–6093. doi: 10.1128/AEM.01538-09. [DOI] [PMC free article] [PubMed] [Google Scholar]
- 20.Tsai SL, Goyal G, Chen W. Surface display of a functional minicellulosome by intracellular complementation using a synthetic yeast consortium and its application to cellulose hydrolysis and ethanol production. Appl Environ Microbiol. 2010;76:7514–7520. doi: 10.1128/AEM.01777-10. [DOI] [PMC free article] [PubMed] [Google Scholar]
- 21.Goyal G, Tsai SL, Madan B, DaSilva NA, Chen W. Simultaneous cell growth and ethanol production from cellulose by an engineered yeast consortium displaying a functional mini-cellulosome. Microb Cell Fact. 2011;10:89–96. doi: 10.1186/1475-2859-10-89. [DOI] [PMC free article] [PubMed] [Google Scholar]
- 22.Haimovitz R, et al. Cohesin-dockerin microarray: Diverse specificities between two complementary families of interacting protein modules. Proteomics. 2008;8:968–979. doi: 10.1002/pmic.200700486. [DOI] [PubMed] [Google Scholar]
- 23.Fan LH, Liu N, Yu MR, Yang ST, Chen HL. Cell surface display of carbonic anhydrase on Escherichia coli using ice nucleation protein for CO2 sequestration. Biotechnol Bioeng. 2011;108:2853–2864. doi: 10.1002/bit.23251. [DOI] [PubMed] [Google Scholar]
- 24.Hall M, Bansal P, Lee JH, Realff MJ, Bommarius AS. Cellulose crystallinity—a key predictor of the enzymatic hydrolysis rate. FEBS J. 2010;277:1571–1582. doi: 10.1111/j.1742-4658.2010.07585.x. [DOI] [PubMed] [Google Scholar]
- 25.Gaudin C, Belaich A, Champ S, Belaich JP. CelE, a multidomain cellulase from Clostridium cellulolyticum: A key enzyme in the cellulosome? J Bacteriol. 2000;182:1910–1915. doi: 10.1128/jb.182.7.1910-1915.2000. [DOI] [PMC free article] [PubMed] [Google Scholar]
- 26.Adams JJ, Pal G, Jia Z, Smith SP. Mechanism of bacterial cell-surface attachment revealed by the structure of cellulosomal type II cohesin-dockerin complex. Proc Natl Acad Sci USA. 2006;103:305–310. doi: 10.1073/pnas.0507109103. [DOI] [PMC free article] [PubMed] [Google Scholar]
- 27.Goldstein MA, et al. Characterization of the cellulose-binding domain of the Clostridium cellulovorans cellulose-binding protein A. J Bacteriol. 1993;175:5762–5768. doi: 10.1128/jb.175.18.5762-5768.1993. [DOI] [PMC free article] [PubMed] [Google Scholar]
- 28.Weimer PJ, Lopez-Guisa JM, French AD. Effect of cellulose fine structure on kinetics of its digestion by mixed ruminal microorganisms in vitro. Appl Environ Microbiol. 1990;56:2421–2429. doi: 10.1128/aem.56.8.2421-2429.1990. [DOI] [PMC free article] [PubMed] [Google Scholar]
- 29.Li J, et al. Green fluorescent protein in Saccharomyces cerevisiae: Real-time studies of the GAL1 promoter. Biotechnol Bioeng. 2000;70:187–196. doi: 10.1002/1097-0290(20001020)70:2<187::aid-bit8>3.0.co;2-h. [DOI] [PubMed] [Google Scholar]
- 30.Lilly M, Fierobe HP, van Zyl WH, Volschenk H. Heterologous expression of a Clostridium minicellulosome in Saccharomyces cerevisiae. FEMS Yeast Res. 2009;9:1236–1249. doi: 10.1111/j.1567-1364.2009.00564.x. [DOI] [PubMed] [Google Scholar]
- 31.Ito J, et al. Regulation of the display ratio of enzymes on the Saccharomyces cerevisiae cell surface by the immunoglobulin G and cellulosomal enzyme binding domains. Appl Environ Microbiol. 2009;75:4149–4154. doi: 10.1128/AEM.00318-09. [DOI] [PMC free article] [PubMed] [Google Scholar]
- 32.Zhang YHP, Cui J, Lynd LR, Kuang LR. A transition from cellulose swelling to cellulose dissolution by o-phosphoric acid: Evidence from enzymatic hydrolysis and supramolecular structure. Biomacromolecules. 2006;7:644–648. doi: 10.1021/bm050799c. [DOI] [PubMed] [Google Scholar]
Associated Data
This section collects any data citations, data availability statements, or supplementary materials included in this article.


