

Abstract
Messenger RNA levels in eukaryotes are controlled by multiple consecutive regulatory processes, which can be classified into two layers: primary transcriptional regulation at the chromosomal level and secondary, co- and post-transcriptional regulation of the mRNA. To identify the individual contribution of these layers to steady-state RNA levels requires separate quantification. Using mouse as a model organism, we show that chromatin features are sufficient to model RNA levels but with different sensitivities in dividing versus postmitotic cells. In both cases, chromatin-derived transcription rates explain over 80% of the observed variance in measured RNA levels. Further inclusion of measurements of mRNA half-life and microRNA expression data enabled the identification of a low quantitative contribution of RNA decay by either microRNA or general differential turnover to final mRNA levels. Together, this establishes a chromatin-based quantitative model for the contribution of transcriptional and post-transcriptional processes to steady-state levels of messenger RNA.
Keywords: chromatin, histone modifications, microRNA, RNA decay, transcriptional regulation
Introduction
Regulation of mRNA levels is a key mechanism that defines cell identity. Cellular homeostasis requires stable gene expression patterns, while differentiation events in metazoan development or responses to external stimuli involve resetting of the transcriptional program. During the lifespan of an mRNA from transcription over maturation, export, translation, and decay, its activity and abundance is controlled by various mechanisms: histone modifications and DNA methylation determine the epigenetic state of the chromatin environment of a gene depending on the DNA accessibility the transcription machinery can bind and initiate transcription and thereby produce primary transcript at different rates (Segal and Widom, 2009; Bell et al, 2010). This is modulated co-transcriptionally by splicing and poly-adenylation (Millevoi and Vagner, 2010; Nilsen and Graveley, 2010; Di Giammartino et al, 2011) and further regulated at the level of nuclear export. Once the mRNA is in the cytoplasm it is subject to further post-transcriptional processing, which can reduce the transcript level in a targeted manner. Two major post-transcriptional regulatory processes influencing the amount of mRNA molecules available for translation are general RNA decay and microRNA-mediated RNA interference.
Single-gene experiments have provided examples of the involved regulatory mechanisms that include transcription factor binding but also what is currently referred to as epigenetic regulation. These summarize chromatin regulation of DNA accessibility through active or repressive histone modifications (Kouzarides, 2007) or nucleosomal positioning (Kornberg and Lorch, 1999; Wyrick et al, 1999), transcriptional repression by DNA methylation of gene promoters (Bird, 2002; Eckhardt et al, 2006; Weber et al, 2007) and post-transcriptional regulation of RNA decay rates by non-coding small RNAs (Ambros, 2004). Additionally, genome-wide studies successfully approximated mRNA levels with information of transcription factor binding and histone modification patterns at promoter proximal sequences (Ouyang et al, 2009; Karlic et al, 2010; Cheng and Gerstein, 2011).
mRNA abundance, however, may be determined to different degrees by transcriptional and post-transcriptional events and the contribution of these layers may vary depending on how stable or how fast the expression change needs to be. At a quantitative level, there is only a limited understanding of the individual contributions of these regulatory layers. To understand these relationships, we abstract the many layers into two processes: primary regulation of synthesis or transcription on the level of chromatin and secondary, post-transcriptional degradation of mRNA. We assume that the change of mRNA level (dR/dt) depends linearly on mRNA synthesis and degradation,
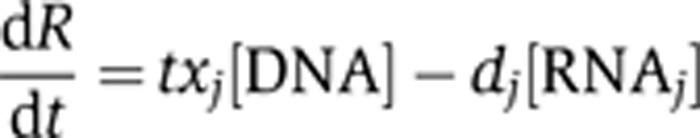 |
where [RNAj] is the RNA concentration for gene j, [DNA] is constant ([DNA]=1), txj is the transcription rate, and dj is the degradation rate of gene j. For simplification, we initially assume the degradation rate to be constant, meaning independent of gene j. Therefore in steady state where dR/dt=0, the RNA concentration of gene j is proportional to transcription and degradation rates of gene j. Subsequently when we investigate the contribution of post-transcriptional regulation, we allow dj to depend on gene j (see Supplementary information section 1 for details). Consequently, we can estimate the individual contribution of transcription and mRNA degradation, or mRNA decay, by correlating them with mRNA levels, respectively.
Here, we explore quantitatively how a prediction of transcription based on chromatin characteristics relates to mRNA levels and how such an approach can quantify changes in mRNA abundance that occur during the course of cellular differentiation. We ask if pluripotent and differentiated cells differ in their regulatory behaviors, potentially relating to differences in cell cycle and the ability to set and propagate epigenetic marks or a different usage of post-transcriptional processes. As a biological model, we use mouse stem cells that we differentiate into a highly pure neuronal population through a defined progenitor state (Bibel et al, 2007). We focus our analysis on pluripotent embryonic stem (ES) cells and postmitotic glutamatergic neurons (TN). To quantitate the contribution of different regulatory processes to observed mRNA levels, we created a linear model for each cell type based on various measures from transcriptional and post-transcriptional layers. In these models, a measure that is a strong correlate of transcription is expected to be highly predictive of mRNA levels. We found that genome-wide measures of histone modifications and polymerase occupancy alone—measures which stand for the transcriptional layer of regulation—allowed accurate prediction of mRNA levels and explained most of the observed experimental variation in steady-state mRNA levels. In addition, we measured transcript half-life and microRNA abundance in these cells, representing the post-transcriptional layer of regulation, and identified only a minor contribution to the determination of mRNA levels.
Results
Histone marks are predictive of transcription rate
To separately quantify transcriptional and post-transcriptional processes on a genome-wide level, we estimated transcription rates for individual genes. Transcription rate is a function of multiple factors: transcription factors bind influenced by the chromatin environment and concordantly determine the rate of transcription. We use chromatin correlates of transcription as readout, which can be measured genome-wide in a robust way by chromatin immunoprecipitation (ChIP) followed by deep sequencing (ChIP-seq). We created genome-wide maps for RNA polymerase II (Pol-II) and tri-methylation of lysines 4, 27 (Lienert et al, 2011; Tiwari et al, 2012) and 36 in histone H3 (H3K4me2, H3K27me3 and H3K36me3) in both dividing and postmitotic cells (see Materials and methods for details) and investigated the distribution of sequence reads along the gene body in reference to gene activity defined by mRNA abundance of representative transcripts (see Supplementary information section 2 for details).
Figure 1A summarizes average distributions of these marks for non-overlapping genes: Pol-II, H3K4me2 and H3K27me3 are located around the promoter of the gene (Boyer et al, 2006; Guenther et al, 2007; Mohn et al, 2008; Rahl et al, 2010; Young et al, 2011), while H3K36me3 is distributed over the gene body (Pokholok et al, 2005; Barski et al, 2007; Bell et al, 2007; Mikkelsen et al, 2007), steadily increasing within the first 2 kb downstream of the transcription start site (TSS).
Figure 1.

Using histone marks and RNA polymerase II to model mRNA levels. (A) Metagene plot showing the distribution of histone marks along the gene body of genes aligned at their TSS with low, intermediate, and high expression levels. (B) Scatter plot of RNA polymerase II (Pol-II, green) and three histone marks H3K36me3 (dark blue), H3K4me2 (light blue), H3K27me3 (orange) versus mRNA levels on the vertical axis. The number of reads aligned to either gene body (H3K36me3, mRNA) or at the TSS (H3K4me2, H3K27me3, Pol-II) is shown in logarithmic scale. (C) Predicted transcription rate combining the four measures in a linear model versus mRNA level. Axes as in (B). (D) Bar plot showing the fraction of total variance in mRNA levels that is explained by each single histone mark, Pol-II occupancy or a linear combination of them (dark gray). The maximally explainable variance (light gray) is limited by the amount of measurement noise (see Supplementary information section 4 for details). Error bars indicate 95% confidence interval.
Based on these observations, which are in accordance with previously published models (Vakoc et al, 2006; Bell et al, 2007; Edmunds et al, 2008; Hon et al, 2009), we selected the regions to quantify these marks for individual genes. While most of the histone marks have a functional impact close to the TSS, the abundance of H3K36me3 throughout the gene body is notably by far the most informative measure for transcription (Figure 1B and D; Supplementary information section 3 for details), as could be expected from its mechanistic link to transcription: H3K36me3 chromatin mark is set by a complex that associates with the active elongating RNA polymerase II (Li et al, 2002, 2003; Strahl et al, 2002; Krogan et al, 2003; Xiao et al, 2003; Joshi and Struhl, 2005; Keogh et al, 2005; Kizer et al, 2005; Pokholok et al, 2005; Sun, 2005; Yuan et al, 2009).
Using these marks as regressors (Figure 1B) we infer a linear model, where mRNA measured by deep sequencing is the response variable (combining poly-A RNA and ribosomal-depleted RNA sequencing, for details see Materials and methods) (Figure 1C). The coefficients assigned to each of the regressors by the linear model reflect their function as active or repressive histone mark (sign of the coefficients) and their contribution to explaining transcription (absolute value of the coefficients). The correlation (controlled by a two-fold cross-validation) between observed and predicted mRNA abundance is 0.92. This means that 84.6% of the observed differences in mRNA levels (variance) can be explained by this model (Figure 1D, black bar)—exclusively based on measures from the transcriptional layer.
The remaining 15.4% unexplained variance is a sum of post-transcriptional effects as well as measurement noise. While post-transcriptional effects could be explained by a more sophisticated model that includes additional experimental data from the post-transcriptional layer (see below), the technical and biological measurement noise cannot be predicted and thus defines an upper limit of prediction accuracy. We went on to partition this sum, by (i) estimating the noise, and thereby the maximum variance that can be explained by our regressors and (ii) assigning relative contributions of two major post-transcriptional processes—microRNA-mediated degradation and RNA decay—to final mRNA levels.
Estimating the upper bound of explained variance in RNA levels
Fluctuations in biological systems limit the explainable variance of mRNA through the variability between biological replicates. To determine how much of the remaining unexplained variance is due to such biological variability and measurement noise versus actual post- or co-transcriptional processes, we estimated the maximum variance to be explained given the variability in the data. In the linear model noise originates from both measurements of mRNA levels and measurements of chromatin marks. Since we use multiple regressor measurements that each have independent noise, their individual noise adds up, which in turn sets the limits of explainable variance. To estimate its upper bound, we follow the theory of noise propagation to calculate model noise based on replicates of RNA-seq and ChIP-seq experiments (see Supplementary information section 4 for details). This approach sets the maximal explainable variance in mRNA levels to 91% (Figure 1D, light-gray bar). The variance in RNA levels, which remains to be explained, is therefore the difference between this maximal to be explained variance and the variance that is already explained by the linear model using transcriptional information. In the case of ESC, this difference is 6.4%.
The effect of degradation on steady-state mRNA level
Having estimated transcription rate and an upper bound for explainable variance, we next explored the remaining 6.4% unexplained variance. We assumed that genes with lower measured RNA level than predicted by the transcription measures are degraded more rapidly than average due to post-transcriptional downregulation of their transcript. To test this hypothesis, we inferred the RNA decay rates of genes by measuring their abundance in a time course after inhibition of transcription with actinomycin D (see Materials and methods and Supplementary information section 5 for details). Transcript abundance was determined in replicates at 0, 1, 2, 4, and 8 h after inhibition of transcription, but not later in order to reduce secondary effects due to long chemical treatment. From the degradation slope, we calculate the RNA half-life according to Sharova et al (2009), summarized in Figure 2A and B. The high correlation between biological replicates allowed us to extrapolate half-life times up to 20 h and thus to include genes with slower decay rates. In accordance with a previous study in mouse ES cells (Sharova et al, 2009) we observe a mean half-life of around 8 h with a distribution tailed toward longer half-lives (Figure 2B). The extremely short-lived RNAs mostly belong to the class of non-polyadenylated genes, which are not protected from degradation (Supplementary information section 5; Supplementary Figure 7). These genes are expected to show lower mRNA levels compared with other genes with the same predicted transcription rate. Indeed, short-lived RNAs are deviating negatively from the linear fit. This is particularly visible in the shift in the boxplots in Figure 2C in the 40–100% transcription bins, while there are hardly short-lived genes in the low-transcribed bins (Supplementary information section 5; Supplementary Figure 8). The degree to which the half-life explains additional variance in mRNA levels can be quantified by the correlation of the half-life with the residual of the linear fit. This correlation is 0.3; meaning of the 15.4% unexplained variance of mRNA levels in the transcriptional model, mRNA half-life explains 0.32=9% (Supplementary information section 5; Supplementary Figure 9). As an alternative we can simply include the half-life as an additional feature in the linear model and infer the correlation with the measured mRNA levels again. Indeed, the explained variance increases from 84.6 to 86%.
Figure 2.

Effect of RNA half-life on mRNA levels. (A) Example genes (short-lived histone gene Hist1h2bb (orange) and the stable gene Adck5 (purple)) illustrating the inference of mRNA half-lives from expression data. Data points correspond to measured mRNA abundance at various time points after inhibition of transcription (time zero). (B) Half-life distribution of RefSeq genes with estimated mRNA decay rates. Half-lives of very stable genes were set to 21 h (the maximal inferable half-life given the experimental set-up) (see Supplementary information section 5 for details). (C) Genes are classified into five equal groups according to predicted transcription rate (0–100%), and within each group measured mRNA levels are shown as boxplots separately for genes with different mRNA half-life (color coded). Within a transcription group with a sufficient number of genes, short-lived genes show less measurable mRNA than long-lived genes. In the two low transcription bins (0–40%), mRNA levels are less well modeled and they are depleted of short-lived mRNAs (see Supplementary Figure 7 for illustration).
To test if this result is independent from the experimental approach to measure half-life, we next employed metabolic labeling of mRNA (Dölken et al, 2008; Rabani et al, 2011; Schwanhäusser et al, 2011). After a short pulse of a modified ribonucleotide newly synthesized and pre-existing mRNA fractions are separated to determine their differential abundance in order to estimate a decay rate. This method has the advantage of not interfering with the transcriptional program, as does actinomycin D, and thus is less likely to cause indirect effects (Dölken et al, 2008). On the other hand, it includes several experimental steps such as chemical treatment and affinity purification of RNA and so far has only been used as a single time point measure rather than a time-course series.
Using the metabolic labeling approach, we obtained a highly similar additional contribution of mRNA half-life to overall mRNA levels (total explained variance 85.9%; see Supplementary information section 6 for details). Notably, the variance in mRNA levels explained by transcript half-life measures alone is between 11 and 12%, for thioU and actinomycin D derived half-lives, respectively. Assuming that both measures are not completely dominated by noise we can interpret these values as a theoretical upper bound for the relative contribution of transcript half-life to mRNA levels. This further supports the observation of a minor contribution of mRNA half-life to steady-state levels inferred by different methods.
The effect of microRNAs on steady-state mRNA level
Next, we investigated whether we can attribute part of the observed mRNA half-life to the activity of microRNAs that target selected messages for degradation. To define the percentage of variance in mRNA level that can be explained by microRNA mediated degradation requires the identification of mRNAs that are regulatory targets of microRNAs. This can be attempted by identifying mRNAs bound to proteins involved in the RNAi pathway (such as Ago-IP; Beitzinger et al, 2007; Landthaler et al, 2008; Chi et al, 2009; Hafner et al, 2010) or by calculating the enrichment for motifs complementary to the microRNA within 3′-untranslated regions (UTRs) of mRNAs (van Dongen et al, 2008) or by predicting targets using a combination of sequence, structure, and conservation of the microRNA and its target mRNA site (Enright et al, 2003; Lewis et al, 2003; Rehmsmeier et al, 2004; Krek et al, 2005; Gaidatzis et al, 2007). These methods share a high false-positive rate since actual targets are not only defined by sequence complementarity alone, but by additional sequence and structural constraints and other modulating factors that are currently only poorly understood.
To circumvent these potential limitations, we initially based our definition of microRNA-targets on mRNAs that increase in expression in ES cells that lack microRNAs due to a genetic deletion of the gene encoding Dicer (Hutvágner et al, 2001; Murchison et al, 2005). An increased mRNA abundance in Dicer−/− cells suggests that these transcripts had been under negative control by microRNAs in wild-type ES cells (Figure 3A and B). Consequently, we correlate fold-changes in mRNA abundance between Dicer+/− and Dicer−/− cells with the deviation from the model in the linear fit (also referred to as ‘residual of the linear fit’). This did not reveal a relationship between negative residuals indicative for post-transcriptional regulation and the likelihood of an mRNA being a microRNA target (correlation between fold-change upon Dicer KO and residual is r=0.01; Figure 3C; Supplementary information section 7).
Figure 3.

Effect of targeting by microRNAs on mRNA levels. (A) Scatter plot of Dicer+/− versus Dicer−/− ES cells inferred by microarray measurement (Sinkkonen et al, 2008). Genes with increased mRNA levels in Dicer−/− are enriched for putative microRNA targets (orange), while genes with decreased mRNA levels are possibly affected by secondary effects (purple). (B) Distribution of the log fold-change (logFC) between Dicer−/− and Dicer+/−. (C) Genes are classified into five equal groups according to predicted transcription rate (0–100%), and within each group measured mRNA levels are shown as boxplots separately for genes with different log fold-change between Dicer−/− and Dicer+/− (color coded). Within the same transcription group, putative microRNA target genes (orange) show insignificantly different mRNA levels as non-target genes (P-value=0.303).
Importantly, however, it has been shown that expression changes of mRNAs upon removal of all microRNAs in Dicer−/− cells are relatively small in general (∼2-fold; Babiarz et al, 2008). It is thus conceivable that such small effects are not detectable in the population of all mRNAs that consist of targets and non-targets, changing their expression both, through direct effects caused by the lack of microRNAs and indirect effects unrelated to microRNAs. To test this hypothesis, we directly compared high-confidence targets (based on fold-change in abundance) with non-targets (Figure 4A and B). We stepwise increase the cutoff applied to the change in mRNA levels upon Dicer KO to define microRNA targets, thereby selecting a smaller and smaller subgroup and inferred for each of these subgroups the correlation of residual and fold-change (Figure 4C). In these groups of higher confidence microRNA-targets, we can detect a negative correlation with the residual (Figure 4C, dotted line; Supplementary information section 7; Supplementary Figure 14). We thus conclude that genes that are likely microRNA targets have indeed less detectable transcript than expected based on their predicted transcription rate. However, this effect has only a minor impact at the genome-wide scale.
Figure 4.

Focus on high-confidence microRNA target genes. (A) Same plot as in Figure 1C. All RefSeq genes are classified into three color-coded groups according to upregulated in Dicer−/− (orange), downregulated in Dicer−/− (purple), and unchanged (gray). (B) Subset of all the genes in (A), where the absolute log fold-change (logFC) between Dicer−/− and Dicer+/− is >0.5. This subset contains likely targets and non-targets. (C) Pearson correlation (r) between the residual of the linear model and the logFC between Dicer−/− and Dicer+/− (see Supplementary information section 7 for details) as a function of cutoff in absolute logFC between Dicer−/− and Dicer+/−. A logFC cutoff of zero corresponds to (A), and a cutoff of 0.5 (solid vertical line) corresponds to (B). Correlations are shown for subsets of genes for logFC cutoffs incremented in 0.1 intervals. The point size illustrates the number of genes at each cutoff. At 0.8, the subset contains 1000 genes (dashed line), the subset at 1.9 contains 100 genes (dotted line). Increasing logFC cutoffs select higher confidence microRNA-target genes that can explain the residual of the linear fit increasingly better.
To exclude that this observation is a consequence of our definition of microRNA targets in Dicer−/− cells, we additionally employed an in-silico target prediction method (Gaidatzis et al, 2007), which assigns for each possible microRNA-target site interaction a posterior probability reflecting the likelihood that this interaction occurs. We weight the posterior probability of every interaction with the abundance of the respective microRNA, inferred by small RNA sequencing. For every gene, all interaction sites are summed up and result in an ‘iMir’ score, reflecting the cumulative likelihood of a transcript to be down-regulated by microRNAs (see Supplementary information section 8 for details). Similarly to the results based on the experimental microRNA-target definition, we only observed a small effect on mRNA levels among a subset of high-confidence targets
Transcriptional and post-transcriptional regulation in dividing versus postmitotic cells
Having established that chromatin and bound polymerase are highly predictive of mRNA levels in rapidly dividing stem cells, we next asked if the same trend is observed in postmitotic neurons that have exited the cell cycle. Consequently we differentiated stem cells first into neuronal progenitors (NPs), which show reduced proliferation and further into terminal neurons, which do not divide. Similarly to the analysis in ES, we determined globally the abundance of mRNA, microRNA, Pol-II and of several histone marks and rebuild the linear model. This revealed that at all three stages chromatin data are comparably predictive for mRNA levels (Figure 5A).
Figure 5.

H3K36me3 explains most of the variance in mRNA level. (A) Scatter plot of predicted transcription rate versus measured mRNA level for the ES, NP, and TN. (B) Distribution of mRNA levels in ES, categorized into low and high expression groups. (C) Correlation (r) between H3K36me3 and mRNA for genes in expression groups from (B) in ES, NP, and TN. The correlation of H3K36me3 with mRNA level differs between dividing cells and postmitotic TN cells: In diving cells (ES and NP), it is best for high expressed genes, while in the postmitotic TN, it is best for low expressed genes. Error bars indicate 95% confidence interval.
To compare post-transcriptional contribution between cell-types, we also derived mRNA half-life data sets at the TN stage. Including mRNA half-life in TN as regressor in the linear model increased explained variance (r2) of mRNA in TN about 1%, from 79 to 80%, revealing an equally low contribution of mRNA degradation in neurons as the one observed in dividing stem cells. Together, this suggests that there is no general change in regulatory contributions once stem cells have exited the cell cycle and, in this particular case, gain neuronal functions.
Having defined the relation between chromatin measures, RNA decay and mRNA abundance at individual cell states, we next asked whether changes in transcription or changes in degradation between cell states are equally predictive for changes in mRNA levels. We fitted the linear model using the differences in measurements between two cell types, which reveal that changes in chromatin can indeed predict 67% of the change in mRNA levels. Similarly, changes in transcript half-life can explain 0.4% of the remaining variance (see Supplementary information section 9 for details). This illustrates that the experimental measurements in combination with the applied analytical approach enable quantification of the relative contributions of transcription and degradation to changes in mRNA levels.
Influence of cell division on the information content of transcription-coupled chromatin marks
H3K36me3 is set by a histone methyltransferase that interacts specifically with the elongating RNA polymerase II (Li et al, 2002, 2003; Strahl et al, 2002; Krogan et al, 2003; Xiao et al, 2003; Joshi and Struhl, 2005; Keogh et al, 2005; Kizer et al, 2005; Pokholok et al, 2005; Yuan et al, 2009). As a consequence, H3K36me3 accumulates with repeated rounds of transcription explaining why this mark can not only predict sites but also rate of transcription (Pokholok et al, 2005; Barski et al, 2007; Bell et al, 2007; Mikkelsen et al, 2007; Edmunds et al, 2008; Buratowski and Kim, 2010; Wagner and Carpenter, 2012). In dividing cells, new nucleosomes that are not H3K36 tri-methylated are deposited during genome replication. This is expected to dilute the prevalence of H3K36 methylation while this modification should further accumulate in non-dividing cells. In turn, rate of cell division might influence the ability to predict mRNA levels from this modification. A potential accumulation of H3K36me3 in non-dividing cells could lead to higher sensitivity to predict transcription at weakly expressed genes and, in case all available residues are modified, to saturation and reduced predictive power at highly expressed genes. To test the hypothesis of different H3K36me3 signal in dividing versus non-dividing cells, we group genes according to their mRNA abundance into low and high expressed and correlate their mRNA levels with the abundance of the transcription coupled mark H3K36me3 along the gene body (Figure 5B and C). In the dividing cell types ES and NP, this mark shows highest predictive power for highly expressed and reduced sensitivity for lowly expressed genes. However, in postmitotic neurons there is a clear shift: in these cells, predictability is now highest for low expressed genes in comparison with highly expressed genes.
This is fully compatible with a model whereby chromatin modifications such as H3K36me3 integrate transcriptional activity over time and that the resulting signal is diluted with every cell division. In turn, the sensitivity range changes in non-dividing cells, where signal for H3K36me3 accumulates above detection threshold for lowly expressed genes but also saturates for highly expressed genes.
Regulatory differences between tissue-specific and housekeeping genes
Genes can be classified according to their expression characteristics between cell types and tissues. Figure 6A shows a histogram of the number of tissues with detectable mRNA abundance (log2 intensity>7) for the same set of genes studied in 72 tissues and cell types profiled in the SymAtlas project (Su et al, 2004). This reveals a clear bimodal distribution where genes show either widespread activity (expressed in most samples, also referred to as ‘housekeeping’ genes) or selective activity in only up to five samples (also referred to as ‘tissue-specific’).
Figure 6.

Post-transcriptional regulation in tissue-specific and ubiquitously expressed genes. (A) Histogram of the number of cell or tissue types with detectable expression of the analyzed genes. Genes are grouped in tissue-specific (expressed in 1–5 tissues, purple), intermediate (gray), and ubiquitously expressed (expressed in 70 or more tissues, green). (B) Genes are classified into five equal groups according to predicted transcription rate (0–100%), and within each group measured mRNA levels are shown as boxplots separately for genes with different tissue expression (as in (A), color coded). At a given level of transcription, tissue-specific genes have on average less measured mRNA than ubiquitously expressed genes, suggesting that the degree of post-transcriptional regulation is higher in tissue-specific genes.
This global behavior is also evident in the stem cell to neuron differentiation that we study here, where genes with widespread activity according to SymAtlas are enriched for genes that are expressed in both cell types, while tissue-specific genes tend to be expressed in either one or none of the two studied cell types (P-value<2.2e−16, see Supplementary information section 10 for details). Importantly, previous studies already noted that these two classes of genes differ in their regulation: housekeeping genes are mostly under the control of CpG rich promoters, while tissue-specific genes show a high frequency of CpG poor promoters (Zhu et al, 2008; Mohn and Schübeler, 2009). These two classes of genes are differentially occupied by histone modifications (She et al, 2009), show different exon density (Eisenberg and Levanon, 2003; Vinogradov, 2004) and differ in 3′UTR length and sequence composition making them unequal targets for microRNAs (Stark et al, 2005).
To ask if these classes of genes also differ in the relative regulatory contribution of transcriptional and post-transcriptional layers, we compared the predictability of mRNA levels for tissue-specific and housekeeping genes using an identical linear model approach as described above. In this model, tissue-specific genes show more negative deviation from the fit, corresponding to observed mRNA levels being lower than predicted based on the transcriptional features (Figure 6B). We conclude that tissue-specific genes are more prominently controlled by post-transcriptional regulation than housekeeping genes.
Discussion
In our study, we tried to quantify the relative contribution of transcriptional and post-transcriptional regulation to mRNA levels. We show that tri-methylation of lysine 36 of histone H3, a chromatin modification that is set co-transcriptionally, provides a quantitative measure of the process of RNA synthesis. We built a linear model that combines H3K36 tri-methylation with other histone marks and Pol-II occupancy to predict transcription and to relate it to mRNA levels. This reveals a high correlation between predicted transcription based on chromatin and actual mRNA abundance in both dividing pluripotent cells and terminally differentiated neurons, suggesting that transcription and mRNA levels are tightly linked at different cellular stages. These findings are consistent with two recent studies comparing direct measures of transcription with mRNA abundance (Rabani et al, 2011; Schwanhäusser et al, 2011). Furthermore, we investigated the predictive power of histone marks towards changes in mRNA levels between the two cell types and find similarly that transcription is also the main determinant when looking at genes that change their mRNA levels. Following the determination of transcriptional contribution, we investigated the contribution of different post-transcriptional processes by extending the model to include information on microRNA targeting and transcript half-life. The effect of transcript half-life is indeed detectable on a genome-wide scale explaining minor additional variance of mRNA levels. Notably, however, we can also detect this minor contribution when we look at the predictive power of half-life toward changes in mRNA levels from ES to TN. Reliable reproduction of the effect of degradation for changes in mRNA levels suggests that the method to measure half-life is sensitive. Moreover, this supports that degradation indeed has a small but measurable role in determining mRNA levels and changes.
Targeted degradation of mRNA by the action of microRNAs affects actual half-lives of mRNAs (Guo et al, 2010). Importantly, however, we could not detect the actual effect of microRNA at a genome-wide scale, but only in a subset of high-confidence microRNA targets. This precludes correct quantification of the contribution of microRNA regulation to total mRNA decay. However, when focusing only on those genes that are highly upregulated in cells that lack Dicer we observe that microRNAs can explain about 2.25% of the residual variance. Extrapolating this contribution to all genes as a fraction of the total measured mRNA decay effect, we can estimate that microRNAs contribute between 2.5 and 25% to the total mRNA decay. This effect is compatible with the notion that microRNAs generally cause small changes in mRNA abundance (Babiarz et al, 2008; Sinkkonen et al, 2008). At the same time, we foresee that the inherent complexity in correctly predicting microRNA targets leads to an underestimation of the actual effect.
The relatively low contribution of post-transcriptional regulation on the mRNA levels and changes shows that that the lion’s share of regulatory contribution is at the level of mRNA synthesis and predictable from chromatin alone. It is important to note that the identified quantitative contribution (the fraction of explained variance), while important for understanding the regulatory principles, does not translate to functional relevance and thus should not be taken as a measure for biological importance. For example, the Dicer−/− cells used here to identify microRNA targets lack the ability to differentiate into neurons. The low quantitative contribution of post-transcriptional processes is however compatible with the model that these mostly function in fine-tuning mRNA levels rather than functioning as on-off switches (Mukherji et al, 2011).
Our study shows that chromatin is highly predictive of transcriptional output, in particular methylation of lysine 36 of H3, a mark that is set throughout the gene body and depending on the elongating polymerase. Most other histone marks that are involved in transcription occur primarily at promoters and, such as K4 methylation of CpG islands, can even occur at a subclass of promoters without activity of the linked gene, which in turn limits their predictive power (Weber et al, 2007). Interestingly, H3K36me3 is a far better predictor than RNA polymerase itself. We believe that this reflects the fact that the histone mark is stable once it is set, while the polymerase rapidly elongates and thus is only present at the gene at low frequency. While it is inherently difficult to directly compare the performance of H3K36me3 with direct labeling approaches for ongoing transcription we note that the correlation between H3K36me3 and steady-state mRNA levels is higher at all three cell states than at recent reports using alternative approaches like GRO-seq (r2=0.62; Min et al, 2011).
One likely explanation for the high predictive power of H3K36me3 is that it increases with every round of transcription, which in turn means that it can eventually saturate, when all possible lysines are methylated. In dividing stem cells such saturation is not observed, likely due to the ‘dilution’ of modified histones that occurs at every S-phase during genome duplication in addition to the general turnover of nucleosomes (Wirbelauer et al, 2005; Deal et al, 2010). In postmitotic cells, however, we indeed observe such saturation at highly expressed genes. At the same time, the accumulation of signal increases the sensitivity for the detection of weakly expressed genes, which in the linear model compensates for the reduced predictability at highly expressed genes.
Materials and methods
Cell culture
Wild-type ES cells (129Sv-C57Bl/6) were cultured and differentiated as previously described (Bibel et al, 2007; Mohn et al, 2008).
Chromatin immunoprecipitation
Cells were crosslinked in medium containing 1% formaldehyde for 10 min at room temperature. ChIP experiments were performed as described before (Mohn et al, 2008), starting with 70 μg of chromatin and 5 μg of the following antibodies: anti-dimethyl-H3K4 (Upstate, no. 07-030 (Lienert et al, 2011; Tiwari et al, 2012), anti-trimethyl-H3K36 (Abcam ab9050), anti-trimethyl-H3K27 (Upstate, no. 07-449) (Lienert et al, 2011; Tiwari et al, 2012) anti-RNA-polymerase-II (Santa Cruz Biotechnology, no. SC899) (Lienert et al, 2011; Tiwari et al, 2012). Chromatin was sonicated for 10 cycles of 30 s using a Diagenode Bioruptor. Precipitated DNA was subjected to next generation sequencing.
Next generation sequencing
In all, 5–10 ng of precipitated DNA was prepared for Solexa Sequencing as described (Mikkelsen et al, 2007). Briefly, ChIP DNA was ligated to adapters and ligation products of about 250 bp were gel purified on 1.5% agarose to remove unligated adaptors. DNA was amplified by 18 PCR cycles. DNA sequencing was carried out using the Illumina/Solexa Genome Analyzer II (GA2) sequencing system. In addition, two lanes of non-enriched chromatin from ES cells were sequenced and pooled to serve as an input/background to calculate the enrichment of reads obtained from ChIP-seq experiments.
The raw .srf and .wig files are accessible at GEO GSE33252.
Genomic coordinates
The July 2007 M. musculus genome assembly (NCBI37/mm9) provided by NCBI (http://www.ncbi.nlm.nih.gov/genome/guide/mouse/) and the Mouse Genome Sequencing Consortium (http://www.sanger.ac.uk/Projects/M_musculus/) was used as a basis for all analyses. Annotation of known RefSeq transcripts was obtained from UCSC.
Read filtering, alignment, and weighting
Low-complexity reads were filtered out based on their dinucleotide entropy as follows: For each read, the dinucleotide entropy was calculated according to the formula H=Σifilog(fi), where fi is the frequency of dinucleotide i in the read and the sum is over all dinucleotides (i from 1 to 16). The read was filter out if its H was less than half the dinucleotide entropy of the genome, typically removing <0.5% of the reads in a given sample. Alignments to the mouse genome were performed by the software bowtie (version 0.9.9.1; Langmead et al, 2009) with parameters -v 2 -a -m 100, tracking up to 100 best alignment positions per query and allowing at most two mismatches. To track genomically untemplated hits (e.g., exon-exon junctions or missing parts in the current assembly), the reads were also mapped to an annotation database containing known mouse sequences (microRNA from ftp://ftp.sanger.ac.uk/pub/mirbase/sequences/13.0, rRNA, snRNA, snoRNA and RefSeq mRNA from GenBank http://www.ncbi.nlm.nih.gov/sites/entrez, downloaded on 16 July 2009, tRNA from http://lowelab.ucsc.edu/GtRNAdb/ and piRNA from NCBI (accessions DQ539889 to DQ569912). In that case, all best hits with at most two mismatches were tracked. Each alignment was weighted by the inverse of the number of hits. In the cases where a read had more hits to an individual sequence from the annotation database than to the whole genome, the former number of hits was selected to ensure that the total weight of a read does not exceed one. All quantifications were based on weighted alignments. For generation of wiggle files, samples were normalized for library size first and files were generated with a window size of 100 bps.
RNA sequencing
Poly-A-RNA-seq
RNA from ES cells, NP cells, and TN was isolated using the Trizol (Invitrogen). The sequencing libraries were prepared according to mRNA-Seq Sample Preparation Guide (Illumina) starting from 1 μg of total RNA and using oligo dT primers for selection of polyadenylated mRNAs. The libraries were sequenced on an Illumina GA II analyzer.
Ribosome-depleted-RNA-seq
RNA was isolated from ES cells, NP cells, and TN using Trizol (Invitrogen) followed by depletion of ribosomal RNA, starting with 2 μg of total RNA and following the instructions of Ribo-Zero Kit (Epicentre). Strand-specific RNA libraries were prepared according to pre-release version of the Directional mRNA-Seq Library Preparation guide (Illumina) and sequenced on an Illumina GA II analyzer.
Reads were mapped to the M. musculus transcriptome and normalized to transcript length and sequencing library size.
The raw .srf and .wig files are accessible at GEO GSE33252.
Small RNA sequencing
RNA of ES, NP, and TN was isolated in triplicates from cell culture with mirVana™ microRNA Isolation Kit (AM1560) according to the kit instructions. Small RNA was prepared for sequencing with Illumina Small RNA Sequencing Kit (FC-102-1009) following the Small RNA Sample Prep v1.5.0 protocol.
All samples were barcoded at the 3′ end of the 5′ adaptor using a hamming distance two code with a 3′ cytosine (AGGA, AGTC, ATCA) and sequenced in three lanes (one lane per cell type) of an Illumina GA2 instrument.
The raw .fastq and .wig files are accessible at GEO GSE33252.
Linear model to predict transcription rate
We used R (Team, 2011) and the function lm() to fit a linear model to describe transcription rate. For every gene, we selected a representative transcript of median length. Only transcripts, which did not overlap with alternative transcripts with different TSS or transcripts in antisense direction, were kept for further analysis (Supplementary information section 2).
ChIP-seq reads of Pol-II, H3K4me3, and H3K27me3 were mapped to the TSS (±500 bp) of the representative transcript. H3K36me3 was mapped to four different regions along the gene body: (i) exons within first 2 kb of the transcripts, (ii) introns within the first 2 kb of the transcripts, (iii) exons located 2 kb downstream from the TSS, and (iv) introns located 2 kb downstream from the TSS (Supplementary information section 3). Input chromatin sequencing reads were mapped to the whole gene body and used as an additional regressor to account for amplification and sequencing biases caused by the DNA sequence itself.
These seven regressors were fitted to mRNA levels as response value (mean read count of poly-A-enriched RNA sequencing and strand-specific sequencing) with two-fold cross-validation. The squared Pearson’s correlation coefficient corresponds to the explained variance in the response variable.
Transcript half-life measurement
ES cells and TN of two independent biological replicates were treated with actinomycin D as previously described (Sharova et al, 2009). RNA was isolated from an equal number of cells with Trizol at 1, 2, 4, and 8 h after treatment.
In all, 100 ng of extracted total RNA was amplified using the Ambion WT Expression kit (Ambion) and the resulting sense-strand cDNA was fragmented and labeled using the Affymetrix GeneChip WT Terminal Labeling kit (Affymetrix). Affymetrix GeneChip arrays were hybridized following the ‘GeneChip Whole Transcript (WT) Sense Target Labeling Assay Manual’ (Affymetrix) with a hybridization time of 16 h. The Affymetrix Fluidics protocol FS450_0007 was used for washing.
Scanning was performed with Affymetrix GCC Scan Control v. 3.0.0.1214 on a GeneChip® Scanner 3000 with autoloader.
Subsequently arrays were normalized with RMA, without in between normalization to preserve absolute mRNA abundance. Decay slope of every transcript was inferred with a linear model and only transcripts with reliably inferable slopes (R?0.4) were kept for further analysis. Transcripts half-lives were calculated from the mRNA abundance over time according to Sharova et al (2009) (see Supplementary information section 5 for detailed description).
The raw.CEL files and a table with normalized expressions are accessible at GEO GSE33252.
To confirm our results obtained by actinomycin D treatment, we infer mRNA half-life by metabolic labeling of nascent RNA adapted from the protocol described in Dölken et al (2008). RNA was isolated with Trizol, using 30 μg RNA (a final concentration of 120 ng/μl) for the biotinylation, followed by two chloroform/IAA extractions on the bio tagged RNA. Non-denaturated RNA is used in the IP with Dynabeads M-280 Streptavidin (#112.06D; Invitrogen) for pull down (50 μl/30 μg RNA), followed by one elution step with DTT.
See Supplementary information section 6 for experimental details, analysis, and results. The raw.CEL files and a table with normalized expressions are accessible at GEO GSE33252.
Data accession
All the data used in this study are accessible at GEO GSE33252.
Supplementary Material
Supplementary Information
Acknowledgments
We thank members of the Schübeler laboratory for feedback on the manuscript. Illumina sequencing was carried out at the Quantitative Genomics Facility of the Department of Biosystems Science and Engineering (D-BSSE). SCT is supported by a predoctoral fellowship of the Boehringer Ingelheim Foundation. Research in the laboratory of DS is supported by the Novartis Research Foundation, by the European Union (NoE ‘EpiGeneSys’ FP7-HEALTH-2010-257082, LSHG-CT-2006-037415), the European Research Council (ERC-204264) and the Swiss initiative in Systems Biology (SystemsX.ch).
Author contributions: SCT, MBS, DG, and DS conceived the study. RI performed and analyzed strand-specific RNA sequencing. AS performed H3K36me3 ChIP experiments. LH performed the metabolic labeling experiments. EvN performed and supervised the estimation of noise. PFS, MBS, and DS supervised the study. SCT, MBS, and DS wrote the manuscript.
Footnotes
The authors declare that they have no conflict of interest.
References
- Ambros V (2004) The functions of animal microRNAs. Nature 431: 350–355 [DOI] [PubMed] [Google Scholar]
- Babiarz JE, Ruby JG, Wang Y, Bartel DP, Blelloch R (2008) Mouse ES cells express endogenous shRNAs, siRNAs, and other Microprocessor-independent, Dicer-dependent small RNAs. Genes Dev 22: 2773–2785 [DOI] [PMC free article] [PubMed] [Google Scholar]
- Barski A, Cuddapah S, Cui K, Roh TY, Schones DE, Wang Z, Wei G, Chepelev I, Zhao K (2007) High-resolution profiling of histone methylations in the human genome. Cell 129: 823–837 [DOI] [PubMed] [Google Scholar]
- Beitzinger M, Peters L, Zhu JY, Kremmer E, Meister G (2007) Identification of human microRNA targets from isolated argonaute protein complexes. RNA Biol 4: 76–84 [DOI] [PubMed] [Google Scholar]
- Bell O, Schwaiger M, Oakeley EJ, Lienert F, Beisel C, Stadler MB, Schubeler D (2010) Accessibility of the Drosophila genome discriminates PcG repression, H4K16 acetylation and replication timing. Nat Struct Mol Biol 17: 894–900 [DOI] [PubMed] [Google Scholar]
- Bell O, Wirbelauer C, Hild M, Scharf AN, Schwaiger M, MacAlpine DM, Zilbermann F, van Leeuwen F, Bell SP, Imhof A, Garza D, Peters AH, Schübeler D (2007) Localized H3K36 methylation states define histone H4K16 acetylation during transcriptional elongation in Drosophila. EMBO J 26: 4974–4984 [DOI] [PMC free article] [PubMed] [Google Scholar]
- Bibel M, Richter J, Lacroix E, Barde Y-A (2007) Generation of a defined and uniform population of CNS progenitors and neurons from mouse embryonic stem cells. Nat Protoc 2: 1034–1043 [DOI] [PubMed] [Google Scholar]
- Bird A (2002) DNA methylation patterns and epigenetic memory. Genes Dev 16: 6–21 [DOI] [PubMed] [Google Scholar]
- Boyer LA, Plath K, Zeitlinger J, Brambrink T, Medeiros LA, Lee TI, Levine SS, Wernig M, Tajonar A, Ray MK, Bell GW, Otte AP, Vidal M, Gifford DK, Young RA, Jaenisch R (2006) Polycomb complexes repress developmental regulators in murine embryonic stem cells. Nature 441: 349–353 [DOI] [PubMed] [Google Scholar]
- Buratowski S, Kim T (2010) The role of cotranscriptional histone methylations. Cold Spring Harb Symp Quan Biol 75: 95–102 [DOI] [PMC free article] [PubMed] [Google Scholar]
- Cheng C, Gerstein M (2011) Modeling the relative relationship of transcription factor binding and histone modifications to gene expression levels in mouse embryonic stem cells. Nucleic Acids Res 40: 553–568 [DOI] [PMC free article] [PubMed] [Google Scholar]
- Chi SW, Zang JB, Mele A, Darnell RB (2009) Argonaute HITS-CLIP decodes microRNA-mRNA interaction maps. Nature 460: 479–486 [DOI] [PMC free article] [PubMed] [Google Scholar]
- Deal RB, Henikoff JG, Henikoff S (2010) Genome-wide kinetics of nucleosome turnover determined by metabolic labeling of histones. Science (New York, NY) 328: 1161–1164 [DOI] [PMC free article] [PubMed] [Google Scholar]
- Di Giammartino DC, Nishida K, Manley JL (2011) Mechanisms and consequences of alternative polyadenylation. Mol Cell 43: 853–866 [DOI] [PMC free article] [PubMed] [Google Scholar]
- Dölken L, Ruzsics Z, Rädle B, Friedel CC, Zimmer R, Mages J, Hoffmann R, Dickinson P, Forster T, Ghazal P, Koszinowski UH (2008) High-resolution gene expression profiling for simultaneous kinetic parameter analysis of RNA synthesis and decay. RNA (New York, NY) 14: 1959–1972 [DOI] [PMC free article] [PubMed] [Google Scholar]
- Eckhardt F, Lewin J, Cortese R, Rakyan VK, Attwood J, Burger M, Burton J, Cox TV, Davies R, Down TA, Haefliger C, Horton R, Howe K, Jackson DK, Kunde J, Koenig C, Liddle J, Niblett D, Otto T, Pettett R et al. (2006) DNA methylation profiling of human chromosomes 6, 20 and 22. Nat Genet 38: 1378–1385 [DOI] [PMC free article] [PubMed] [Google Scholar]
- Edmunds JW, Mahadevan LC, Clayton AL (2008) Dynamic histone H3 methylation during gene induction: HYPB/Setd2 mediates all H3K36 trimethylation. EMBO J 27: 406–420 [DOI] [PMC free article] [PubMed] [Google Scholar]
- Eisenberg E, Levanon EY (2003) Human housekeeping genes are compact. Trends Genet 19: 362–365 [DOI] [PubMed] [Google Scholar]
- Enright AJ, John B, Gaul U, Tuschl T, Sander C, Marks DS (2003) MicroRNA targets in Drosophila. Genome Biol 5: R1. [DOI] [PMC free article] [PubMed] [Google Scholar]
- Gaidatzis D, van Nimwegen E, Hausser J, Zavolan M (2007) Inference of miRNA targets using evolutionary conservation and pathway analysis. BMC Bioinformatics 8: 69. [DOI] [PMC free article] [PubMed] [Google Scholar]
- Guenther MG, Levine SS, Boyer LA, Jaenisch R, Young RA (2007) A chromatin landmark and transcription initiation at most promoters in human cells. Cell 130: 77–88 [DOI] [PMC free article] [PubMed] [Google Scholar]
- Guo H, Ingolia NT, Weissman JS, Bartel DP (2010) Mammalian microRNAs predominantly act to decrease target mRNA levels. Nature 466: 835–840 [DOI] [PMC free article] [PubMed] [Google Scholar]
- Hafner M, Landthaler M, Burger L, Khorshid M, Hausser J, Berninger P, Rothballer A, Ascano M Jr, Jungkamp AC, Munschauer M, Ulrich A, Wardle GS, Dewell S, Zavolan M, Tuschl T (2010) Transcriptome-wide identification of RNA-binding protein and microRNA target sites by PAR-CLIP. Cell 141: 129–141 [DOI] [PMC free article] [PubMed] [Google Scholar]
- Hon G, Wang W, Ren B (2009) Discovery and annotation of functional chromatin signatures in the human genome. PLoS Comput Biol 5: e1000566. [DOI] [PMC free article] [PubMed] [Google Scholar]
- Hutvágner G, McLachlan J, Pasquinelli AE, Bálint E, Tuschl T, Zamore PD (2001) A cellular function for the RNA-interference enzyme Dicer in the maturation of the let-7 small temporal RNA. Science (New York, NY) 293: 834–838 [DOI] [PubMed] [Google Scholar]
- Joshi AA, Struhl K (2005) Eaf3 chromodomain interaction with methylated H3-K36 links histone deacetylation to Pol II elongation. Mol Cell 20: 971–978 [DOI] [PubMed] [Google Scholar]
- Karlic R, Chung H-R, Lasserre J, Vlahovicek K, Vingron M (2010) Histone modification levels are predictive for gene expression. Proc Natl Acad Sci USA 107: 2926–2931 [DOI] [PMC free article] [PubMed] [Google Scholar]
- Keogh MC, Kurdistani SK, Morris SA, Ahn SH, Podolny V, Collins SR, Schuldiner M, Chin K, Punna T, Thompson NJ, Boone C, Emili A, Weissman JS, Hughes TR, Strahl BD, Grunstein M, Greenblatt JF, Buratowski S, Krogan NJ (2005) Cotranscriptional set2 methylation of histone H3 lysine 36 recruits a repressive Rpd3 complex. Cell 123: 593–605 [DOI] [PubMed] [Google Scholar]
- Kizer KO, Phatnani HP, Shibata Y, Hall H, Greenleaf AL, Strahl BD (2005) A novel domain in Set2 mediates RNA polymerase II interaction and couples histone H3 K36 methylation with transcript elongation. Mol Cell Biol 25: 3305–3316 [DOI] [PMC free article] [PubMed] [Google Scholar]
- Kornberg RD, Lorch Y (1999) Twenty-five years of the nucleosome, fundamental particle of the eukaryote chromosome. Cell 98: 285–294 [DOI] [PubMed] [Google Scholar]
- Kouzarides T (2007) Chromatin modifications and their function. Cell 128: 693–705 [DOI] [PubMed] [Google Scholar]
- Krek A, Grün D, Poy MN, Wolf R, Rosenberg L, Epstein EJ, MacMenamin P, da Piedade I, Gunsalus KC, Stoffel M, Rajewsky N (2005) Combinatorial microRNA target predictions. Nat Genet 37: 495–500 [DOI] [PubMed] [Google Scholar]
- Krogan NJ, Kim M, Tong A, Golshani A, Cagney G, Canadien V, Richards DP, Beattie BK, Emili A, Boone C, Shilatifard A, Buratowski S, Greenblatt J (2003) Methylation of histone H3 by Set2 in Saccharomyces cerevisiae is linked to transcriptional elongation by RNA polymerase II. Mol Cell Biol 23: 4207–4218 [DOI] [PMC free article] [PubMed] [Google Scholar]
- Landthaler M, Gaidatzis D, Rothballer A, Chen PY, Soll SJ, Dinic L, Ojo T, Hafner M, Zavolan M, Tuschl T (2008) Molecular characterization of human Argonaute-containing ribonucleoprotein complexes and their bound target mRNAs. RNA (New York, NY) 14: 2580–2596 [DOI] [PMC free article] [PubMed] [Google Scholar]
- Langmead B, Trapnell C, Pop M, Salzberg SL (2009) Ultrafast and memory-efficient alignment of short DNA sequences to the human genome. Genome Biol 10: R25. [DOI] [PMC free article] [PubMed] [Google Scholar]
- Lewis BP, Shih I-H, Jones-Rhoades MW, Bartel DP, Burge CB (2003) Prediction of mammalian microRNA targets. Cell 115: 787–798 [DOI] [PubMed] [Google Scholar]
- Li B, Howe L, Anderson S, Yates JR, Workman JL (2003) The Set2 histone methyltransferase functions through the phosphorylated carboxyl-terminal domain of RNA polymerase II. J Biol Chem 278: 8897–8903 [DOI] [PubMed] [Google Scholar]
- Li J, Moazed D, Gygi SP (2002) Association of the histone methyltransferase Set2 with RNA polymerase II plays a role in transcription elongation. J Biol Chem 277: 49383–49388 [DOI] [PubMed] [Google Scholar]
- Lienert F, Mohn F, Tiwari VK, Baubec T, Roloff TC, Gaidatzis D, Stadler MB, Schübeler D (2011) Genomic prevalence of heterochromatic H3K9me2 and transcription do not discriminate pluripotent from terminally differentiated cells. PLoS Genet 7: e1002090. [DOI] [PMC free article] [PubMed] [Google Scholar]
- Mikkelsen TS, Ku M, Jaffe DB, Issac B, Lieberman E, Giannoukos G, Alvarez P, Brockman W, Kim TK, Koche RP, Lee W, Mendenhall E, O'Donovan A, Presser A, Russ C, Xie X, Meissner A, Wernig M, Jaenisch R, Nusbaum C et al. (2007) Genome-wide maps of chromatin state in pluripotent and lineage-committed cells. Nature 448: 553–560 [DOI] [PMC free article] [PubMed] [Google Scholar]
- Millevoi S, Vagner S (2010) Molecular mechanisms of eukaryotic pre-mRNA 3′ end processing regulation. Nucleic Acids Res 38: 2757–2774 [DOI] [PMC free article] [PubMed] [Google Scholar]
- Min IM, Waterfallzzz JJ, Core LJ, Munroe RJ, Schimenti J, Lis JT (2011) Regulating RNA polymerase pausing and transcription elongation in embryonic stem cells. Genes Dev 25: 742–754 [DOI] [PMC free article] [PubMed] [Google Scholar]
- Mohn F, Schübeler D (2009) Genetics and epigenetics: stability and plasticity during cellular differentiation. Trends Genet 25: 129–136 [DOI] [PubMed] [Google Scholar]
- Mohn F, Weber M, Rebhan M, Roloff TC, Richter J, Stadler MB, Bibel M, Schübeler D (2008) Lineage-specific polycomb targets and de novo DNA methylation define restriction and potential of neuronal progenitors. Mol Cell 30: 755–766 [DOI] [PubMed] [Google Scholar]
- Mukherji S, Ebert MS, Zheng GXY, Tsang JS, Sharp PA, van Oudenaarden A (2011) MicroRNAs can generate thresholds in target gene expression. Nat Genet 43: 854–859 [DOI] [PMC free article] [PubMed] [Google Scholar]
- Murchison EP, Partridge JF, Tam OH, Cheloufi S, Hannon GJ (2005) Characterization of Dicer-deficient murine embryonic stem cells. Proc Natl Acad Sci USA 102: 12135–12140 [DOI] [PMC free article] [PubMed] [Google Scholar]
- Nilsen TW, Graveley BR (2010) Expansion of the eukaryotic proteome by alternative splicing. Nature 463: 457–463 [DOI] [PMC free article] [PubMed] [Google Scholar]
- Ouyang Z, Zhou Q, Wong WH (2009) ChIP-Seq of transcription factors predicts absolute and differential gene expression in embryonic stem cells. Proc Natl Acad Sci USA 106: 21521–21526 [DOI] [PMC free article] [PubMed] [Google Scholar]
- Pokholok DK, Harbison CT, Levine S, Cole M, Hannett NM, Lee TI, Bell GW, Walker K, Rolfe PA, Herbolsheimer E, Zeitlinger J, Lewitter F, Gifford DK, Young RA (2005) Genome-wide map of nucleosome acetylation and methylation in yeast. Cell 122: 517–527 [DOI] [PubMed] [Google Scholar]
- Rabani M, Levin JZ, Fan L, Adiconis X, Raychowdhury R, Garber M, Gnirke A, Nusbaum C, Hacohen N, Friedman N, Amit I, Regev A (2011) Metabolic labeling of RNA uncovers principles of RNA production and degradation dynamics in mammalian cells. Nat Biotechnol 29: 436–442 [DOI] [PMC free article] [PubMed] [Google Scholar]
- Rahl PB, Lin CY, Seila AC, Flynn RA, McCuine S, Burge CB, Sharp PA, Young RA (2010) c-Myc regulates transcriptional pause release. Cell 141: 432–445 [DOI] [PMC free article] [PubMed] [Google Scholar]
- Rehmsmeier M, Steffen P, Hochsmann M, Giegerich R (2004) Fast and effective prediction of microRNA/target duplexes. RNA 10: 1507–1517 [DOI] [PMC free article] [PubMed] [Google Scholar]
- Schwanhäusser B, Busse D, Li N, Dittmar G, Schuchhardt J, Wolf J, Chen W, Selbach M (2011) Global quantification of mammalian gene expression control. Nature 473: 337–342 [DOI] [PubMed] [Google Scholar]
- Segal E, Widom J (2009) From DNA sequence to transcriptional behaviour: a quantitative approach. Nat Rev Genet 10: 443–456 [DOI] [PMC free article] [PubMed] [Google Scholar]
- Sharova LV, Sharov AA, Nedorezov T, Piao Y, Shaik N, Ko MSH (2009) Database for mRNA half-life of 19 977 genes obtained by DNA microarray analysis of pluripotent and differentiating mouse embryonic stem cells. DNA Res 16: 45–58 [DOI] [PMC free article] [PubMed] [Google Scholar]
- She X, Rohl CA, Castle JC, Kulkarni AV, Johnson JM, Chen R (2009) Definition, conservation and epigenetics of housekeeping and tissue-enriched genes. BMC Genomics 10: 269. [DOI] [PMC free article] [PubMed] [Google Scholar]
- Sinkkonen L, Hugenschmidt T, Berninger P, Gaidatzis D, Mohn F, Artus-Revel CG, Zavolan M, Sinkkonen L, Hugenschmidt T, Berninger P, Gaidatzis D, Mohn F, Artus-Revel CG, Zavolan M, Svoboda P, Filipowicz W (2008) MicroRNAs control de novo DNA methylation through regulation of transcriptional repressors in mouse embryonic stem cells. Nat Struct Mol Biol 15: 259–267 [DOI] [PubMed] [Google Scholar]
- Stark A, Brennecke J, Bushati N, Russell RB, Cohen SM (2005) Animal MicroRNAs confer robustness to gene expression and have a significant impact on 3′UTR evolution. Cell 123: 1133–1146 [DOI] [PubMed] [Google Scholar]
- Strahl BD, Grant PA, Briggs SD, Sun ZW, Bone JR, Caldwell JA, Mollah S, Cook RG, Shabanowitz J, Hunt DF, Allis CD (2002) Set2 is a nucleosomal histone H3-selective methyltransferase that mediates transcriptional repression. Mol Cell Biol 22: 1298–1306 [DOI] [PMC free article] [PubMed] [Google Scholar]
- Su AI, Wiltshire T, Batalov S, Lapp H, Ching KA, Block D, Zhang J, Soden R, Hayakawa M, Kreiman G, Cooke MP, Walker JR, Hogenesch JB (2004) A gene atlas of the mouse and human protein-encoding transcriptomes. Proc Natl Acad Sci USA 101: 6062–6067 [DOI] [PMC free article] [PubMed] [Google Scholar]
- Sun XJ (2005) Identification and characterization of a novel human histone H3 lysine 36-specific methyltransferase. J Biol Chem 280: 35261–35271 [DOI] [PubMed] [Google Scholar]
- Team RDC (2011) ). R: A Language and Environment for Statistical Computing. Retrieved from http://www.R-project.org
- Tiwari VK, Stadler MB, Wirbelauer C, Paro R, Schubeler D, Beisel C (2012) A chromatin-modifying function of JNK during stem cell differentiation. Nat Genet 44: 94–100 [DOI] [PubMed] [Google Scholar]
- Vakoc CR, Sachdeva MM, Wang H, Blobel GA (2006) Profile of histone lysine methylation across transcribed mammalian chromatin. Mol Cell Biol 26: 9185–9195 [DOI] [PMC free article] [PubMed] [Google Scholar]
- van Dongen S, Abreu-Goodger C, Enright A (2008) Detecting microRNA binding and siRNA off-target effects from expression data. Nat Methods 5: 1023–1025 [DOI] [PMC free article] [PubMed] [Google Scholar]
- Vinogradov AE (2004) Compactness of human housekeeping genes: selection for economy or genomic design? Trends Genet 20: 248–253 [DOI] [PubMed] [Google Scholar]
- Wagner EJ, Carpenter PB (2012) Understanding the language of Lys36 methylation at histone H3. Nat Rev Mol Cell Biol 13: 115–126 [DOI] [PMC free article] [PubMed] [Google Scholar]
- Weber M, Hellmann I, Stadler MB, Ramos L, Pääbo S, Rebhan M, Schübeler D (2007) Distribution, silencing potential and evolutionary impact of promoter DNA methylation in the human genome. Nat Genet 39: 457–466 [DOI] [PubMed] [Google Scholar]
- Wirbelauer C, Bell O, Schubeler D (2005) Variant histone H3.3 is deposited at sites of nucleosomal displacement throughout transcribed genes while active histone modifications show a promoter-proximal bias. Genes Dev 19: 1761–1766 [DOI] [PMC free article] [PubMed] [Google Scholar]
- Wyrick JJ, Holstege FC, Jennings EG, Causton HC, Shore D, Grunstein M, Lander ES, Young RA (1999) Chromosomal landscape of nucleosome-dependent gene expression and silencing in yeast. Nature 402: 418–421 [DOI] [PubMed] [Google Scholar]
- Xiao T, Hall H, Kizer KO, Shibata Y, Hall MC, Borchers CH, Strahl BD (2003) Phosphorylation of RNA polymerase II CTD regulates H3 methylation in yeast. Genes Dev 17: 654–663 [DOI] [PMC free article] [PubMed] [Google Scholar]
- Young MD, Willson TA, Wakefield MJ, Trounson E, Hilton DJ, Blewitt ME, Oshlack A, Majewski IJ (2011) ChIP-seq analysis reveals distinct H3K27me3 profiles that correlate with transcriptional activity. Nucleic Acids Res 39: 7415–7427 [DOI] [PMC free article] [PubMed] [Google Scholar]
- Yuan W, Xie J, Long C, Erdjument-Bromage H, Ding X, Zheng Y, Tempst P, Chen S, Zhu B, Reinberg D (2009) Heterogeneous nuclear ribonucleoprotein L Is a subunit of human KMT3a/Set2 complex required for H3 Lys-36 trimethylation activity in vivo. J Biol Chem 284: 15701–15707 [DOI] [PMC free article] [PubMed] [Google Scholar]
- Zhu J, He F, Song S, Wang J, Yu J (2008) How many human genes can be defined as housekeeping with current expression data? BMC Genomics 9: 172. [DOI] [PMC free article] [PubMed] [Google Scholar]
Associated Data
This section collects any data citations, data availability statements, or supplementary materials included in this article.
Supplementary Materials
Supplementary Information