

Abstract
We hypothesize that low-level efflux pump expression is the first step in the development of high-level drug resistance in mycobacteria. We performed 28-day azithromycin dose-effect and dose-scheduling studies in our hollow-fiber model of disseminated Mycobacterium avium-M. intracellulare complex. Both microbial kill and resistance emergence were most closely linked to the within-macrophage area under the concentration-time curve (AUC)/MIC ratio. Quantitative PCR revealed that subtherapeutic azithromycin exposures over 3 days led to a 56-fold increase in expression of MAV_3306, which encodes a putative ABC transporter, and MAV_1406, which encodes a putative major facilitator superfamily pump, in M. avium. By day 7, a subpopulation of M. avium with low-level resistance was encountered and exhibited the classic inverted U curve versus AUC/MIC ratios. The resistance was abolished by an efflux pump inhibitor. While the maximal microbial kill started to decrease after day 7, a population with high-level azithromycin resistance appeared at day 28. This resistance could not be reversed by efflux pump inhibitors. Orthologs of pumps encoded by MAV_3306 and MAV_1406 were identified in Mycobacterium tuberculosis, Mycobacterium leprae, Mycobacterium marinum, Mycobacterium abscessus, and Mycobacterium ulcerans. All had highly conserved protein secondary structures. We propose that induction of several efflux pumps is the first step in a general pathway to drug resistance that eventually leads to high-level chromosomal-mutation-related resistance in mycobacteria as ordered events in an “antibiotic resistance arrow of time.”
INTRODUCTION
While many mycobacteria cause human disease, Mycobacterium tuberculosis complex (MTC), Mycobacterium avium-M. intracellulare complex (MAC), Mycobacterium ulcerans, and Mycobacterium leprae are by far the most important pathogens in global health. Mycobacterial diseases are difficult to treat, and resistance emergence is a major challenge. The standard belief has been that drug resistance arises sequentially based on stepwise development of chromosomal mutations (19). In addition, resistance is often said to have “emerged” in mycobacteria at some arbitrary time point, usually synonymous with development of chromosomal mutations associated with drug resistance or achievement of the threshold of 1% of the total population (6, 7, 37). Efflux pump induction is increasingly being considered an important mechanism of resistance in many bacteria, including MTC (9, 26, 31, 32, 34). We recently demonstrated for MTC that efflux pumps were a first step that allowed the development of high-level ethambutol resistance (41, 45). We hypothesized that this could be a general pathway in the development of drug resistance in other pathogenic mycobacteria. Here, we investigated whether this is true using azithromycin treatment in a model of disseminated MAC disease (12, 13).
MAC infection often presents as either pulmonary disease or disseminated disease. Disseminated MAC disease is an important AIDS-defining illness (27). While interest in the disease has waned in the era of antiretroviral therapy, many of our own patients still present with this potentially fatal disease when AIDS is first diagnosed (11). Therapy consists of at least two drugs—a macrolide, such as azithromycin or clarithromycin, in combination with ethambutol—for a duration of at least a year (21, 27). Immune reconstitution due to antiretroviral therapy is the essential therapeutic event that leads to stopping therapy. On the other hand, disseminated MAC disease continues to be a problem in non-AIDS patients with more intractable immunodeficiency, such as posttransplant patients and those on chronic immunosuppressive therapy (24, 25). In these patients, there is no obvious endpoint when therapy should be stopped. Efficacy in these patients could be improved by pharmacokinetic-pharmacodynamic (PK/PD)-based dosing.
Therapy outcomes for disseminated MAC disease depend on macrolide susceptibility at the start of therapy, while patients also fail therapy if resistance to macrolides develops during the therapy (4, 20). Resistance is due to mutations in the peptidyltransferase region of the 23S rRNA gene (35, 36, 40). We were interested in examining the role of efflux pumps in MAC's resistance to azithromycin for several reasons. First, our studies with MTC, from which we identified the role of low-level resistance efflux pumps, were based on standard antituberculosis (anti-TB) agents, such as ethambutol and isoniazid. Second, in disseminated MAC disease, the bacteria reside inside cells of the reticuloendothelial system (47, 48), as opposed to MTC, which in active pulmonary TB is predominantly extracellular (16). We wanted to determine if efflux pumps would play the same role in the intracellular milieu. Third, macrolide resistance is a crucial determinant of therapy failure in disseminated MAC disease. Strategies to suppress macrolide resistance emergence could lead to more effective treatments. Fourth, due to ease of cultivation compared to other mycobacteria, such as M. ulcerans and M. leprae, and the lack of a requirement for a biosafety level 3 (BSL-3) laboratory, MAC is an attractive model to study the molecular events associated with emergence of drug resistance in mycobacteria in response to different PK/PD exposures.
MATERIALS AND METHODS
Bacterial isolate.
We utilized Mycobacterium avium subsp. hominissuis (ATCC 700898) for all our studies. Stock cultures were stored in Middlebrook 7H9 broth and 10% glycerol at −80°C. Prior to each experiment, we thawed the bacterial stock and incubated it in a water bath under shaking conditions at 37°C in Middlebrook 7H9 broth with 10% oleic acid-albumin-dextrose-catalase (OADC) for 4 days. The azithromycin MIC was determined based on two methods, each performed twice: Etest (AB Biodisk) and an agar dilution test (7).
Materials.
Azithromycin was purchased from the University of Texas (UT) Southwestern Medical Center Pharmacy. Thioridazine was purchased from Sigma. Azithromycin and thioridazine were dissolved in water, sterile filtered, and then diluted to the desired concentration in sterile water. Thioridazine was shielded from direct light in all experiments. Hollow-fiber cartridges were purchased from FiberCell (Frederick, MD).
HFS studies of disseminated MAC disease.
The hollow fiber has been used as a model to study of bacterium-antibiotic interaction since approximately 1985; we adapted it for use in MTC and intracellular MAC (5, 12, 13, 22, 23). The hollow-fiber model of disseminated MAC disease has been described in detail previously (12, 13). THP-1 macrophages (ATCC TIB-202) were cultured in RPMI 1640 containing 10% fetal bovine serum (FBS). The cells were infected overnight with MAC at a bacterium-to-macrophage ratio of 10:1. The macrophages were then centrifuged, extracellular bacteria were washed away, and the cells were inoculated into the peripheral compartments of the hollow-fiber system (HFS), which is a circulating system containing RPMI 1640 supplemented with 2% FBS.
Dose-ranging studies were performed to achieve concentration-time profiles similar to those achieved in patients treated with azithromycin doses between 250 mg and 16,000 mg a day (every 24 h) for 28 days (29, 33). The peripheral compartment of each system was sampled on days 4, 7, 10, 14, 21, and 28 for macrophage count and for culture. Macrophages were separated from media by centrifugation and then ruptured to release MAC for culture on Middlebrook 7H10 agar, as described previously (12, 13). MAC cultures on Middlebrook agar were used to calculate the total bacillary population, as described previously (12, 13). To enumerate the low-level azithromycin-resistant subpopulation, the agar was supplemented with 3 times the MIC of azithromycin. For high-level resistance, the agar was supplemented with 256 mg/liter azithromycin, which is the standard critical concentration on Middlebrook 7H10 agar (7). In order to demonstrate the effect of efflux pumps, the same samples were cultured on agar that had been further supplemented with the efflux pump inhibitor thioridazine at a concentration of 1 mg/liter. This concentration of thioridazine does not kill MAC and does not change the azithromycin MIC, based on preliminary studies. For pharmacokinetic studies, samples were drawn from both the central and peripheral compartments of each HFS after day 28 at 0, 0.5, 1.5, 2, 4, 8, 12, and 24 h postdose. Macrophage counts and volumes were determined as described below. Media and macrophages were separated using methods described previously (12, 13). The relationship between the bacterial burden and the drug concentration was examined using the inhibitory sigmoid maximal microbial kill (Emax) model in GraphPad Prism 5 software.
Dose-scheduling studies were performed with HFS treated with azithromycin for a total of 28 days. Azithromycin exposures, such as the concentration associated with 20% of maximal kill (20% effective concentration [EC20]), 50% of maximal kill (EC50), and 80% of maximal kill (EC80), based on the inhibitory sigmoid Emax model for dose-effect studies, were administered to HFSs. Each of these exposures was administered as one of three dosing schedules: the entire cumulative 1-week exposure once a week, split into 2 and administered every 3.5 days, or split into 7 and administered daily. Macrophage counts and MAC cultures were examined on days 3, 7, 14, 21, and 28 for total bacterial burden, as well as azithromycin-resistant subpopulations.
Measurement of azithromycin concentrations and pharmacokinetic analysis.
The azithromycin concentration was measured using a Shimadzu high-performance liquid chromatography (HPLC) system interfaced with a tandem, triple-quadrupole mass spectrometer (AB Sciex; API 3000). Samples (100 μl); carbonate buffer, pH 9.5 (300 μl); and internal standard (roxithromycin; 30 μl) were extracted using 3.5 ml hexane-ethyl acetate (50:50). The organic phase was separated, evaporated, and reconstituted with 100 μl of the mobile phase for injection. Following injection (10 μl), chromatographic separation was performed using a Sunrise C18 3.5-μm (5-cm by 2.1-mm) column, and isocratic elution was performed using a mixture of 0.6 ml of glacial acetic acid, 1.54 g of ammonium acetate, 250 ml of water, 570 ml of acetonitrile, and 180 ml of methanol at 0.2 ml/min at room temperature. Azithromycin and the internal standard were analyzed using positive electrospray ionization combined with multiple-reaction monitoring. Quantitation using the precursor→product ion combinations of 749.50→591.4 and 838.50→680.50 m/z resulted in a 5-min run time. A liquid-liquid extraction technique was adopted for sample preparation, and the observed recovery of azithromycin was 98%. The standard curve was linear (r = 0.9987) and ranged from 1 ng/ml to 1,000 ng/ml. The limits of quantitation were 1 ng/ml. Intraday and interday precisions were equivalent and were less than 5% relative standard deviation throughout the validated range of concentrations.
In order to calculate the azithromycin concentration per macrophage, the concentration of azithromycin per milliliter was divided by the number of macrophages in each milliliter in each HFS. Macrophage volumes were determined using a Coulter counter. The azithromycin concentration in macrophages was then calculated as the concentration per macrophage divided by the average volume of each infected macrophage. This calculation does not account for possible leakage of azithromycin out of the macrophages and thus may underestimate the intracellular concentration.
Pharmacokinetic modeling was performed using Adapt 5 software (8). Azithromycin concentrations from the central compartment were modeled as a one-compartment model with first-order input and elimination. Intramacrophage pharmacokinetics were modeled as a one-compartment model and as a two-compartment model, with the best model chosen using Akaike's information criteria (2).
Induction of efflux pump-encoding genes early during therapy.
Macrolide efflux as a resistance mechanism has been well described in such Gram-positive pathogens as Staphylococcus aureus and Streptococcus pneumoniae. The pumps include MsrA in S. aureus encoded by SAV1361, the S. pneumoniae Mel protein encoded by SPR1021, and S. pneumoniae MefE encoded by SPR0971, as well as several genes in antibiotic-producing Streptomyces species that encode efflux pumps against the antibiotics they secrete (9, 10, 17, 18, 28, 44, 49). We hypothesized that orthologs of these genes for known macrolide efflux pumps in MAC would also be induced by macrolides. Candidate orthologs were chosen by use of the Kyoto Encyclopedia of Genes and Genomes (KEGG) bioinformatics resource (http://www.genome.jp/kegg). Three MAC macrolide efflux pump candidate genes were chosen: MAV_1406, MAV_3306, and MAV_1695. We were interested in performing quantitative real-time PCRs to demonstrate that at least one of these genes was upregulated early in response to azithromycin, prior to the first time point when efflux pump inhibitor-reversible phenotypic resistance was demonstrated.
MAC cultures on day 4 of log-phase growth were adjusted to a bacterial density of 8.7 log10 CFU/ml suspension in Middlebrook 7H9 broth with 10% OADC and were treated with 16 mg/liter azithromycin (i.e., 1/2 MIC) or saline (sham) in triplicate and incubated at 37°C under 5% CO2. We chose this approach instead of intracellular MAC in the HFS to demonstrate that the efflux pump induction is independent of the role of macrophages and the immune system. At 0, 1, 24, 48, and 72 h, the cultures were divided into two portions for either determination of CFU/ml or RNA extraction. In order to enumerate the bacillary burden at each time point, cultures were washed, serially diluted, and then cultured on Middlebrook agar at 37°C under 5% CO2. RNA extraction was performed using the RNeasy Minikit (Qiagen) according to the manufacturer's protocol. Column-purified RNA was treated with Turbo DNase (Ambion) for 30 min at 37°C according to the manufacturer's recommendations. The quality and quantity of the RNA were measured using NanoDrop. One hundred nanograms of RNA was reverse transcribed into cDNA with the BluePrint Reverse Transcription Kit (TaKaRa Bio Inc., Japan) by incubating the reaction mixture at 30°C for 10 min, followed by incubation at 42°C for 15 min and 70°C for 5 min. Custom primers and TaqMan probes (5′-6-carboxyfluorescein [FAM] reporter and 3′-6-carboxytetramethylrhodamine [TAMRA] quencher) for putative MAC efflux pump genes were designed using the real-time primer-designing tool available online from GeneScript and Integrated DNA Technologies; the list of probes and primers we designed and used are shown in Table 1. Real-time PCR was performed using 5 ng cDNA and 2× TaqMan Universal Master Mix II (no uracil-N-glycosylase) on an ABI 7300 series PCR machine (Applied Biosystems, Carlsbad, CA), following the manufacturer's instructions. The final concentrations of primers and probes in the reaction mixture were 900 nM and 250 nM, respectively. The real-time cycling parameters were as follows: 1 cycle at 95°C for 10 min, followed by 40 cycles of 95°C for 15 s and 60°C for 1 min. All reactions were performed in triplicate and repeated at least three times. The relative expression of each gene in each replicate at each time point was calculated by the comparative threshold cycle (ΔΔCT) method with the groEL gene as the endogenous control.
Table 1.
Probes and primers used in real-time PCR experiments
| Primer or probe | MAV_1695 (amplicon, 105 bp) | MAV_1406 (amplicon, 110 bp) | MAV_3306 (amplicon, 102 bp) |
|---|---|---|---|
| Forward | CACGTTGAGCTTCTATCCAGG | TGCTGAATCTGGCTTTCATC | GAAATCGGTTATCTGCCACA |
| Reverse | TTGTTCGGCTTGTCCAGG | GAAGGACAAGGCGAAACAAC | GTCGGTGAGCAACACGTC |
| Probe | TCGAGCGTCTTGCGGATCATGG | CTGGGCGGCATCAACACGAT | TCCAGGTCGCCCTCTTTGGG |
We were also interested in demonstrating that other important pathogenic mycobacteria contained systems similar to those of MAC, making it likely that our findings would apply to other mycobacteria. Genes for putative MAC efflux pumps that demonstrated at least 2-fold induction were then chosen. We searched for orthologs in MTC H37Rv, Mycobacterium bovis, M. leprae, Mycobacterium marinum, M. ulcerans, and M. abscessus, important global pathogens. Mycobacterium avium subsp. paratuberculosis, which causes Johnne's disease in animals and has been implicated in Crohn's disease (38), was also examined. Orthologs were chosen by use of the KEGG bioinformatics resource. The predicted protein secondary structures of the orthologs were then compared to those of the MAC proteins by use of the CLC Protein Workbench version 5.8.1 (CLC Bio, Cambridge, MA).
RESULTS
The azithromycin MIC was 32 mg/liter, similar to the MIC90 of clinical isolates from patients with disseminated MAC disease (15). Azithromycin mean pharmacokinetic parameter estimates (± standard deviation [SD]) for the central compartment were a total clearance of 24.1 ± 2.41 liters/h and a volume of 290 ± 41.7 liters. However, when the concentrations of azithromycin achieved in the central compartment were related to the MIC, as shown in Table 2, the exposures achieved with each dose rarely exceeded the MIC, except at very high doses, such as those equivalent to 16,000 mg a day in patients. However, the concentrations of azithromycin achieved within macrophages were several thousandfold higher than in the central or peripheral compartment (Fig. 1). Figure 1 demonstrates that the ratio of the intracellular to the extracellular concentrations varied with time and drifted down 3.9-fold from the start of the dosing interval until the 4-h time point, after which the ratios remained stable. Thus, the relationship between intracellular and extracellular azithromycin concentrations was nonlinear. The azithromycin pharmacokinetics within the macrophages were best described by a two-compartment model with an absorption rate constant of 3.18 ± 3.83/h, a mean total clearance of 0.0012 ± 0.0007 liter/h, a volume of the central compartment of 0.00004 ± 0.00007 liter, an intercompartmental clearance of 18.53 ± 23.62 liters/h, and a larger volume of the peripheral compartment of 0.02 ± 0.01 liter. Thus, the azithromycin clearance from macrophages was 20,000 times slower than from the central compartment, which, together with higher drug penetration, accounts for the high intracellular drug exposures. The azithromycin exposures achieved within macrophages are shown in Table 2.
Table 2.
Azithromycin exposures achieved in the central compartment and within infected macrophagesa
| HFS parameter | Value at human equivalent dose of (mg per day): |
||||||
|---|---|---|---|---|---|---|---|
| 250 | 500 | 1,000 | 2,000 | 4,000 | 8,000 | 16,000 | |
| Extracellular | |||||||
| AUC0-24/MIC | 0.003 | 0.184 | 0.190 | 0.500 | 0.928 | 1.112 | 2.324 |
| Peak/MIC ratio | 0.002 | 0.012 | 0.017 | 0.032 | 0.059 | 0.085 | 0.187 |
| % Time concn remains above MIC | 0 | 0 | 0 | 0 | 0 | 0 | 0 |
| Intracellular | |||||||
| AUC0-24/MIC | 881 | 3,403 | 3,524 | 6,705 | 15,538 | 17,238 | 61,500 |
| Peak/MIC ratio | 114 | 457 | 454 | 1,218 | 3,424 | 3,268 | 7,003 |
| % Time concn remains above MIC | 100 | 100 | 100 | 100 | 100 | 100 | 100 |
The azithromycin MIC was 32 mg/liter. The results are total drug concentrations, not non-protein bound. The effects of serum protein binding on the intracellular drug concentration and efficacy are unknown (13). Standard doses give exposures in hollow-fiber systems with doses of 500 and 1,000 mg per day.
Fig 1.

Ratio of the intracellular azithromycin concentration to that in the central compartment. At each of the time points when simultaneous drug concentrations were measured, azithromycin concentrations were much higher inside macrophages for all systems. A log10 scale is used on the y axis; even with that scale, it can be seen that the ratios are not similar at all time points, and the relationships between intracellular and extracellular concentrations are thus nonlinear. The error bars indicate SD.
On day 0 of the dose-effect study, the starting inoculum in each HFS was 5.5 log10 CFU/ml. On subsequent days, the Emax was 0.87 ± 0.13 log10 CFU/ml on day 4, with the highest Emax of 2.11 ± 0.26 log10 CFU/ml achieved on day 7, after which the Emax slowly started to decrease through days 14 to 28, when it fell to 1.53 ± 0.31 log10 CFU/ml (Fig. 2). The day 7 dose-response curve, based on intramacrophage drug concentrations, was described by an EC50 that was an area under the concentration-time curve from 0 to 24 h (AUC0-24)/MIC ratio of 17,288 ± 565 (r2 = 0.95). If central compartment concentrations, analogous to “serum” concentrations, had been used, the EC50 would have been an AUC0-24/MIC ratio of only 2.11 ± 0.26. The full exposure-effect curve at the end of the study (day 28) was described by the following equation: effect (log10 CFU/ml) = 7.60 − 1.53 × AUC0-24/MIC2.86/(12,9582.86 + AUC0-24/MIC2.86), where all AUC/MIC exposures are intramacrophage concentrations.
Fig 2.

Azithromycin dose-response curves in the hollow-fiber system. Given that extracellular concentrations did not exceed the MIC in most cases but the drug nevertheless could kill MAC, we chose to use the intracellular concentrations for the dose-response curve.
The decrease in maximal kill after 7 days was due to emergence of drug resistance in a portion of the total population. On day 4, the drug-resistant subpopulation was below the limits of detection. However, by day 10, a resistant subpopulation could be demonstrated. The relationship between drug exposure and the size of the drug-resistant population was best depicted by the inverted U-shaped curve (Fig. 3). However, when the same cultures were examined for drug resistance on agar supplemented with the efflux pump inhibitor, there were no drug-resistant colonies on the agar. Thus, the entire drug-resistant subpopulation that arose early during therapy could be accounted for by efflux pump induction.
Fig 3.

Relationship between the azithromycin-resistant subpopulation and azithromycin exposure on day 10 of the dose-effect study. The relationship between the size of the low-level-resistant subpopulation and drug exposures (AUC/MIC) was described by the familiar inverted U shape.
Dose-scheduling study results are shown in Fig. 4, which demonstrates that the total microbial burden did not differ with the dosing schedule. Similarly, the dosing schedule did not affect the sizes of drug-resistant subpopulations. This means that both the azithromycin microbial kill and resistance suppression are most closely linked to the AUC0-24/MIC ratio. On day 7, a low-level azithromycin-resistant subpopulation was encountered in all HFSs treated with azithromycin, with reduction in the size of the resistant subpopulation in the presence of the efflux pump inhibitor thioridazine (Fig. 5A). This phenotype did not grow on agar containing 256 mg/liter azithromycin. By day 28, however, an even larger proportion of the azithromycin-resistant subpopulation could be inhibited by thioridazine (Fig. 5B). This means that progressively larger populations of intracellular MAC continued to be recruited for efflux pump induction, which was dependent on the drug exposure (Fig. 5B). In addition, day 28 cultures revealed that the resistant subpopulations in several HFSs grew on agar with 256 mg/liter azithromycin, but the efflux pump inhibitor did not change the size, consistent with the emergence of another, more stable mechanism of drug resistance (Fig. 5C). Taken together, these experiments suggest that efflux pumps play an early role in establishing low-level resistance, which gives the intracellular MAC survival advantage until the emergence of high-level resistance.
Fig 4.

Effect of the dosing schedule on the total microbial population. There was virtually no difference in microbial kill by dosing schedule for each drug exposure examined, consistent with an AUC/MIC-linked effect.
Fig 5.

Emergence of high-level drug resistance follows low-level resistance mediated by efflux pumps. (A) On day 7, a low-level drug-resistant subpopulation was encountered. The subpopulation is a phenotype that grows on agar supplemented with 3× MIC (96 mg/liter) but not on agar supplemented with 256 mg/liter azithromycin. Since some of the population did not grow on plates supplemented with the efflux pump inhibitor thioridazine at 1 mg/liter (which has no effect on the microbial kill on its own), this means that efflux pumps accounted for a substantial portion of the resistance. The scale for the bacterial burden is a log scale, so what looks like small differences on this scale are relatively large on a linear scale. (B) By day 28, this low-level-resistant subpopulation had increased substantially, as had the proportion that could be inhibited by the efflux pump inhibitor. (C) A high-level-resistant subpopulation (which grew on 256 mg/liter azithromycin) had emerged by day 28 in some HFSs. Thioridazine had no effect on the size of that population. Neither a low-level- nor a high-level-resistant azithromycin subpopulation was encountered in untreated controls (not shown). The error bars indicate SD.
We looked for the early induction of three putative efflux pump genes, with results shown in Fig. 6. The figure demonstrates a 56-fold induction of MAV_3306, which encodes an ATP binding cassette (ABC) transporter, in a stepwise increase over 3 days, i.e., in a dose-dependent fashion with time as the “dose.” This suggests a recruitment process that takes several days, as opposed to an on-off “switch.” On the other hand, for MAV_1406, which encodes a major facilitator superfamily (MFS) pump, there was an abrupt induction noted at the 24-h time point, at which time it had reached the maximum induction, which was maintained throughout the 72 h of the experiment. In contrast to these pumps, MAV_1695 demonstrated no significant induction, suggesting either that the pump it encodes is not involved in azithromycin resistance in MAC or that it may be induced at a later stage. Overall, these data suggest induction of efflux pumps ahead of the early phenotypic reversible low-level resistance, itself preceding nonreversible resistance by up to 3 weeks: an “antibiotic resistance arrow of time” (Fig. 7).
Fig 6.

Real-time PCR of three putative azithromycin efflux pumps. MAC was incubated with 16 mg/liter azithromycin. (A) MAV_1659 demonstrated no significant upregulation during the first 72 h of exposure to azithromycin. (B) MAV_1406 demonstrated no significant change at 1 h (1.36- ± 0.30- versus 1.01- ± 0.17-fold) but was upregulated at 24 h (56.05- ± 9.99- versus 1.01- ± 0.17-fold) compared to baseline. There was no further change in induction beyond 24 h. (C) MAV_3306 induction was stepwise, starting at 1 h (1.68- ± 0.46- versus 1.00- ± 0.46-fold) to 50.60- ± 9.41- versus 1.01- ± 0.11-fold at 72 h. The error bars indicate SD.
Fig 7.
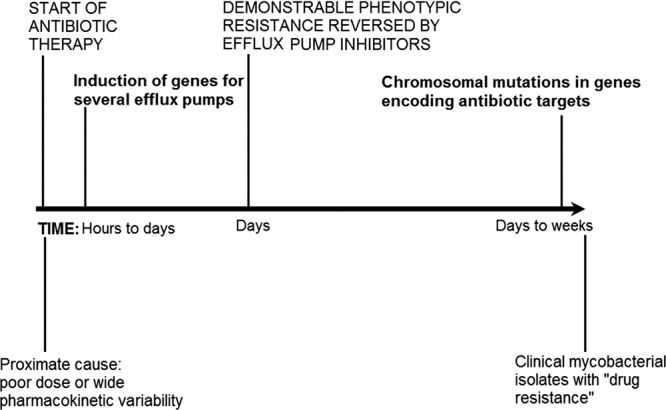
Antibiotic resistance arrow of time. The diagram depicts the proposed steps in the evolution of high-level antibiotic resistance in mycobacteria.
The two MAC efflux pump proteins whose genes were upregulated in the presence of azithromycin were examined for sequence conservation in other pathogenic mycobacteria. With regard to the MFS efflux pump encoded by MAV_1406, orthologs identified included MAP2516 of M. avium subsp. paratuberculosis, MTC Rv1258c, M. marinum MMAR_4182, M. bovis JTY_1291, and M. abscessus MAB_1409c. The degrees of protein identity and the conserved amino acid motifs are shown in Fig. 8. There is remarkable conservation of protein secondary structure, which is closely linked to function. The MTC ortholog Rv1258c (0.73 identity with MAV_1406) is a well-known proton-dependent efflux pump whose substrates are macrolides and tetracyclines (1). In regard to the second efflux pump, the ABC transporter encoded by MAV_3306, proteins with even higher identity were identified (all ≥0.90 identity). They were M. avium subsp. paratuberculosis MAP1198, M. marinum MMAR_2279, M. ulcerans MUL_1481, M. bovis BCG BCG_1534, MTC Rv1473, and MLBr_01816 in the leprosy bacillus. Protein identity for the secondary structures is shown in Fig. 9. Given how well conserved these proteins are, we propose that they play roles in the other pathogenic mycobacteria similar to those in MAC.
Fig 8.

Predicted protein secondary structure of the putative efflux pump encoded by MAV_3306 and its orthologs. Each red arrow represents an α-helix, while each blue arrow represents a β-strand. Highly conserved residues are shown in blue, while relatively conserved residues are shown in black. The degree of similarity among all proteins is represented by the bar diagram below the consensus sequence.
Fig 9.

Predicted protein secondary structure of the putative efflux pump encoded by MAV_1406 and its orthologs. Each red arrow represents an α-helix, while each blue arrow represents a β-strand. Highly conserved residues are shown in blue, while relatively conserved residues are shown in black. The degree of similarity among all proteins is represented by the bar diagram below the consensus sequence.
DISCUSSION
There are several important findings in the current paper. First, we show that resistance emergence in MAC is actually a process and not a single event (Fig. 7). Based on work elsewhere, we have proposed that chronic subtherapeutic antibiotic PK/PD exposures, especially from unanticipated pharmacokinetic variability, are an important proximate cause (42, 46). Very soon after the commencement of subtherapeutic exposures, within very few bacillary replication cycles, there was induction of genes that encode two efflux pumps. These genes demonstrated 56-fold induction, an unusually high degree of induction. The induction is not due to the immune system or macrophages and, unlike standard antibiotic tolerance, is not due to environmental changes but is specifically in response to subtherapeutic antibiotic stress (e.g., 1/2 the azithromycin MIC); controls under the same conditions but with no azithromycin exposure demonstrated no induction. Phenotypically drug-resistant bacteria exhibiting low-level drug resistance (i.e., to 3× MIC but not to 256 mg/liter azithromycin) were encountered a few days later. This low-level resistance was reversed by efflux pump inhibitors. We emphasize that although it is reversible, this is the first step in acquiring higher-level resistance and is in direct response to subtherapeutic drug exposures. We speculate that the bacteria are similar to those observed by Kevin Nash, who described MAC “progenitors [that] appear to be in an unstable or transient state, i.e., the bacilli do not appear to be committed to the acquisition of resistance, although they are specific for the acquisition of [clarithromycin] resistance” (39). Bacterial DNA replication of course accompanies bacterial division, so as bacteria divide again and again under the protection of efflux pumps, the chances of chromosomal mutations increase as part of a stochastic process. Eventually, as the mycobacteria continue replicating under subtherapeutic concentrations, higher-level resistance is encountered. Some mutations impose biofitness costs, and those isolates perish; however, a subset that has mutations that do not impose biofitness costs that are lethal but still confer high-level resistance would then be selected. This is in essence a resistance process within the path of the “arrow of time.” In this model, efflux pumps and the higher levels of resistance due to chromosomal mutations are not in fact different mechanisms, but rather, different ordered molecular events in a single process (i.e., the middle and end of the same arrow). The model we propose for mycobacteria is reminiscent of that of fluoroquinolones in S. pneumoniae (26, 30).
Second, we demonstrated that there are specific genes that encode efflux pumps associated with macrolide resistance in mycobacteria. MAV_3306 encodes a 545-amino-acid ABC transporter whose inferred secondary structure is shown in Fig. 8. This protein is highly conserved in other pathogenic mycobacteria, notably MTC Rv1473 (0.910 identity), M. marinum MMAR_2279 (0.932 identity), and M. ulcerans MUL_1481 (0.928 identity). We demonstrated that genes for this transporter are induced in a stepwise manner over 3 days, with a sigmoid shape, which suggests a saturable recruitment process over several days. MAV_1406 encodes a 405-amino-acid MFS transporter, whose inferred secondary structure is shown in Fig. 9. This, too, is highly conserved in many pathogenic mycobacteria, as shown in Fig. 9. The MFS pump's MTC ortholog, Rv1258c, has been inhibited by reserpine in the past (43). Similarly, the efflux pump inhibitor reserpine led to reduced resistance to both tetracycline and erythromycin in M. ulcerans (50). The pattern of induction of MAV_1406 suggests a more abrupt process taking place between 1 and 24 h, at which point it had reached maximum induction with no further increase, mathematically a Heaviside step function. The efflux pump proteins are highly conserved in pathogenic mycobacteria, even at the protein secondary-structure level, strongly suggesting that they could have the same function in these numerous pathogenic mycobacteria. The pathway we propose presents an excellent opportunity for early intervention during therapy with efflux pump inhibitors to forestall drug resistance emergence.
Our third finding is that the PK/PD parameter associated with both microbial kill and the resistance process was the AUC/MIC ratio. This suggests that the process can be overcome by increasing drug doses (the AUC is proportional to the dose/clearance). On the other hand, it is interesting that most in vitro PK/PD studies in the past erroneously led to the conclusion that the macrolide microbial kill was linked to the percentage of time the concentration remains above the MIC, while clinical studies demonstrated AUC/MIC kill for bacteria such as S. pneumoniae, Haemophilus influenzae, and Moraxella catarrhalis (3). Part of the failure of standard in vitro PK/PD models, and even some in vivo models, such as the mouse thigh model, may have to do with the high concentrations of azithromycin achieved within white blood cells, such as macrophages, and at the infection site as opposed to what is encountered in serum or the extracellular milieu (14). The HFS model of disseminated MAC disease overcomes that limitation. Our study provides further insight into this high concentration achieved in macrophages, which is a better predictor of effect than extracellular drug concentrations. Within macrophages, azithromycin pharmacokinetics were best described by a two-compartment model. This suggests that within such cells, azithromycin is concentrated in some organelles, consistent with the known accumulation and slow release of the drug in lysosomes.
In summary, we report that intracellular mycobacteria survive high concentrations of azithromycin due in part to the expression of efflux pumps. We identify two putative pumps that are induced early in therapy, which are followed by the appearance of low-level-resistance phenotypes. Over several weeks, high-level resistance develops, which is less amenable to inhibition by efflux pump inhibitors.
ACKNOWLEDGMENTS
The study was funded by National Institute of General Medical Sciences of the National Institutes of Health New Innovator Award DP2 OD001886-01 and the National Institute of Allergy and Infectious Diseases R01AI079497.
Footnotes
Published ahead of print 2 July 2012
REFERENCES
- 1. Ainsa JA, et al. 1998. Molecular cloning and characterization of Tap, a putative multidrug efflux pump present in Mycobacterium fortuitum and Mycobacterium tuberculosis. J. Bacteriol. 180:5836–5843 [DOI] [PMC free article] [PubMed] [Google Scholar]
- 2. Akaike H. 1974. A new look at the statistical model identification. IEEE Trans. Automated Control 19:716–723 [Google Scholar]
- 3. Ambrose PG, et al. 2007. Pharmacokinetics-pharmacodynamics of antimicrobial therapy: it's not just for mice anymore. Clin. Infect. Dis. 44:79–86 [DOI] [PubMed] [Google Scholar]
- 4. Benson CA, et al. 2003. A prospective, randomized trial examining the efficacy and safety of clarithromycin in combination with ethambutol, rifabutin, or both for the treatment of disseminated Mycobacterium avium complex disease in persons with acquired immunodeficiency syndrome. Clin. Infect. Dis. 37:1234–1243 [DOI] [PubMed] [Google Scholar]
- 5. Blaser J, Stone BB, Zinner SH. 1985. Two compartment kinetic model with multiple artificial capillary units. J. Antimicrob. Chemother. 15(Suppl A):131–137 [DOI] [PubMed] [Google Scholar]
- 6. Canetti G, et al. 1963. Mycobacteria: laboratory methods for testing drug sensitivity and resistance. Bull. World Health Organ. 29:565–578 [PMC free article] [PubMed] [Google Scholar]
- 7. Clinical and Laboratory Standards Institute 2003. Susceptibility testing of Mycobacteria, Nocardiae, and other aerobic Actinomycetes; approved standard. Clinical and Laboratory Standards Institute, Wayne, PA: [PubMed] [Google Scholar]
- 8. D'Argenio DZ, Schumitzky A, Wang X. 2009. ADAPT 5 user's guide: pharmacokinetic/pharmacodynamic systems analysis software. Biomedical Simulations Resource, Los Angeles, CA [Google Scholar]
- 9. Del Grosso M, et al. 2002. Macrolide efflux genes mef(A) and mef(E) are carried by different genetic elements in Streptococcus pneumoniae. J. Clin. Microbiol. 40:774–778 [DOI] [PMC free article] [PubMed] [Google Scholar]
- 10. Del Grosso GM, Scotto DA, Iannelli F, Pozzi G, Pantosti A. 2004. Tn2009, a Tn916-like element containing mef(E) in Streptococcus pneumoniae. Antimicrob. Agents Chemother. 48:2037–2042 [DOI] [PMC free article] [PubMed] [Google Scholar]
- 11. Deshpande D, Gumbo T. 2011. Pharmacokinetic/pharmacodynamic-based treatment of disseminated Mycobacterium avium. Future Microbiol. 6:433–439 [DOI] [PubMed] [Google Scholar]
- 12. Deshpande D, Srivastava S, Meek C, Leff R, Gumbo T. 2010. Ethambutol optimal clinical dose and susceptibility breakpoint identification by use of a novel pharmacokinetic-pharmacodynamic model of disseminated intracellular Mycobacterium avium. Antimicrob. Agents Chemother. 54:1728–1733 [DOI] [PMC free article] [PubMed] [Google Scholar]
- 13. Deshpande D, et al. 2010. Moxifloxacin Pharmacokinetics/pharmacodynamics and optimal dose and susceptibility breakpoint identification for treatment of disseminated Mycobacterium avium infection. Antimicrob. Agents Chemother. 54:2534–2539 [DOI] [PMC free article] [PubMed] [Google Scholar]
- 14. Drusano GL. 2005. Infection site concentrations: their therapeutic importance and the macrolide and macrolide-like class of antibiotics. Pharmacotherapy 25:150S–158S [DOI] [PubMed] [Google Scholar]
- 15. Dunne M, et al. 2000. A randomized, double-blind trial comparing azithromycin and clarithromycin in the treatment of disseminated Mycobacterium avium infection in patients with human immunodeficiency virus. Clin. Infect. Dis. 31:1245–1252 [DOI] [PubMed] [Google Scholar]
- 16. Eum SY, et al. 2010. Neutrophils are the predominant infected phagocytic cells in the airways of patients with active pulmonary TB. Chest 137:122–128 [DOI] [PMC free article] [PubMed] [Google Scholar]
- 17. Fernandez-Moreno MA, Carbo L, Cuesta T, Vallin C, Malpartida F. 1998. A silent ABC transporter isolated from Streptomyces rochei F20 induces multidrug resistance. J. Bacteriol. 180:4017–4023 [DOI] [PMC free article] [PubMed] [Google Scholar]
- 18. Gay K, Stephens DS. 2001. Structure and dissemination of a chromosomal insertion element encoding macrolide efflux in Streptococcus pneumoniae. J. Infect. Dis. 184:56–65 [DOI] [PubMed] [Google Scholar]
- 19. Gillespie SH. 2002. Evolution of drug resistance in Mycobacterium tuberculosis: clinical and molecular perspective. Antimicrob. Agents Chemother. 46:267–274 [DOI] [PMC free article] [PubMed] [Google Scholar]
- 20. Gordin FM, et al. 1999. A randomized, placebo-controlled study of rifabutin added to a regimen of clarithromycin and ethambutol for treatment of disseminated infection with Mycobacterium avium complex. Clin. Infect. Dis. 28:1080–1085 [DOI] [PubMed] [Google Scholar]
- 21. Gumbo T. 2010. Chemotherapy of tuberculosis, Mycobacterium avium complex disease, and leprosy, p 1549–1570 In Brunton LL, Chabner B, Knollmann B. (ed), Goodman & Gilman's the pharmacological basis of therapeutics, 12th ed McGraw Hill Medical, New York, NY [Google Scholar]
- 22. Gumbo T, et al. 2004. Selection of a moxifloxacin dose that suppresses drug resistance in Mycobacterium tuberculosis, by use of an in vitro pharmacodynamic infection model and mathematical modeling. J. Infect. Dis. 190:1642–1651 [DOI] [PubMed] [Google Scholar]
- 23. Gumbo T, Siyambalapitiyage Dona CS, Meek C, Leff R. 2009. Pharmacokinetics-pharmacodynamics of pyrazinamide in a novel in vitro model of tuberculosis for sterilizing effect: a paradigm for faster assessment of new antituberculosis drugs. Antimicrob. Agents Chemother. 53:3197–3204 [DOI] [PMC free article] [PubMed] [Google Scholar]
- 24. Haas S, Scully B, Cohen D, Radhakrishnan J. 2005. Mycobacterium avium complex infection in kidney transplant patients. Transpl. Infect. Dis. 7:75–79 [DOI] [PubMed] [Google Scholar]
- 25. Han XY, Tarrand JJ, Infante R, Jacobson KL, Truong M. 2005. Clinical significance and epidemiologic analyses of Mycobacterium avium and Mycobacterium intracellulare among patients without AIDS. J. Clin. Microbiol. 43:4407–4412 [DOI] [PMC free article] [PubMed] [Google Scholar]
- 26. Jumbe NL, et al. 2006. Quinolone efflux pumps play a central role in emergence of fluoroquinolone resistance in Streptococcus pneumoniae. Antimicrob. Agents Chemother. 50:310–317 [DOI] [PMC free article] [PubMed] [Google Scholar]
- 27. Kaplan JE, et al. 2009. Guidelines for prevention and treatment of opportunistic infections in HIV-infected adults and adolescents: recommendations from CDC, the National Institutes of Health, and the HIV Medicine Association of the Infectious Diseases Society of America. MMWR Recomm. Rep. 58:1–207 [PubMed] [Google Scholar]
- 28. Lee L-F, Chen CW. 1998. Multidrug resistant genes in Streptomyces. Actinomycetologica 12:148–152 [Google Scholar]
- 29. Liu P, et al. 2007. Comparative pharmacokinetics of azithromycin in serum and white blood cells of healthy subjects receiving a single-dose extended-release regimen versus a 3-day immediate-release regimen. Antimicrob. Agents Chemother. 51:103–109 [DOI] [PMC free article] [PubMed] [Google Scholar]
- 30. Louie A, et al. 2007. In vitro infection model characterizing the effect of efflux pump inhibition on prevention of resistance to levofloxacin and ciprofloxacin in Streptococcus pneumoniae. Antimicrob. Agents Chemother. 51:3988–4000 [DOI] [PMC free article] [PubMed] [Google Scholar]
- 31. Louw GE, et al. 2011. Rifampicin reduces susceptibility to ofloxacin in rifampicin-resistant Mycobacterium tuberculosis through efflux. Am. J. Respir. Crit. Care Med. 184:269–276 [DOI] [PMC free article] [PubMed] [Google Scholar]
- 32. Louw GE, et al. 2009. A balancing act: efflux/influx in mycobacterial drug resistance. Antimicrob. Agents Chemother. 53:3181–3189 [DOI] [PMC free article] [PubMed] [Google Scholar]
- 33. Luke DR, Foulds G, Cohen SF, Levy B. 1996. Safety, toleration, and pharmacokinetics of intravenous azithromycin. Antimicrob. Agents Chemother. 40:2577–2581 [DOI] [PMC free article] [PubMed] [Google Scholar]
- 34. McMurry L, Petrucci RE, Jr, Levy SB. 1980. Active efflux of tetracycline encoded by four genetically different tetracycline resistance determinants in Escherichia coli. Proc. Natl. Acad. Sci. U. S. A. 77:3974–3977 [DOI] [PMC free article] [PubMed] [Google Scholar]
- 35. Meier A, et al. 1996. Molecular mechanisms of clarithromycin resistance in Mycobacterium avium: observation of multiple 23S rDNA mutations in a clonal population. J. Infect. Dis. 174:354–360 [DOI] [PubMed] [Google Scholar]
- 36. Meier A, et al. 1994. Identification of mutations in 23S rRNA gene of clarithromycin-resistant Mycobacterium intracellulare. Antimicrob. Agents Chemother. 38:381–384 [DOI] [PMC free article] [PubMed] [Google Scholar]
- 37. Mitchison DA. 1998. How drug resistance emerges as a result of poor compliance during short course chemotherapy for tuberculosis. Int. J. Tuberc. Lung Dis. 2:10–15 [PubMed] [Google Scholar]
- 38. Naser SA, Ghobrial G, Romero C, Valentine JF. 2004. Culture of Mycobacterium avium subspecies paratuberculosis from the blood of patients with Crohn's disease. Lancet 364:1039–1044 [DOI] [PubMed] [Google Scholar]
- 39. Nash KA. 2001. Effect of drug concentration on emergence of macrolide resistance in Mycobacterium avium. Antimicrob. Agents Chemother. 45:1607–1614 [DOI] [PMC free article] [PubMed] [Google Scholar]
- 40. Nash KA, Inderlied CB. 1995. Genetic basis of macrolide resistance in Mycobacterium avium isolated from patients with disseminated disease. Antimicrob. Agents Chemother. 39:2625–2630 [DOI] [PMC free article] [PubMed] [Google Scholar]
- 41. Pasipanodya JG, Gumbo T. 2011. A new evolutionary and pharmacokinetic-pharmacodynamic scenario for rapid emergence of resistance to single and multiple anti-tuberculosis drugs. Curr. Opin. Pharmacol. 11:457–463 [DOI] [PMC free article] [PubMed] [Google Scholar]
- 42. Pasipanodya JG, Srivastava S, Gumbo T. 2012. Meta-analysis of clinical studies supports the pharmacokinetic variability hypothesis for acquired drug resistance and failure of anti-tuberculosis therapy. Clin. Infect. Dis. 55:169–177 [DOI] [PMC free article] [PubMed] [Google Scholar]
- 43. Ramon-Garcia S, Martin C, Ainsa JA, De RE. 2006. Characterization of tetracycline resistance mediated by the efflux pump Tap from Mycobacterium fortuitum. J. Antimicrob. Chemother. 57:252–259 [DOI] [PubMed] [Google Scholar]
- 44. Santagati M, Iannelli F, Oggioni MR, Stefani S, Pozzi G. 2000. Characterization of a genetic element carrying the macrolide efflux gene mef(A) in Streptococcus pneumoniae. Antimicrob. Agents Chemother. 44:2585–2587 [DOI] [PMC free article] [PubMed] [Google Scholar]
- 45. Srivastava S, et al. 2010. Efflux-pump-derived multiple drug resistance to ethambutol monotherapy in Mycobacterium tuberculosis and the pharmacokinetics and pharmacodynamics of ethambutol. J. Infect. Dis. 201:1225–1231 [DOI] [PMC free article] [PubMed] [Google Scholar]
- 46. Srivastava S, Pasipanodya JG, Meek C, Leff R, Gumbo T. 2011. Multidrug-resistant tuberculosis not due to noncompliance but to between-patient pharmacokinetic variability. J. Infect. Dis. 204:1951–1959 [DOI] [PMC free article] [PubMed] [Google Scholar]
- 47. Torriani FJ, Behling CA, McCutchan JA, Haubrich RH, Havlir DV. 1996. Disseminated Mycobacterium avium complex: correlation between blood and tissue burden. J. Infect. Dis. 173:942–949 [DOI] [PubMed] [Google Scholar]
- 48. Torriani FJ, McCutchan JA, Bozzette SA, Grafe MR, Havlir DV. 1994. Autopsy findings in AIDS patients with Mycobacterium avium complex bacteremia. J. Infect. Dis. 170:1601–1605 [DOI] [PubMed] [Google Scholar]
- 49. Vecchione JJ, Alexander B, Jr, Sello JK. 2009. Two distinct major facilitator superfamily drug efflux pumps mediate chloramphenicol resistance in Streptomyces coelicolor. Antimicrob. Agents Chemother. 53:4673–4677 [DOI] [PMC free article] [PubMed] [Google Scholar]
- 50. Zhang T, Bishai WR, Grosset JH, Nuermberger EL. 2010. Rapid assessment of antibacterial activity against Mycobacterium ulcerans by using recombinant luminescent strains. Antimicrob. Agents Chemother. 54:2806–2813 [DOI] [PMC free article] [PubMed] [Google Scholar]