

Abstract
Background:
Previous studies in diverse ethnic groups have reported that progressive resistance training is effective for glycemic control. However, it is unknown whether this form of exercise therapy leads to clinically meaningful changes in metabolic, cardiovascular and anthropometric parameters in Asian Indians.
Aim:
The study was designed to investigate the efficacy of progressive resistance training on glycemic, musculoskeletal, anthropometric and cardiovascular variables in untrained middle-aged type 2 diabetic patients living in North India.
Materials and Methods:
Forty-eight untrained patients, 35 men and 13 women (mean ± SD age, 44.7 ± 4.2 years), with a diagnosis of type 2 diabetes were randomly divided into 2 groups: A group receiving progressive resistance training and a control group who provided participative involvement. The primary outcomes were glycemic control and muscle strength. Additionally, anthropometric and cardiovascular risk parameters were evaluated at baseline and after intervention or control program at 8 weeks.
Results:
Mixed ANOVA revealed a significant group-by-time interaction for the main outcomes of the study. Change in glycosylated hemoglobin was mean ± SD, 0.6 ± 0.5 in progressive resistance training group compared to no change in control group (P < .001). Progressive resistance training group showed a greater improvement in upper and lower body muscle strength (P < .001), waist circumference (P = .008), and high density lipoprotein cholesterol (P = .004). However, no significant group-by-time interaction was detected on body weight, total cholesterol, triglycerides, low density lipoprotein cholesterol, and systolic and diastolic blood pressure.
Conclusions:
A short-term progressive resistance training program leads to clinically meaningful improvements in glycemic control and muscle strength in untrained middle-aged type 2 diabetic patients of Asian Indian ethnicity.
Keywords: Type 2 diabetes, Progressive resistance training, Glycemic control, Muscle strength, Asian Indian
Introduction
Type 2 diabetes (T2D) has become a growing public health problem across the world with an increasing prevalence most noticeable in developing countries.[1] World Health Organization estimates showed that India currently has the world's largest diabetic population, with 32 million diabetic subjects in the year 2000 and which would increase to 80 million by the year 2030.[2] Asian Indians are said to have unique clinical and biochemical abnormalities such as greater waist circumference, waist hip ratio and more visceral fat.[3] All these abnormalities lead to greater insulin resistance,[4] predisposing to the development of T2D.
Glycosylated hemoglobin (HbA1c) is considered an excellent measure of glycemic control over the previous 2- to 3-month period in T2D subjects. It has been reported that HbA1c decrease of 1% is associated with 18% decrease in cardiovascular risk,[5] and a 37% reduction in microvascular complications[6] associated with T2D. An additional complication of T2D, especially important to Asian Indians is reduced muscular strength. Evidence indicates that people with T2D have less muscular strength than people without T2D.[7] This decline in muscle strength is shown to be associated with risk of physical function loss.[8] It has been suggested that interventions that increase muscle strength and muscle mass may improve glycemic control and insulin resistance as skeletal muscle represents the largest mass of insulin-sensitive tissue.[9,10]
Exercise, a subset of physical activity has been recognized universally as an important component of clinical management of individuals with T2D. Researches on aerobic training (Walking, cycling, jogging, etc.) have shown consistent findings of improved glucose control.[11] However, most forms of aerobic training can be challenging for many people with diabetes, such as people with significant obesity, very low levels of aerobic fitness, or elderly patients with sarcopenia, severe arthritis, or both. For others, aerobic exercise may be contraindicated because of the presence of diabetic complications, such as cardiovascular disease or advanced peripheral neuropathy.[12]
An alternative form of exercise, the resistance training has been shown to be equally effective for glycemic control in Asian population.[13] Progressive resistance training (PRT) has added advantages in terms of increasing the muscle strength. A recent systematic review[14] has also summarized that PRT leads to clinically significant reductions in glycemic level. Furthermore, this systematic review provides evidence that progressive resistance exercise can be effective when performed only three times a week and that compliance rates are high with 87% of scheduled sessions attended.[14]
Resistance training has been the focus of increased research in recent years in western T2D population, but there have been very few studies in Asian Indian population. Misra et al.[15] reported improved insulin sensitivity and reduced HbA1c levels in Asian Indian T2D subjects treated with PRT. However, they have conducted a pre-experimental study without a control or a comparison group, as opposed to randomized trial. Moreover, considering the reports that the majority of T2D patients in developing countries are between 45 and 65 years[16] and Asian Indians develop T2D at a relatively younger age, it is important that studies of exercise training be conducted on untrained middle-aged Asian Indians with T2D.
Hence, the purpose of the current study was to determine the efficacy of PRT on glycemic, musculoskeletal, metabolic, anthropometric and cardiovascular variables in untrained middle-aged T2D patients living in North India.
Materials and Methods
All participants received a complete explanation regarding the purpose and procedures of the study and regarding possible risks, before baseline measurement. They were also requested to sign an informed consent document. The study was approved by the human institutional ethics committee at the Department of Biosciences, Faculty of Natural Sciences of Jamia Millia Islamia, New Delhi.
Setting and participants
All participants recruited in to the study were diabetic patients attending the medical and physical therapy outpatient clinics located in Jamia Millia Islamia University campus, New Delhi. Clients were screened for study eligibility by a primary care physician, and those meeting the eligibility criteria were approached for consent to take part in the study. Subjects were included if they were aged between 35 and 55, had HbA1c levels between 6.6% and 9.9% in the past month, fasting plasma glucose level of >126 mg/dL, were previously inactive (defined as no strength training and <150 min of brisk walking/moderate exercise per week and <60 min of vigorous exercise per week in the preceding 6 months), and if they were diagnosed with T2D for more than 6 months. Exclusion criteria for the subjects were: individuals with heart disease, current insulin therapy, uncontrolled hypertension (blood pressure greater than 160/95 mm Hg), orthopedic problems during 6 months prior to study, nervous system disorders, proliferative retinopathy, myopathy, neurologic insult that resulted in mobility impairment and rheumatological disease that affected mobility. Subjects who consented to participate in the study were examined by a physician, according to the recommendations in American Heart Association scientific statement,[17] and were medically cleared for strength testing and exercise training.
Sample size was calculated on a between-group HbA1c difference of 0.5%. The 0.5% difference was adopted as clinically worthwhile because any reduction in HbA1c may lead to reduction of cardiovascular disease risk in patients with T2D.[5] The calculation was also based on an anticipated standard deviation effect of 0.56%; an alpha level of 0.05; and a desired power of 80%. A sample size of at least 20 patients per group was generated with the said parameters. Assuming possible dropouts, a total of 48 participants were recruited, 24 in the control group and 24 in the experimental group.
Outcome measures
The primary outcomes of the current study were 1) glycemic control measured as HbA1c and 2) muscle strength measured as 1-repetition maximum bench press (1-RM BP) and 1-repetition maximum leg press (1-RM LP). Secondary outcomes included 1) anthropometry measured with body weight and waist circumference (WC), 2) cardiovascular risk factors measured as total cholesterol (TC), triglycerides (TG), HDL-cholesterol (HDL-C), LDL-cholesterol (LDL-C), systolic blood pressure (SBP) and diastolic blood pressure (DBP).
Biochemistry
Blood samples were obtained from each participant's antecubital vein after an overnight fast for the determination of HbA1c and lipids. All samples were collected at least 48 hours post-exercise. HbA1c was measured by using fast ion exchange resin separation method.[18] TC, HDL-C and TG levels were measured by using enzymatic methods on a chemistry analyzer (ERBA Diagnostics, Mannheim GmbH, Mannheim/Germany). LDL-C levels were calculated by using the Friedewald equation.[19]
Muscular strength measurement
Muscle strength was measured for both upper (1-RM BP) and lower (1-RM LP) body musculature, using bench press and leg press machines (Body-Solid, Inc., IL, USA). Initially, the subject performed a warm up familiarization (practice) set of 10 repetitions with a weight selected by a physical therapist. Actual testing started with a general warm up for 3 minutes followed by static stretching exercises. Next, the subject was instructed to perform a set of no more than 9 repetitions with a slightly greater weight. If the subject was able to perform a set of more than 9 repetitions, the resistance was progressively increased until the subjects could perform only 9 or fewer repetitions of each exercise. Two minutes of rest period was allowed between each attempt, and 3 minutes of rest was allowed between each specific exercise. Estimation of 1 RM was done using Brzycki 1-RM prediction equation,[20] based on the resistance and repetitions recorded.
Body weight and waist circumference
Body weight was measured to the nearest 0.2 kg. Waist circumference was measured using a non-elastic tape measure, and measurement was made with the abdominal muscles relaxed, at the end of normal expiration. Measurements were made horizontally around the waist, at a point midway between the superior border of the ilium and the inferior border of the lateral margin of the ribs (costal margin). Waist measurements were taken three times to the nearest 1 mm, and an average of the three readings was noted.
Blood pressure
SBP and DBP were measured by the auscultatory method with the use of a stethoscope and a sphygmomanometer (LifecareTM sphygmomanometer, N & B Medical Products Co., India). An inflatable cuff was placed around the upper left arm, at the same vertical height as the heart. Measurement was made after the participant had rested in a seated position for 15 minutes. Three separate readings were taken at one-minute intervals, and the mean of the three readings was recorded. All blood pressure measurements were performed at least 24 hours post-exercise.
Study protocol
Following the baseline examination, patients were randomly assigned to 2 groups using a table of random numbers generated online (www.randomization.com) to receive A) PRT or B) Control. Participants in the PRT group attended the fitness center either 3 days or 2 days per week according to their exercise frequency preference, for 8 weeks and control group attended the fitness center three times a week, for 8 weeks. All outcome measures were acquired at baseline and after training at 8 weeks.
PRT program
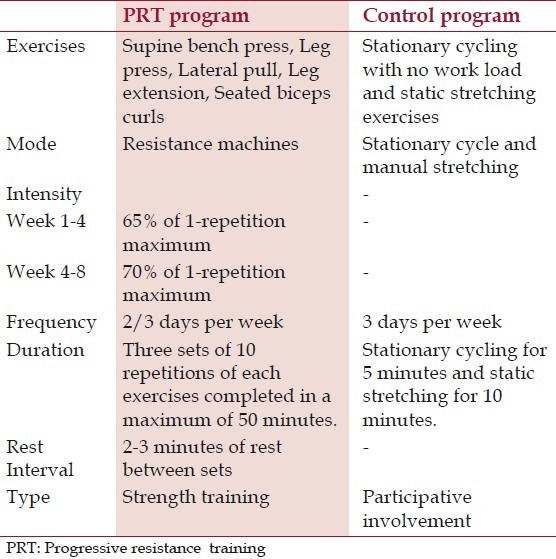
The PRT group followed an individually monitored PRT program using weight machines (Body-Solid, Inc., IL, USA). Subjects in the PRT group undertook five resistive exercises at 65% of their 1-RM initially, as recommended by American College of Sports Medicine. Exercises were progressed after 4 weeks of training to 70% of their predicted mid study 1-RM [Table 1]. Three repetitions of low load prolonged stretches for exercising muscles and walking in the treadmill on self-selected pace for 10 minutes were administered as warm-up activities.
Table 1.
Details of progressive resistance exercise interventions and control program
Prior to each session, subject's blood pressure and glucose levels were assessed and recorded in individual exercise log sheet. Standard sphygmomanometer was used for BP measurement and Accu-Chek active blood glucose meter (Accu-Chek Extra Care, Roche Diagnostics India Pvt. Ltd, Mumbai, India) was used for the measurement of glucose levels prior to exercise session. A pre-exercise blood pressure of less than or equal to 140/90 mm Hg was required for the subjects to begin exercise. If subjects arrived with a blood glucose level of less than or equal to 100 mg/dL or greater than 300 mg/dL, appropriate adjustments were made by monitoring and controlling their blood glucose level to ensure safety.
Control program
The control program consisted of stationary cycling with no workload for 5 min, followed by a series of static stretching exercises (approx 10 min) [Table 1]. These exercises (flexibility training) provide participative involvement but not elicit change in glycemic control, muscle strength or cardiovascular fitness.[11,14]
Statistical analysis
Statistical analysis was conducted with SPSS Version 16.0 (SPSS Inc, Chicago, IL). Mean, standard deviation and 95% confidence intervals for each outcome measure were calculated. Baseline characteristics and scores on the primary outcomes and secondary outcomes were compared between groups using independent t tests for continuous data and χ2 tests of independence for categorical data. For all outcome variables, intention-to-treat analysis was used, with the baseline outcome carried forward for seven patients who dropped out from the study. Separate 2×2 mixed-model ANOVAs, with time (pre-test, post-test) as a within-subject factor and group (PRT, Control) as a between-subject factor, was used to examine the effects of interventions on primary and secondary outcomes. The hypothesis of interest was the group-by-time interaction at an alpha level of .05 (two-sided). P values lower than .05 were considered statistically significant for all analyses.
Results
Baseline subject characteristics, compliance and adverse events
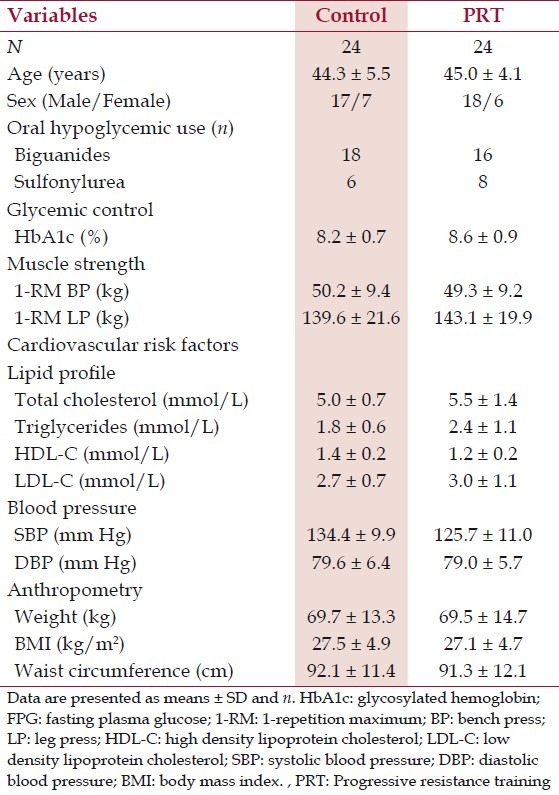
Forty-eight subjects (mean ± SD age, 44.7 ± 4.2 years) were randomized, with 24 being allocated to each group (PRT and control groups). Flow of participants through the study is summarized in Figure 1. Forty-one (85%) participants completed all the exercise sessions and post-test at eighth week. Seven participants (Four in the control group and three in PRT group) failed to attend all exercise sessions and post test measurements. No major complications or injuries occurred during the trial period, other than transient muscle soreness. Both control and PRT groups were similar in all parameters before training, except systolic blood pressure and triglyceride levels. No changes in medication were prescribed for the study participants during the study period. The baseline features of the subjects are presented in Table 2.
Figure 1.
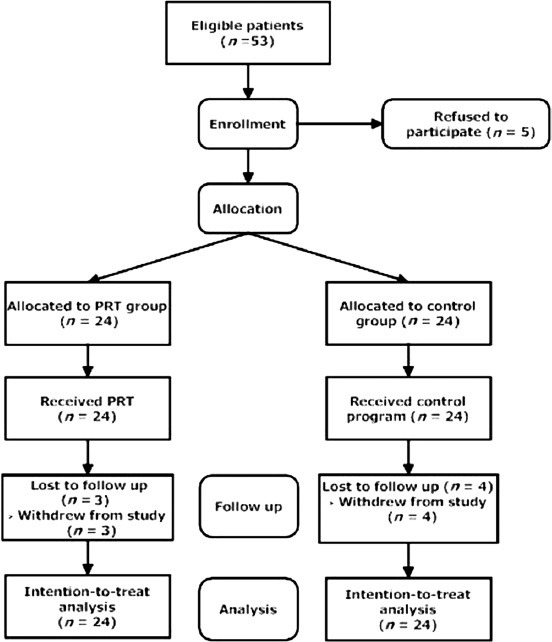
Flow chart describing progress of participants through the study.
Table 2.
Demographics, glycemic control, muscle strength, cardiovascular risk factors and anthropometric data at the study entry
Glycemic control and muscle strength
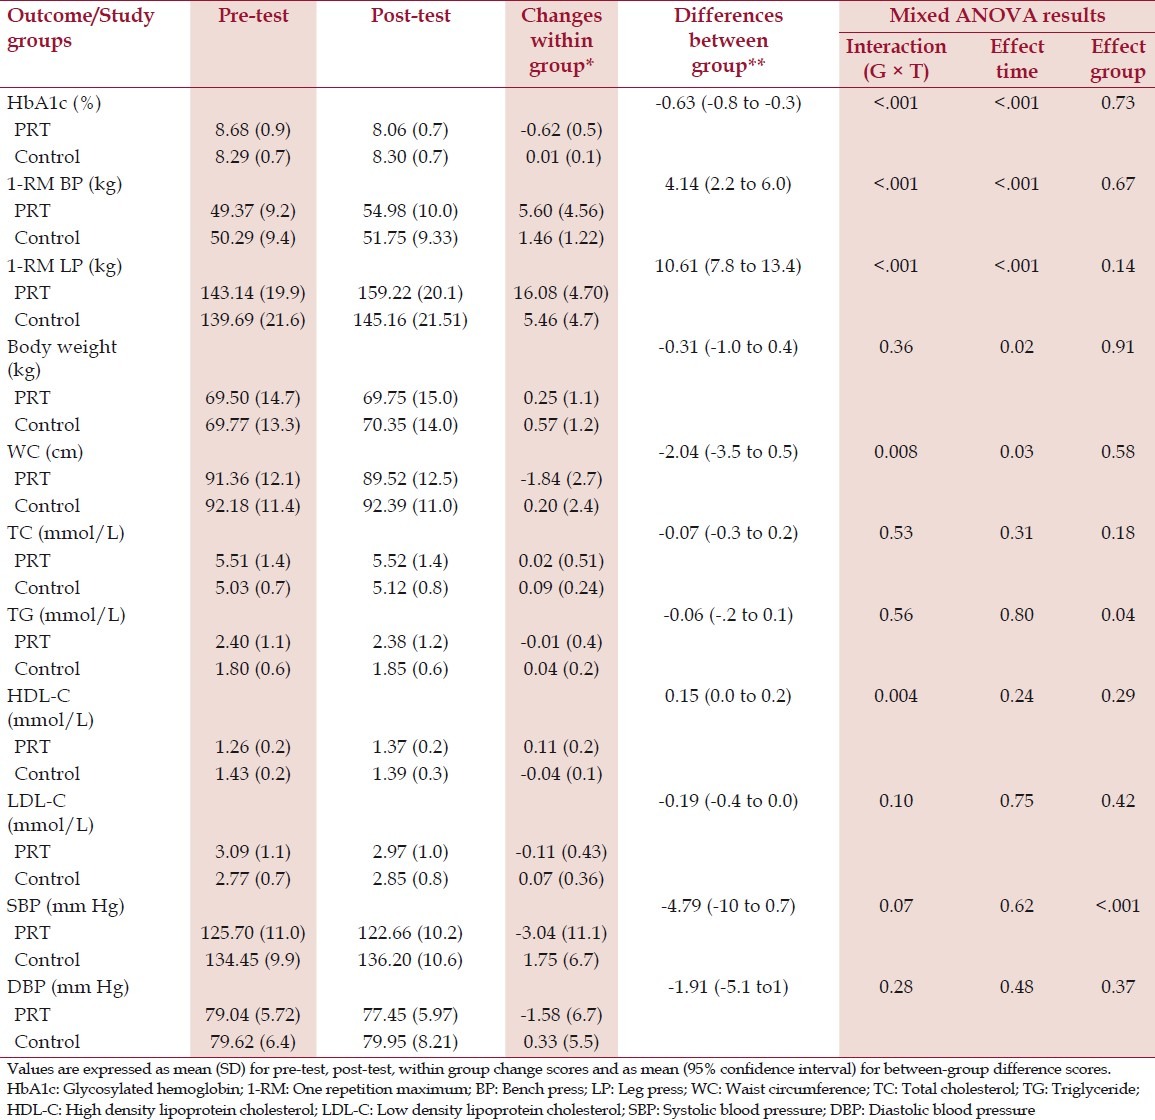
The group-by-time (G × T) interaction for the 2×2 mixed-model ANOVA was statistically significant for HbA1c (F = 34.457, P < .001). Glycemic control was greater in patients receiving PRT compared to control. The change in HbA1c was 0.6 ± 0.5% in PRT group compared to control group, where there was no change. Results of upper and lower body muscle strength showed significant G × T interaction. 1-RM bench press change in PRT group was 5.6 kg compared to 1.4 kg change in the control group (F = 18.453, P < .001). 1-RM leg press increased by 16 kg in the PRT group and by 5.4 kg in the control group (F = 60.128, P < .001). There were significant time effects for all the primary outcomes, indicating that both groups combined improved in these outcomes overtime. No significant group effects were detected for glycemic control and muscle strength measures [Table 3].
Table 3.
Pre-test, post-test, change scores and mixed ANOVA results of primary and secondary outcomes
Secondary outcomes
The mixed ANOVA results revealed significant G × T interaction for changes in WC (F = 7.585, P = .008) and HDL-C (F = 9.169, P = .004). PRT group reduced 1.84 ± 2.7 cm in WC compared to a 0.2 ± 2.4 cm increase in control subjects. HDL-C was increased by 0.11 ± 0.2 mmol/L in PRT group and reduced by 0.04 ± 0.1 in the control group. The between-group differences in the change in these parameters favored the PRT group. There were no significant time effects detected for six out of eight secondary outcomes (TC, TG, HDL-C, LDL-C, SBP and DBP), indicating that both groups maintained these outcomes over the intervention period. Significant group effects were detected only for TG levels and SBP [Table 3].
Correlations between changes in outcomes
Pearson correlations confirmed the association between change in HbA1c and changes in waist circumference and muscular strength. In the entire cohort of subjects, HbA1c reduction after training was positively associated with changes in waist circumference (r = 0.353, P = 0.007). Furthermore, change in HbA1c was negatively associated with the increases in 1-RMBP (r = -0.630, P = 0.000) and 1-RMLP (r = -0.618, P = 0.000).
Discussion
In the current study, we sought to evaluate the efficacy of a PRT program primarily on glycemic control and muscle strength. The results have shown that PRT appears to provide better glycemic control and substantial improvements in muscle strength in untrained middle-aged type 2 diabetics with an Asian Indian ethnicity, compared to a control program. Among secondary outcomes, WC showed a greater reduction with PRT and this was associated with an increase in HDL-C levels. However, other secondary outcomes did not show any G × T interaction and were maintained over the intervention period.
It is suggested that several factors may contribute to the improvement in glycemic control seen with resistance exercise training programs: (1) Increases in muscle mass, which provide a larger reservoir for glucose disposal; (2) Direct effects on skeletal muscle that increase glucose transport activity; and (3) Improvements secondary to a loss of adipose tissue (in particular, visceral adipose tissue, which is known to be a contributor to insulin resistance).
The observed reductions in HbA1c levels in the PRT group in this study may have resulted from mechanisms involving increasing levels of muscle GLUT4, insulin receptors, protein kinase B, glycogen synthase and glycogen synthase total activity following PRT. Previous research has found that strength training for 30 minutes three times per week increases insulin action in skeletal muscle by the said mechanisms.[21] Upper body and lower body muscular strength gains in the PRT group may have led to increased insulin action in skeletal muscle, an effect that may be attributed to qualitative muscular adaptations to resistance training.
The lack of any improvements observed in most of the secondary outcomes such as TC, TG, LDL-C, blood pressure and body composition in PRT group can be explained by the reduced duration of active muscle contraction in PRT sessions. PRT involves isolated brief activity of single muscle groups and the anaerobic metabolism involved necessitates rest periods between sets, hence, reducing the overall duration of active muscle contraction. This limitation could be overcome with aerobic training, where continuous activity of many large muscle groups is involved, thereby increasing the duration of active exercise. This could be the reason of improvements in the said outcomes observed in previous aerobic training trials. Our findings on the reduced HbA1c levels suggest that reduced duration of active exercise was not a factor determining glycemic control. This is supported by the findings from previous research[22] where effects of aerobic, resistance and combination of both were evaluated on glycemic control. They observed similar changes in glycemic control in both resistance and aerobic training groups, irrespective of the duration of training.
Previous studies investigating the effects of PRT in T2D differ from the current study because most studies have been conducted on sedentary older adults predominantly from developed countries. The current study sample was untrained middle-aged T2D patients who are Asian Indians. It is known that Asian Indians manifest insulin resistance and T2D at a younger age and at a higher magnitude than any other ethnic groups[23,24] Second, we sought to evaluate the effects of PRT since it has been debated that resistance exercise will be metabolically more beneficial in Asian Indians.[25]
Scarcity in the literature on PRT effects in T2D, specifically in Asian Indians makes comparison of the observed results difficult. A pre-experimental research study conducted by Misra et al.[15] in Asian Indians have reported improved insulin sensitivity and reduced HbA1c and fasting blood glucose levels with PRT. HbA1c reductions of 0.54 ± 0.4% reported were comparable to 0.6 ± 0.5% in the current study. Another RCT conducted in Singaporeans reported 0.4 ± 0.6% reductions in HbA1c following PRT and 0.1% (95% CI: -0.5 to 0.3) difference when compared to aerobic training.[13] We observed 0.6% difference between experimental and control groups. These data suggest that when compared to non-exercising control group, PRT leads to clinically significant reductions in HbA1c, but not when compared to aerobic training. The study in Singaporeans used similar duration of PRT as in the present study. Muscle strength results also showed a significant increase in the PRT group when compared to control group. These results are consistent with previous studies reporting large and significant increase in muscle strength following PRT when compared with non-exercising controls.[26,27] Clinical significance of the observed increase in muscular strength is difficult to interpret, because we could not find any research on the minimal clinically important difference in muscular strength for people with T2D. Evidence suggests that loss of muscular strength is associated with loss of physical function in men with T2D.[28] The increased muscle strength found in the present study may be clinically significant, because this may lead to improved physical function.
The results also suggested that PRT resulted in a greater reduction in WC than non-exercising control group. A previous study also demonstrated a significant reduction in WC,[13] but the average reduction was 1.6 ± 2.6 cm compared to 1.84 ± 2.7 cm observed in the present study. WC has been considered as a robust predictor of abdominal visceral fat,[29] hence, it could be hypothesized that reduction in WC also lead to the changes observed in HbA1c in response to PRT. But, this greater reduction in WC was not associated with any clinically meaningful changes in cardiovascular risk factors measured in this study, except the small improvements in HDL-C levels. These findings are contradictory to the study findings of Misra et al.[15] in a similar population where there was a significant reduction in TC and TG levels in response to PRT. This may be attributed to the 12-week duration of PRT compared to the 8-week duration in our study. Furthermore, it has been reported that a reduction of 3 cm or more in WC is required for any additional benefit in metabolic profile,[30] whereas PRT group in this study only showed an average WC reduction of 1.84 cm.
The strengths of our study include the supervised and monitored exercise regimens, the good compliance to exercise programs and the absence of significant changes in medications during the protocol. The chief limitation of our study was an unequal number of men and women in the study sample. Future studies with equal gender distribution would yield more generalizable results. We measured HbA1c after 8 weeks of training; hence, the observed changes in HbA1c may not adequately reflect the effect of interventions. Future studies measuring HbA1c in response to longer exercise protocols may be considered. Since the study was of smaller duration, we have not measured the caloric intake and expenditure, hence giving lack of data on possible extraneous factors that may affect the study results. Nevertheless, clinically relevant results were obtained on the less-studied Asian Indian T2D population, giving directions for future clinical practice and research.
Conclusion
The present study demonstrated that a short-term PRT leads to clinically important improvements in glycemic control, muscle strength and reduction of WC in middle-aged T2D subjects of Asian Indian ethnicity.
Acknowledgement
This work was funded in part by University Grants Commission, Govt. of India, in the form of a fellowship to the first author. Authors wish to acknowledge the valuable cooperation of the study participants. We are grateful to the faculty members and clinical therapists of Centre for Physiotherapy and Rehabilitation Sciences, for their help, and the lab technicians at the Ansari Health Centre, Jamia Millia Islamia for providing laboratory services. We also thank the management and physical trainers of university sports complex fitness center for exercise equipments and their assistance with exercise supervision.
Footnotes
Source of Support: Nil.
Conflict of Interest: None declared.
References
- 1.Haslam DW, James WP. Obesity. Lancet. 2005;366:1197–209. doi: 10.1016/S0140-6736(05)67483-1. [DOI] [PubMed] [Google Scholar]
- 2.Wild S, Roglic G, Green A, Sicree R, King H. Global prevalence of diabetes: Estimates for the year 2000 and projections for 2030. Diabetes Care. 2004;27:1047–53. doi: 10.2337/diacare.27.5.1047. [DOI] [PubMed] [Google Scholar]
- 3.Raji A, Seely EW, Arky RA, Simonson DC. Body fat distribution and insulin resistance in healthy Asian Indians and Caucasians. J Clin Endocrinol Metab. 2001;86:5366–71. doi: 10.1210/jcem.86.11.7992. [DOI] [PubMed] [Google Scholar]
- 4.Chandalia M, Abate N, Garg A, Stray-Gundersen J, Grundy SM. Relationship between generalized and upper body obesity to insulin resistance in Asian Indian men. J Clin Endocrinol Metab. 1999;84:2329–35. doi: 10.1210/jcem.84.7.5817. [DOI] [PubMed] [Google Scholar]
- 5.Selvin E, Marinopoulos S, Berkenblit G, Rami T, Brancati FL, Powe NR, et al. Meta-analysis: Glycosylated hemoglobin and cardiovascular disease in diabetes mellitus. Ann Intern Med. 2004;141:421–31. doi: 10.7326/0003-4819-141-6-200409210-00007. [DOI] [PubMed] [Google Scholar]
- 6.Stratton IM, Adler AI, Neil HA, Matthews DR, Manley SE, Cull CA, et al. Association of glycaemia with macrovascular and microvascular complications of type 2 diabetes (UKPDS 35): Prospective observational study. BMJ. 2000;321:405–12. doi: 10.1136/bmj.321.7258.405. [DOI] [PMC free article] [PubMed] [Google Scholar]
- 7.Cetinus E, Buyukbese MA, Uzel M, Ekerbicer H, Karaoguz A. Hand grip strength in patients with type 2 diabetes mellitus. Diabetes Res Clin Pract. 2005;70:278–86. doi: 10.1016/j.diabres.2005.03.028. [DOI] [PubMed] [Google Scholar]
- 8.Brill PA, Macera CA, Davis DR, Blair SN, Gordon N. Muscular strength and physical function. Med Sci Sports Exerc. 2000;32:412–6. doi: 10.1097/00005768-200002000-00023. [DOI] [PubMed] [Google Scholar]
- 9.Ryan AS, Pratley RE, Elahi D, Goldberg AP. Changes in plasma leptin and insulin action with resistive training in postmenopausal women. Int J Obes Relat Metab Disord. 2000;24:27–32. doi: 10.1038/sj.ijo.0801080. [DOI] [PubMed] [Google Scholar]
- 10.Miller JP, Pratley RE, Goldberg AP, Gordon P, Rubin M, Treuth MS, et al. Strength training increases insulin action in healthy 50- to 65-year-old men. J Appl Physiol. 1994;77:1122–7. doi: 10.1152/jappl.1994.77.3.1122. [DOI] [PubMed] [Google Scholar]
- 11.Snowling NJ, Hopkins WG. Effects of different modes of exercise training on glucose control and risk factors for complications in type 2 diabetic patients: A meta-analysis. Diabetes Care. 2006;29:2518–27. doi: 10.2337/dc06-1317. [DOI] [PubMed] [Google Scholar]
- 12.Morrato EH, Hill JO, Wyatt HR, Ghushchyan V, Sullivan PW. Physical activity in U.S. adults with diabetes and at risk for developing diabetes, 2003. Diabetes Care. 2007;30:203–9. doi: 10.2337/dc06-1128. [DOI] [PubMed] [Google Scholar]
- 13.Ng CL, Goh SY, Malhotra R, Ostbye T, Tai ES. Minimal difference between aerobic and progressive resistance exercise on metabolic profile and fitness in older adults with diabetes mellitus: A randomised trial. J Physiother. 2010;56:163–70. doi: 10.1016/s1836-9553(10)70021-7. [DOI] [PubMed] [Google Scholar]
- 14.Irvine C, Taylor NF. Progressive resistance exercise improves glycaemic control in people with type 2 diabetes mellitus: A systematic review. Aust J Physiother. 2009;55:237–46. doi: 10.1016/s0004-9514(09)70003-0. [DOI] [PubMed] [Google Scholar]
- 15.Misra A, Alappan NK, Vikram NK, Goel K, Gupta N, Mittal K, et al. Effects of supervised progressive resistance exercise training protocol on insulin sensitivity, glycemia, lipids and body composition in Asian Indians with type 2 diabetes. Diabetes Care. 2008;31:1282–7. doi: 10.2337/dc07-2316. [DOI] [PMC free article] [PubMed] [Google Scholar]
- 16.King H, Aubert RE, Herman WH. Global burden of diabetes, 1995-2025: Prevalence, numerical estimates, and projections. Diabetes Care. 1998;21:1414–31. doi: 10.2337/diacare.21.9.1414. [DOI] [PubMed] [Google Scholar]
- 17.Marwick TH, Hordern MD, Miller T, Chyun DA, Bertoni AG, Blumenthal RS, et al. Exercise training for type 2 diabetes mellitus: Impact on cardiovascular risk.A Scientific Statement from the American Heart Association. Circulation. 2009;119:3244–62. doi: 10.1161/CIRCULATIONAHA.109.192521. [DOI] [PubMed] [Google Scholar]
- 18.Nuttall FQ. Comparison of percent total GHb with percent HbA1c in people with and without known diabetes. Diabetes Care. 1998;21:1475–80. doi: 10.2337/diacare.21.9.1475. [DOI] [PubMed] [Google Scholar]
- 19.Friedewald WT, Levy RI, Fredrickson DS. Estimation of the concentration of LDL-cholesterol in plasma, without use of the ultracentrifuge. Clin Clem. 1972;18:499–502. [PubMed] [Google Scholar]
- 20.Brzycki M. Strength testing – predicting a one-rep max from reps to fatigue. J Phys Educ Recreat Dance. 1993;64:88–90. [Google Scholar]
- 21.Holten MK, Zacho M, Gaster M, Juel C, Wojtaszewski JF, Dela F. Strength training increases insulin-mediated glucose uptake, GLUT4 content, and insulin signalling in skeletal muscle in patients with type 2 diabetes. Diabetes. 2004;53:294–305. doi: 10.2337/diabetes.53.2.294. [DOI] [PubMed] [Google Scholar]
- 22.Sigal RJ, Kenny GP, Boulé NG, Wells GA, Prud’homme D, Fortier M, et al. Effects of aerobic training, resistance training, or both on glycemic control in type 2 diabetes: A randomized trial. Ann Intern Med. 2007;147:357–69. doi: 10.7326/0003-4819-147-6-200709180-00005. [DOI] [PubMed] [Google Scholar]
- 23.Misra A, Misra R, Wijesuriya M, Banerjee D. The metabolic syndrome in South Asians: Continuing escalation & possible solutions. Indian J Med Res. 2007;125:345–54. [PubMed] [Google Scholar]
- 24.Misra A, Vikram NK. Insulin resistance syndrome (metabolic syndrome) and obesity in Asian Indians: Evidence and implications. Nutrition. 2004;20:482–91. doi: 10.1016/j.nut.2004.01.020. [DOI] [PubMed] [Google Scholar]
- 25.Misra A, Misra R, Wijesuriya M. The metabolic syndrome in South Asians. In: Mohan V, HR Rao G, editors. Type 2 Diabetes in South Asians: Epidemiology, Risk Factors and Prevention. New Delhi: Jaypee Bros; 2007. pp. 76–96. [Google Scholar]
- 26.Baldi JC, Snowling N. Resistance training improves glycaemic control in obese type 2 diabetic men. Int J Sports Med. 2003;24:419–23. doi: 10.1055/s-2003-41173. [DOI] [PubMed] [Google Scholar]
- 27.Baum K, Votteler T, Schiab J. Efficiency of vibration exercise for glycemic control in type 2 diabetes patients. Int J Med Sci. 2007;4:159–63. doi: 10.7150/ijms.4.159. [DOI] [PMC free article] [PubMed] [Google Scholar]
- 28.Sayer AA, Dennison EM, Syddall HE, Gilbody HJ, Phillips DI, Cooper C. Type 2 diabetes, muscle strength, and impaired physical function: The tip of the iceberg? Diabetes Care. 2005;28:2541–2. doi: 10.2337/diacare.28.10.2541. [DOI] [PubMed] [Google Scholar]
- 29.Pouliot MC, Despres JP, Lemieux S, Moorjani S, Bouchard C, Tremblay A, et al. Waist circumference and abdominal sagittal diameter: Best simple anthropometric indexes of abdominal visceral adipose tissue accumulation and related cardiovascular risk in men and women. Am J Cardiol. 1994;73:460–8. doi: 10.1016/0002-9149(94)90676-9. [DOI] [PubMed] [Google Scholar]
- 30.Miyatake N, Matsumoto S, Fujii M, Numata T. Reducing waist circumference by at least 3 cm is recommended for improving metabolic syndrome in obese Japanese men. Diabetes Res Clin Pract. 2008;79:191–5. doi: 10.1016/j.diabres.2007.08.018. [DOI] [PubMed] [Google Scholar]