Informatics tools can be used to create accurate large-scale repositories of anatomy-specific CT radiation exposure data from existing image archives that mightbe useful in patient safety initiatives, including radiation exposure monitoringand technique optimization programs.
Abstract
Purpose:
To develop and validate an informatics toolkit that extracts anatomy-specific computed tomography (CT) radiation exposure metrics (volume CT dose index and dose-length product) from existing digital image archives through optical character recognition of CT dose report screen captures (dose screens) combined with Digital Imaging and Communications in Medicine attributes.
Materials and Methods:
This institutional review board–approved HIPAA-compliant study was performed in a large urban health care delivery network. Data were drawn from a random sample of CT encounters that occurred between 2000 and 2010; images from these encounters were contained within the enterprise image archive, which encompassed images obtained at an adult academic tertiary referral hospital and its affiliated sites, including a cancer center, a community hospital, and outpatient imaging centers, as well as images imported from other facilities. Software was validated by using 150 randomly selected encounters for each major CT scanner manufacturer, with outcome measures of dose screen retrieval rate (proportion of correctly located dose screens) and anatomic assignment precision (proportion of extracted exposure data with correctly assigned anatomic region, such as head, chest, or abdomen and pelvis). The 95% binomial confidence intervals (CIs) were calculated for discrete proportions, and CIs were derived from the standard error of the mean for continuous variables. After validation, the informatics toolkit was used to populate an exposure repository from a cohort of 54 549 CT encounters; of which 29 948 had available dose screens.
Results:
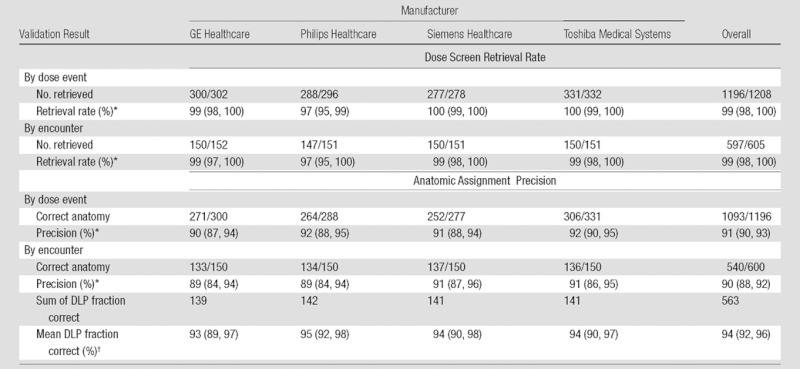
Validation yielded a dose screen retrieval rate of 99% (597 of 605 CT encounters; 95% CI: 98%, 100%) and an anatomic assignment precision of 94% (summed DLP fraction correct 563 in 600 CT encounters; 95% CI: 92%, 96%). Patient safety applications of the resulting data repository include benchmarking between institutions, CT protocol quality control and optimization, and cumulative patient- and anatomy-specific radiation exposure monitoring.
Conclusion:
Large-scale anatomy-specific radiation exposure data repositories can be created with high fidelity from existing digital image archives by using open-source informatics tools.
©RSNA, 2012
Supplemental material: http://radiology.rsna.org/lookup/suppl/doi:10.1148/radiol.12111822/-/DC1
Introduction
Medical imaging and the resultant ionizing radiation exposure have become increasingly public (1) and political topics, with mounting pressure on radiologists to document and reduce radiation exposure (2–4). Computed tomography (CT) accounts for approximately half of the rapidly growing medical radiation exposure to patients (5,6), and rapid increases in CT use have heightened concerns about growing potential risks to the population as a whole (7) and to individual patients who undergo frequent imaging over time (8,9). Before the medical community can engage in systematic and large-scale patient safety initiatives related to radiation exposure, it must first have the tools with which to capture radiation exposure data on a large scale.
There are persistent controversies about the effect of low-level radiation exposure of the magnitude produced by diagnostic imaging modalities, as the largest data source for current risk models is the cohort of individuals who survived the large-magnitude one-time radiation exposure of the atomic bomb blasts (10). Ultimately, direct testing of the underlying risk models in the lower-dose ranges might benefit from large-scale anatomy-specific dosimetry records linked to cancer outcomes. Informatics tools capable of capturing existing radiation exposure data might enable performance of the large-scale multicenter trials needed for such efforts.
Several years of radiation exposure data currently reside in existing clinical image archives at most institutions in the form of dose report screen captures (hereafter, dose screens) (Fig E1 [online]). These additional images within each CT study contain a screen capture of a text table that summarizes overall x-ray exposure metrics for the CT examination. In addition, associated Digital Imaging and Communications in Medicine (DICOM) attributes contain more granular detail at the level of the individual images within the CT study, including information about the CT scanner, protocol, and examination, as well as information about the patient. Dose report formatting and content vary between manufacturers, scanner models, and software versions, but all dose reports contain the x-ray tube output metrics volume CT dose index (CTDIvol) and dose-length product (DLP). Both of these metrics rely on calibration measurements obtained in standard-diameter 16-cm head and 32-cm body acrylic CT dose index phantoms. CTDIvol is the weighted sum of central and peripheral measurements obtained in such a phantom with a particular CT technique, with geometric correction for the pitch of a helical scan. DLP then integrates CTDIvol over the exposed length of the patient. While these are well-defined measures of x-ray tube output, further information about the anatomy exposed to radiation and the size of the patient are crucial elements needed to determine the actual dose to the patient (11–14).
Unfortunately, the data contained in dose screens are not in a format that is inherently accessible to databases, which makes it challenging to locate, extract, validate, and optimize access to the data (15). Cook et al (16) and Shih et al (17) have previously described methods used to automate extraction of dose screen data by using optical character recognition (OCR). Standardized DICOM radiation dose structured reports (or DICOM RDSR) (18,19) and ongoing development of standardized terminology with which to describe imaging procedures (20) should help greatly with these prospective efforts; however, widespread adoption is expected to take several years (21) and will not address historical data capture.
To our knowledge, no previous publications have described methods that can be used to create large-scale radiation exposure data repositories that include anatomy-specific exposure information. The anatomic region exposed to radiation is a crucial element in converting the recorded x-ray tube output metrics to a meaningful patient dose estimate. We hypothesized that informatics tools could be used to create such a repository from existing institutional digital image archives, which may be useful in efforts to monitor radiation exposure and to optimize CT technique. The purpose of this study was to develop and validate an informatics toolkit that extracts anatomy-specific CT radiation exposure metrics (CTDIvol and DLP) from existing digital image archives through OCR of CT dose screens combined with image DICOM attributes.
Materials and Methods
Setting
Institutional review board approval was obtained for this Health Insurance Portability and Accountability Act–compliant study, with waiver of informed consent for retrospective review of medical records. This study included images obtained at (a) Brigham and Women’s Hospital, an urban 793-bed adult tertiary referral academic medical center (53 011 CT examinations in 2010); (b) sites affiliated with Brigham and Women’s Hospital—including an outpatient cancer center (27 793 CT examinations in 2010), a 130-bed community hospital (11 157 CT examinations in 2010), and outpatient imaging centers (4261 CT examinations in 2010); and (c) more than 300 outside facilities not affiliated with Brigham and Women’s Hospital (9989 CT examinations in 2010 that had been imported from portable media).
Data Sources
The data source was the Centricity Enterprise Archive (GE Healthcare, Piscataway, NJ) serving the picture archiving and communication system (PACS). The archive contained 779 549 CT studies obtained in 206 646 patients between 2000 and 2010. Throughout the study period, the CT scanners installed in the aforementioned facilities were predominantly Siemens Healthcare (Forchheim, Germany) and Toshiba Medical Systems (Tokyo, Japan) models, with the exception of combined positron emission tomography/CT scanners (GE Healthcare). For all manufacturers, including Philips Healthcare (Best, the Netherlands), additional CT images reside in the archive because of importation from outside facilities.
Cohort Selection
A representative sample of all CT studies was defined for consecutive 8-day periods beginning with the 3rd week of each quarter from 2000 through 2010 (avoiding major holidays); this yielded 54 549 CT encounters. Exposure data from CT projection radiographs (localizer images) were excluded from analysis because of variable exposure metric reporting. PET/CT studies were excluded to make manufacturer-specific data sets more comparable. All extracted exposure data obtained with GE Healthcare, Siemens Healthcare, Toshiba Medical Systems, and Philips Healthcare equipment came from studies obtained at outside facilities that had been uploaded into the image archive.
Dose Extraction Toolkit
We developed an anatomy-specific dose extraction toolkit from modification and extension of the open-source PixelMed DICOM toolkit that included the OCR, radiation dose classes, anatomy classes, and procedure classes (22). We named this toolkit the generalized radiation observation kit (GROK), as inspired by the term coined by author Robert A. Heinlein in 1961 (23).
Dose Report Identification and Anatomy-specific Exposure Metric Extraction
The toolkit locates and retrieves the CT exposure metrics CTDIvol and DLP from a DICOM image archive. Dose screens are retrieved and converted to text by using OCR, with the exception of studies obtained with Philips scanners; these units routinely save these exposure metrics in private DICOM attributes, obviating the need for OCR. In addition, the toolkit retrieves a single image from each series in the CT encounter to obtain image-level DICOM attributes containing information about the scanner, CT protocol, examination, and patient. Finally, anatomy assignment algorithms, which are described in detail in Appendix E1 and Figure E2 (online) and in the source code of the toolkit (24), use the combined dose screen text and DICOM attributes data to determine the anatomic regions irradiated. All extracted and derived data are written to a relational database (Microsoft SQL server 2005; Microsoft, Seattle, Wash).
From the cohort sample of archived CT examinations, we derived the incidence of CT encounters over time for each of the four major CT manufacturers (GE Healthcare, Siemens Healthcare, Toshiba Medical Systems, and Philips Healthcare), as well as the prevalence of associated dose screens as detected with the toolkit. Toolkit processing time was recorded for the extraction of radiation exposure data from the enterprise image archive.
Toolkit Validation
We define a dose event as each time the x-ray tube is turned on and off. A CT encounter includes all dose events (and sometimes distinct CT examinations) that occurred during a patient’s visit to the CT scanner with the same study start date and time. The dose screen prevalence was calculated in the study cohort over time as the proportion of all CT encounters that contained an identifiable dose screen.
For toolkit validation, we manually reviewed randomly selected CT encounters from the full cohort until 150 encounters with detected dose screens had been included for each of the aforementioned four major CT unit manufacturers.
Dose screen retrieval rate is the proportion of all recorded dose events that were retrieved. The presence of recorded dose events was determined by manual review of dose screens in the PACS for each randomly selected CT encounter. Retrieval rate was also calculated at the encounter level as the proportion of encounters for which all recorded subcomponent dose events were retrieved.
Anatomic assignment precision is the proportion of extracted dose events with correctly determined anatomy and corresponding exposure metrics. Manual review of dose screens and CT images in the PACS was performed for each randomly selected CT encounter to determine if exposure metrics and anatomy were extracted correctly, and error analysis was performed. Anatomic assignment precision was measured at the dose event level and the encounter level as the proportion of encounters for which all contained dose events were extracted correctly. Because individual dose event exposures may differ by orders of magnitude, we also calculated the encounter DLP fraction correct, defined as the sum of DLP from all correctly assigned dose events divided by the total encounter DLP, to better assess the practical effect of extraction errors. Thus, the encounter DLP fraction correct is a continuous variable that can vary between 0 and 1 for each encounter. Anatomic assignment errors were categorized into three types at the dose event level: naming, OCR, and dose event–to-image matching.
Patient Safety Applications
We demonstrate use of the automatically extracted anatomy-specific exposure data in three distinct scenarios relevant to radiation monitoring and technique optimization efforts.
Institutional benchmarking.—From the database of extracted radiation exposure data, we selected all abdominal and pelvic CT studies obtained in September 2010 that included one pass through the anatomy. We excluded multiphase scans that included more than one time point relative to intravenous contrast material administration. The DLP of the abdominal and pelvic acquisition was grouped at the facility at which the examination was performed.
CT protocol quality control.—We selected all single-pass abdominal and pelvic CT studies obtained in 2010 and created DLP distributions stratified by CT protocol.
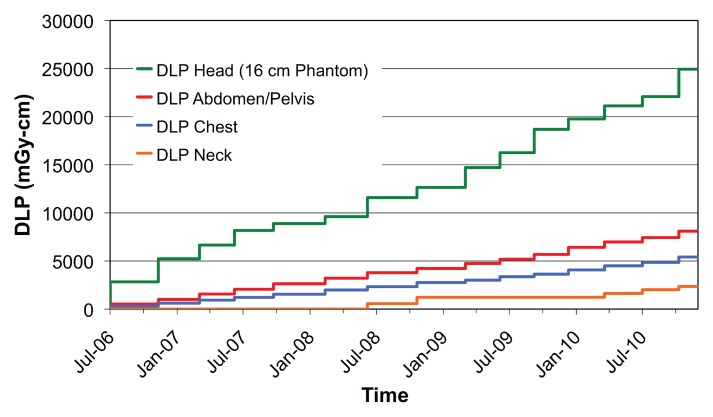
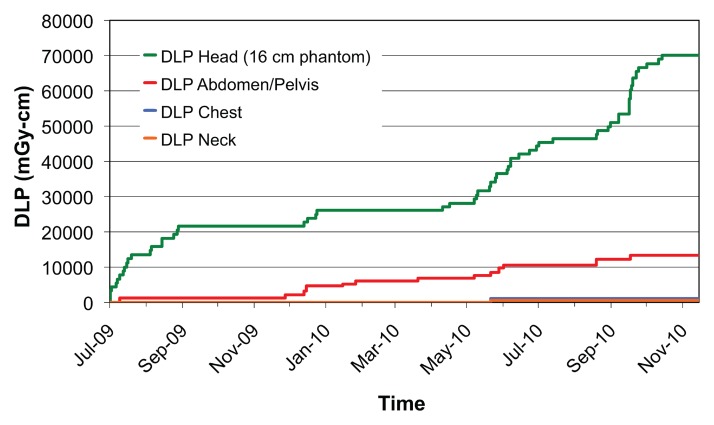
Cumulative patient-specific radiation exposure monitoring.—We used the toolkit to extract all anatomy-specific exposure metrics available in two patients who underwent recurrent imaging. Cumulative DLP within each exposed anatomic region was recorded as a function of time.
Statistical Analysis
At least 31 encounters would be needed to calculate dose screen retrieval rate with 95% binomial confidence intervals (CIs) of less than 5% based on a minimum recall of 98%. At least 139 encounters would be needed to calculate anatomy-specific exposure metric assignment precision with 95% binomial CIs of less than 5% based on a minimum precision of 90%. On the basis of these power calculations, 150 encounters from each CT manufacturer were selected for toolkit validation.
Binomial confidence intervals were calculated for dose screen retrieval rate and anatomic assignment precision by both dose event and CT encounter. For anatomic assignment precision with the continuous outcome measure encounter DLP fraction correct, 95% CIs are reported as 1.96 times the standard error of the mean. We used Excel 2008 (Microsoft) software to calculate these CIs from the validation statistics and for figure creation.
Results
CT Use and Dose Screen Prevalence
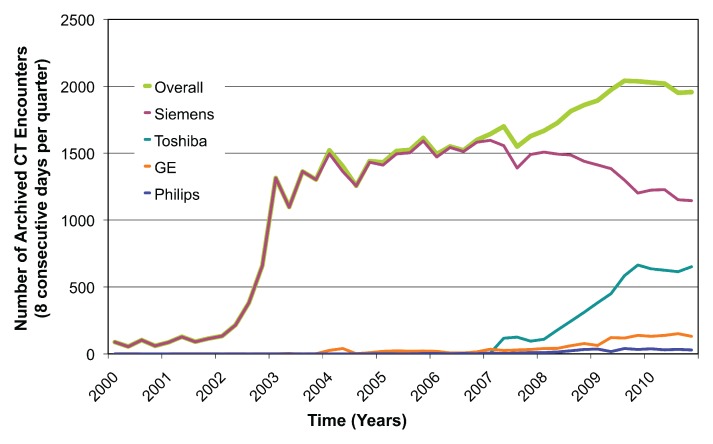
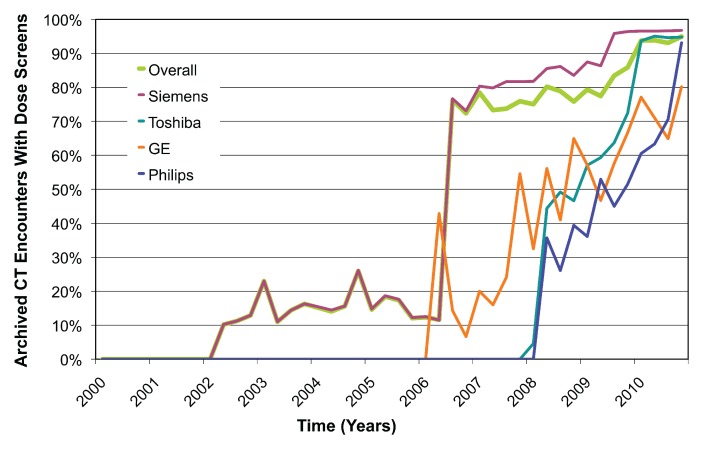
The rate of extraction was approximately 500 CT studies per hour, with most of this time related to retrieval of potential dose screens and images. There was a total of 54 549 CT encounters in the representative cohort, of which 29 948 (55%) had at least one detected dose screen. Prevalence of dose screens over time increased from 10% (22 of 216 encounters) in the first quarter of 2002 to 95% (1857 of 1956 encounters) in the fourth quarter of 2010 (Fig 1). The substantial increase in total number of archived examinations from 2002 to 2003 reflected partial data migration to a new image archive rather than an abrupt change in imaging volume. The large increase in dose screen prevalence in 2006 from 12% (180 of 1550 encounters) to 76% (1160 of 1521 encounters) corresponded to acquisition of new 64-detector scanner models and software upgrades.
Figure 1a:
(a) Graph shows number of archived CT encounters by manufacturer and overall. (b) Graph shows the proportion of archived CT encounters that contain dose screens. Dose screens have sharply increased in prevalence in the past several years and represent a large potential source of radiation exposure data.
Figure 1b:
(a) Graph shows number of archived CT encounters by manufacturer and overall. (b) Graph shows the proportion of archived CT encounters that contain dose screens. Dose screens have sharply increased in prevalence in the past several years and represent a large potential source of radiation exposure data.
Dose Screen Retrieval Rate
Table 1 contains detailed retrieval rate results. Overall dose screen retrieval rate was 99% (1196 of 1208 dose events, 95% CI: 98%, 100%) by dose event and 99% (597 of 605 encounters; 95% CI: 98%, 100%) by encounter. Most retrieval failures for Philips Healthcare scanners (three of four missed dose screens) were due to dose reports not being located in the expected series; the remaining failure was due to the dose screen being mixed with many topograms. To correct these failures, we would need to retrieve many irrelevant images to find the relevant dose screens. The remaining four missed dose screens were a result of (a) OCR failure due to unrecognized characters in two cases (one caused by lossy compression of a dose screen), duplication of a dose screen under two separate encounters in one case, and alteration of the expected dose screen DICOM image type attribute in one case.
Table 1.
Dose Screen Retrieval Rate and Anatomic Assignment Precision by Dose Event and Encounter
Data in parentheses are 95% binomial CIs.
Data in parentheses are 95% CIs derived from standard error of the mean.
Anatomic Assignment Precision
Table 1 contains detailed anatomic assignment precision results. Overall anatomic assignment precision was 91% (1093 of 1196 dose events; 95% CI: 90%, 93%) by dose event and 90% (540 of 600 CT encounters; 95% CI: 88%, 92%) by encounter. Overall encounter DLP fraction correct was 94% (summed DLP fraction correct 563 in 600 CT encounters; 95% CI: 92%, 96%). As the extracted CTDIvol and DLP values were always numerically correct (all 1196 events), all errors represented failure to assign the correct anatomic region to the dose event.
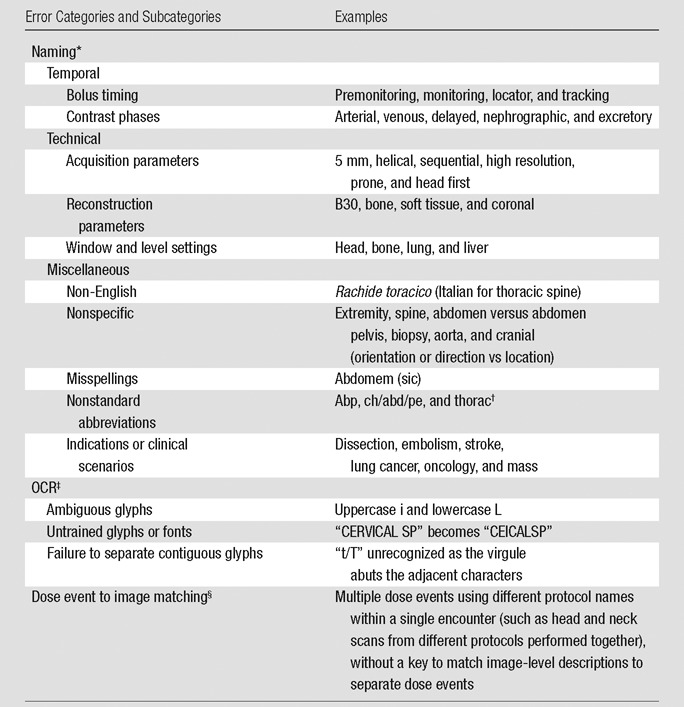
Naming errors are due to anatomically inadequate series and protocol descriptions and were the major source of error, comprising 83% of the error rate (86 of 103 dose event errors) (Table 2). OCR errors were due to unrecognized character glyphs, which are easily correctable with character training, and accounted for four (4%) of 103 errors. Matching errors accounted for 13 (13%) of 103 errors, where potentially useful anatomic information was present in image-level DICOM attributes but could not be matched to the corresponding dose event.
Table 2.
Error Classification and Examples
Anatomically nonspecific or incorrect description of irradiation event, series, or protocol.
abp = abdomen pelvis, ch/abd/pe = chest abdomen pelvis, thorac = chest.
Incorrect conversion of images of text to encoded characters.
Inability to match image-level anatomic information to dose events.
Patient Safety Applications of Large-Scale Anatomy-specific Radiation Exposure Repositories
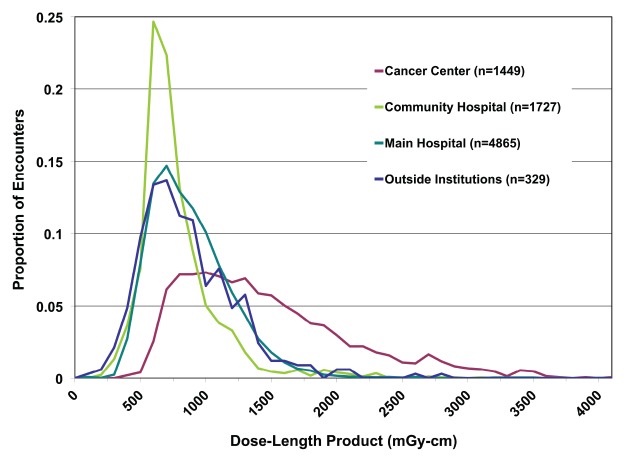
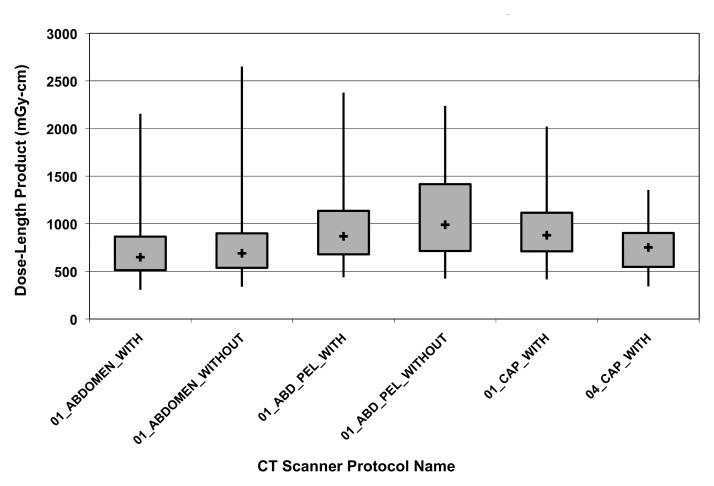
Figure 2 shows a comparison of all single-pass abdominal and pelvic studies (as determined by automatically assigned anatomy) grouped by performing facility. Automatically assigned anatomy enables comparison between facilities by bypassing the variation and ambiguity of protocol names at each scanner or institution. Figure 3 shows the DLP distribution of single-pass abdominal and pelvic studies obtained with multiple CT scanners at one institution, stratified by protocol name, for use in scanner protocol standardization and dose optimization. Figure 4 shows cumulative DLP by anatomic region for two patients with recurrent imaging: a 41-year-old patient with breast cancer who underwent multiple restaging examinations and a 75-year-old man with a history of hepatocellular carcinoma who underwent multiple surgeries to treat an intracranial aneurysm. The variable exposure magnitude of individual dose events is a function of the specific scanner technology and protocol parameters used for each examination. Note that the higher DLP values per examination in the head relate in part to use of the smaller 16-cm-diameter head CT dose index phantom rather than the 32-cm-diameter body CT dose index phantom used by convention to report x-ray tube output in the remainder of the body.
Figure 2:
Graph shows frequency distribution of dose event DLP (100 mGy⋅cm bins) for single-pass abdominal and pelvic CT. Automated anatomic assignment enables comparison of procedures from different institutions despite widely variable procedure descriptions.
Figure 3:
Box plot shows DLP variation of abdominal and pelvic CT performed with different CT units stratified by scan protocol name. The median (+), 25th and 75th percentiles (box), and minimum and maximum values (vertical lines) are shown. Institutional data capture identifies variation for targeted protocol standardization and dose optimization.
Figure 4a:
(a, b) For two patients with recurrent imaging, the toolkit extracted DLP and anatomic region exposed to radiation. Graphs show cumulative DLP for each exposed region. Automated anatomy assignment enables consolidation of exposure data from different protocols, manufacturers and institutions.
Figure 4b:
(a, b) For two patients with recurrent imaging, the toolkit extracted DLP and anatomic region exposed to radiation. Graphs show cumulative DLP for each exposed region. Automated anatomy assignment enables consolidation of exposure data from different protocols, manufacturers and institutions.
Discussion
Patient safety initiatives relevant to radiation exposure monitoring require the tools to capture pertinent exposure data on a large scale. We developed GROK as an open-source informatics toolkit capable of creating large repositories of historic CT radiation exposure information from preexisting data embedded in an enterprise image archive. Meaningful use of such data relies on accurate anatomic specificity of the extracted CT exposure metrics. Our toolkit performs automated anatomic assignment of exposure metrics, despite the considerable heterogeneity of available exposure data in imaging archives. Toolkit validation enabled us to confirm that OCR of CT dose screens is an effective strategy with which to obtain exposure metrics from existing DICOM image repositories (25), and we have further shown how added anatomic specificity can potentially enhance large-scale radiation exposure monitoring and technique optimization efforts.
Prevalence of exposure data in the form of dose report screen captures has increased dramatically in recent years, with over 90% prevalence in our enterprise image archive since 2010. Our toolkit validation revealed a high dose screen retrieval rate and high anatomic assignment precision for all major CT manufacturers.
Large-scale repositories of standardized anatomy-specific exposure data can lead to knowledge discovery by enabling exploration of radiation exposure variations in multiple dimensions, and they can allow monitoring, analysis, and optimization at a regulatory, institutional, scanner, or individual patient level. At the regulatory level, a substantial barrier to the development of diagnostic reference levels—typical radiation exposure levels designed to allow benchmarking between institutions—is lack of standardized anatomic descriptions for performed procedures (26,27). The standardized anatomy-specific exposure metrics the toolkit extracts may aid in creating diagnostic reference levels and can facilitate meaningful comparison of exposure distributions from examinations performed at different institutions. Within institutions, radiation exposure repositories can benefit CT protocol quality control efforts by helping radiologists identify potentially inappropriate variation or outlier examinations and locate the best targets for protocol standardization and optimization.
Meaningful patient-specific longitudinal radiation dose monitoring requires accurate collection of available radiation exposure data and robust methods to convert this data into relevant dose to the patient (15). It is important to recognize that while CTDIvol and DLP are accurate metrics of x-ray tube output, they do not represent actual patient dose (11). Conversion of these x-ray output metrics to meaningful patient-specific doses will ultimately require heuristics derived from Monte-Carlo simulations or measurements that incorporate both the anatomic region exposed and the patient morphology (most importantly, patient size) (13,14). Anatomy-specific exposure data enable refinement of cumulative dose history by using actual exposure metrics rather than typical values based on examination type (8,9).
The concept of effective dose was intended for use not in individual patients, but rather in large populations (12,28–30). Effective dose is a weighted sum of organ doses intended to represent the uniform whole-body equivalent dose that would produce the same overall cancer risk as the heterogeneous exposures encountered in practice. Thus, it is commonly used to compare the risks of distinct exposures, even if they are to different parts of the body. However, the tissue-weighting factors representing the relative radiation sensitivities of the internal organs (28) are population averages and do not retain the known dependence of radiation risk on age and sex (10). Despite these limitations, effective dose is often used as a convenient single dosimetry metric, and effective dose estimates (31) are used in numerous studies. Furthermore, the common method of converting DLP to an effective dose estimate through use of anatomy-specific DLP-to–effective dose conversion k factors (12) fails to adjust for patient size. Organ doses would ultimately provide the most accurate basis for longitudinal patient-dose tracking once robust methods are developed to calculate them from available data on a large scale.
Our informatics tool and study had limitations. Although the toolkit can process PET/CT dose screens, we excluded them from validation to create comparable validation sets between manufacturers. Although we have included common anatomic naming variants and the validation data set included studies from outside institutions, successful implementation may require site-specific training and validation to address anatomic nomenclature variations. Continued manufacturer changes in dose-screen format and contents over time may require subsequent toolkit customizations until anatomy-specific exposure metrics become more routinely available in standardized DICOM structured reports. A statistical limitation is that our calculation of confidence intervals for dose event validation statistics assumes independence between events; therefore, it may only be approximate if there is correlation of the events within the same encounter.
Automated extraction of anatomy-specific exposure data does not in itself solve exposure monitoring problems, and considerable effort is required to implement supporting policies and transform associated processes to realize the benefits enabled by this new technology. The toolkit does not include the means to analyze the extracted data, and integration into a radiation exposure monitoring program requires data management resources that might not be available at many institutions. Finally, one must remember that the extracted data are x-ray tube output metrics. Calculation of reasonably accurate patient-specific radiation doses will ultimately require consensus methods to incorporate the effects of patient size metrics, which are not yet routinely available in existing archives.
In summary, open-source informatics tools can be used to create accurate large-scale repositories of anatomy-specific CT radiation exposure data from existing image archives, which may be useful in patient safety initiatives, including radiation exposure monitoring and technique optimization programs.
Advance in Knowledge.
• Large-scale databases of anatomy-specific CT radiation exposure metrics can be created from existing image archives by using open-source informatics tools, with a retrieval rate of 99% (597 of 605 CT encounters; 95% confidence interval: 98%, 100%) and an anatomic assignment precision of 94% (summed DLP fraction correct 563 in 600 CT encounters; 95% confidence interval: 92%, 96%).
Implications for Patient Care.
• Large-scale anatomy-specific CT radiation exposure data can enable radiation exposure benchmarking between institutions and give radiologists a tool with which to develop diagnostic reference levels by using data from many practices.
• CT protocol quality control programs may be enhanced by extracting anatomy-specific exposure data from existing image repositories.
Disclosures of Potential Conflicts of Interest: A.S. Financial activities related to the present article: none to disclose. Financial activities not related to the present article: is a consultant to Siemens CT, Toshiba CT, and Medrad. Other relationships: none to disclose. G.I.W. No potential conflicts of interest to disclose. C.E.F. No potential conflicts of interest to disclose. I.I. No potential conflicts of interest to disclose. L.M.P. No potential conflicts of interest to disclose. K.P.A. No potential conflicts of interest to disclose. R.K. No potential conflicts of interest to disclose.
Supplementary Material
Acknowledgments
We thank David Clunie, MB, BS, for creating the open-source PixelMed DICOM toolkit from which GROK originated and for helpful communications during our development of GROK.
Received October 3, 2011; revision requested November 11; revision received January 16, 2012; accepted January 31; final version accepted February 22.
G.I.W. supported by the United States Air Force Medical Corp.
The content is solely the responsibility of the authors and does not necessarily represent the official views of the National Library of Medicine or the National Institutes of Health.
Funding: This research was supported by the National Institutes of Health (grants R01LM010679 and T15LM007092).
See also the editorial by McCollough in this issue.
Abbreviations:
- CI
- confidence interval
- CTDIvol
- volume CT dose index
- DICOM
- Digital Imaging and Communications in Medicine
- DLP
- dose-length product
- GROK
- generalized radiation observation kit
- OCR
- optical character recognition
- PACS
- picture archiving and communication system
References
- 1.Bogdanich W. After stroke scans, patients face serious health risks. New York Times. July 31, 2010: http://www.nytimes.com/2010/08/01/health/01radiation.html?_r=1&ref=radiation. Accessed October 20, 2010
- 2.Center for Drug Evaluation and Research White paper: initiative to reduce unnecessary radiation exposure from medical imaging. http://www.fda.gov/Radiation-EmittingProducts/RadiationSafety/RadiationDoseReduction/ucm199994.htm. Published February 2010. Updated December 14, 2010. Accessed December 24, 2010
- 3.Padilla A, Alquist EK. California Senate Bill 1237. http://info.sen.ca.gov/pub/09-10/bill/sen/sb_1201-1250/sb_1237_bill_20100929_chaptered.html. Published February 19, 2010. Accessed September 1, 2011
- 4.Amis ES, Jr, Butler PF, Applegate KE, et al. American College of Radiology white paper on radiation dose in medicine. J Am Coll Radiol 2007;4(5):272–284 [DOI] [PubMed] [Google Scholar]
- 5.Mettler FA, Jr, Bhargavan M, Faulkner K, et al. Radiologic and nuclear medicine studies in the United States and worldwide: frequency, radiation dose, and comparison with other radiation sources—1950–2007. Radiology 2009;253(2):520–531 [DOI] [PubMed] [Google Scholar]
- 6.Fazel R, Krumholz HM, Wang Y, et al. Exposure to low-dose ionizing radiation from medical imaging procedures. N Engl J Med 2009;361(9):849–857 [DOI] [PMC free article] [PubMed] [Google Scholar]
- 7.Brenner DJ, Hall EJ. Computed tomography: an increasing source of radiation exposure. N Engl J Med 2007;357(22):2277–2284 [DOI] [PubMed] [Google Scholar]
- 8.Sodickson A, Baeyens PF, Andriole KP, et al. Recurrent CT, cumulative radiation exposure, and associated radiation-induced cancer risks from CT of adults. Radiology 2009;251(1):175–184 [DOI] [PubMed] [Google Scholar]
- 9.Berrington de González A, Mahesh M, Kim KP, et al. Projected cancer risks from computed tomographic scans performed in the United States in 2007. Arch Intern Med 2009;169(22):2071–2077 [DOI] [PMC free article] [PubMed] [Google Scholar]
- 10.Committee to Assess Health Risks from Exposure to Low Levels of Ionizing Radiation , National Research Council. Health risks from exposure to low levels of ionizing radiation: BEIR VII phase 2. Washington, DC: National Academies Press, 2006 [PubMed] [Google Scholar]
- 11.McCollough CH, Leng S, Yu L, Cody DD, Boone JM, McNitt-Gray MF. CT dose index and patient dose: they are not the same thing. Radiology 2011;259(2):311–316 [DOI] [PMC free article] [PubMed] [Google Scholar]
- 12.American Association of Physicists in Medicine The measurement, reporting and management of radiation dose in CT. Report 96. AAPM Task Group 23 of the Diagnostic Imaging Council CT Committee. College Park, Md: American Association of Physicists in Medicine, 2008 [Google Scholar]
- 13.Turner AC, Zhang D, Khatonabadi M, et al. The feasibility of patient size-corrected, scanner-independent organ dose estimates for abdominal CT exams. Med Phys 2011;38(2):820–829 [DOI] [PMC free article] [PubMed] [Google Scholar]
- 14.American Association of Physicists in Medicine Size-specific dose estimates (SSDE) in pediatric and adult body CT examinations. Report 204. AAPM Task Group 204 of the Diagnostic Imaging Council CT Committee. College Park, Md: American Association of Physicists in Medicine, 2011 [Google Scholar]
- 15.Sodickson A, Khorasani R. Patient-centric radiation dose monitoring in the electronic health record: what are some of the barriers and key next steps? J Am Coll Radiol 2010;7(10):752–753 [DOI] [PubMed] [Google Scholar]
- 16.Cook TS, Zimmerman SL, Steingall SR, Maidment AD, Kim W, Boonn WW. RADIANCE: an automated, enterprise-wide solution for archiving and reporting CT radiation dose estimates. RadioGraphics 2011;31(7):1833–1846 [DOI] [PubMed] [Google Scholar]
- 17.Shih G, Lu ZF, Zabih R, et al. Automated framework for digital radiation dose index reporting from CT dose reports. AJR Am J Roentgenol 2011;197(5):1170–1174 [DOI] [PubMed] [Google Scholar]
- 18.DICOM Standards Committee Digital Imaging and Communication in Medicine (DICOM) Supplement 127: CT Radiation Dose Reporting (Dose SR). ftp://medical.nema.org/medical/dicom/final/sup127_ft.pdf. Published November 2, 2007. Accessed September 1, 2011
- 19.Esterlich A, Rica C, LeBozec CD, et al. IHE ITI Technical Framework Supplement 2007-2008 Radiation Exposure Monitoring (REM) Integration Profile. 2008 Jul 3 [Google Scholar]
- 20.RSNA org. RadLex Playbook release 1.0. http://www.rsna.org/RadLex_Playbook.aspx.Published November 1, 2011. Accessed December 1, 2011
- 21.Clunie D. Dose Matters. David Clunie’s blog. http://dclunie.blogspot.com/2010/05/dose-matters.html. Published May 31, 2010. Accessed November 8, 2010
- 22.Clunie D. PixelMed DICOM Toolkit. David Clunie. http://www.dclunie.com/pixelmed/software/.Accessed September 1, 2011 [Google Scholar]
- 23.Heinlein RA. Stranger in a strange land. New York, NY: Ace, 1987 [Google Scholar]
- 24.How GROK Works Brigham and Women’s Hospital Web site. http://www.brighamandwomens.org/Research/labs/cebi/GROK/default.aspx. Published November 25, 2011. Accessed January 13, 2012
- 25.Cook TS, Zimmerman S, Maidment ADA, Kim W, Boonn WW. Automated extraction of radiation dose information for CT examinations. J Am Coll Radiol 2010;7(11):871–877 [DOI] [PubMed] [Google Scholar]
- 26.Morin RL, Coombs LP, Chatfield MB. ACR Dose Index Registry. J Am Coll Radiol 2011;8(4):288–291 [DOI] [PubMed] [Google Scholar]
- 27.Chen J, Moir D, Cornett J. Considerations and preliminary design of patient exposure registry. Radiat Prot Dosimetry 2010;142(2-4):255–264 [DOI] [PubMed] [Google Scholar]
- 28.The 2007 recommendations of the International Commission on Radiological Protection: ICRP publication 103. Ann ICRP 2007;37(2-4):1–332 [DOI] [PubMed] [Google Scholar]
- 29.Martin CJ. Effective dose: how should it be applied to medical exposures? Br J Radiol 2007;80(956):639–647 [DOI] [PubMed] [Google Scholar]
- 30.McCollough CH, Christner JA, Kofler JM. How effective is effective dose as a predictor of radiation risk? AJR Am J Roentgenol 2010;194(4):890–896 [DOI] [PubMed] [Google Scholar]
- 31.Mettler FA, Jr, Huda W, Yoshizumi TT, Mahesh M. Effective doses in radiology and diagnostic nuclear medicine: a catalog. Radiology 2008;248(1):254–263 [DOI] [PubMed] [Google Scholar]
Associated Data
This section collects any data citations, data availability statements, or supplementary materials included in this article.


