Abstract
We determine the surface enhanced Raman (SER) capability of indium tin oxide nanorods (ITO NRs) whose physical, chemical, and optical properties are precisely and uniformly controlled during synthesis. We demonstrate that the Raman intensities observed from varying concentrations of the pure and mixed molecules of rhodamine 6G and 4′,6-diamidino-2-phenylindole are much larger on ITO NRs relative to those measured on commercially available ITO-coated glass or Si. Our efforts signify the first attempt to assess the SER capability of precisely controlled metal oxide NRs and will be highly beneficial to many basic and applied Raman applications requiring exceptional detection sensitivity.
Surface enhanced Raman spectroscopy (SERS) is a powerful analytical tool which has proven its usefulness as a very selective and sensitive surface measurement technique.1, 2, 3, 4, 5, 6 In SERS, the majority of the substrates used for surface enhancement effects involve nanoparticles, thin films, islands, and three-dimensional constructs of coinage metals such as Cu, Au, and Ag.2, 7, 8, 9 Identifying potential SERS-active substrates and understanding enhancement mechanisms for such substrates are critical to the field and, therefore, still remain a key area of SERS study. Although not as extensively explored as the aforementioned metals, some research efforts are made to obtain SERS of transition metals such as Pt, Rh, Pd, Fe, Co, and Ni.3, 10, 11, 12, 13 And more recently, other systems involving either a metal oxide thin film or a hybrid system of a metal nanoparticle/metal oxide thin film have been demonstrated as SERS-active materials.7, 14, 15, 16, 17, 18, 19 Plasmonic characteristics similar to those observed from noble metals are found in some transparent conducting metal oxides such as indium tin oxide, fluorine-doped tin oxide, and aluminum-doped zinc oxide.18, 20
Despite many leading efforts on this aspect, only a small subset of research discusses Raman enhancement effects observed from nanomaterials that are precisely controlled for their physical, chemical, optical, or electrical properties during synthesis. Controlling the exact size and structure of the nanomaterials has not been the primary focus of many previous SERS studies, and many of the studies involve random surface roughening of Raman substrates for desired surface enhancement effect. Only more recently with the progress in nanoscience has it become an active subject matter of SERS investigation.4, 8, 21, 22, 23 When it comes to one-dimensional (1D) metal oxide nanomaterials which typically exhibit a higher aspect ratio than noble metal nanorods of a comparable diameter, concerted SERS measurements on controlled nanomaterial substrates are even scarcer. Yet, the anisotropy of 1D nanomaterials can provide a higher degree of enhancement in localized electromagnetic fields through symmetry breaking and can thus be extremely beneficial for SERS.
In this letter, we report the SERS activity of well-controlled, anisotropic indium tin oxide nanorods (ITO NRs) by evaluating their role in Raman spectroscopy using rhodamine 6 G and 4′,6-diamidino-2-phenylindole (DAPI) as a model system. ITO NRs were synthesized via methods developed in our previous study.24 The size and morphology of as-grown ITO NRs were characterized by using FEI/Philips XL 20 scanning electron microscope (SEM) operated at 20 kV. X-ray diffraction (XRD) data were acquired using Rigaku Ultima IV x-ray diffractometer (The Wodlands, Texas) using Cu Kα radiation under an accelerating voltage and current of 45 kV of 44 mA, respectively. The sample was scanned at a rate of 2°/min in the range of 2θ = 5°–80°. Fourier transform infrared (FTIR) spectra were taken by using a Varian 3100 FTIR spectrometer (Varian Inc.). FTIR spectra were obtained for the scan range of 400 to 8000 cm−1 in attenuated total reflectance (ATR) mode with 4 cm−1 spectral resolution co-added for 50 scans.
Two dye molecules, rhodamine 6G (R6G) and DAPI, were purchased from VWR Inc. (Randor, PA) and diluted to desired concentrations ranging from 10 mg/ml to 1 μg/ml in deionized water. In addition to the ITO NRs, two control substrates of blank Si and ITO-coated glass were employed in our measurements. A total volume of 8 μl, either pure or mixed solutions of varying concentrations of DAPI and R6G, was deposited onto different substrates. Raman spectra were obtained by Renishaw RM1000 confocal Raman microscope. Samples were illuminated through a 50× objective lens either with a Renishaw diode laser operating at a wavelength of 785 nm or with a 514 nm Argon ion laser.
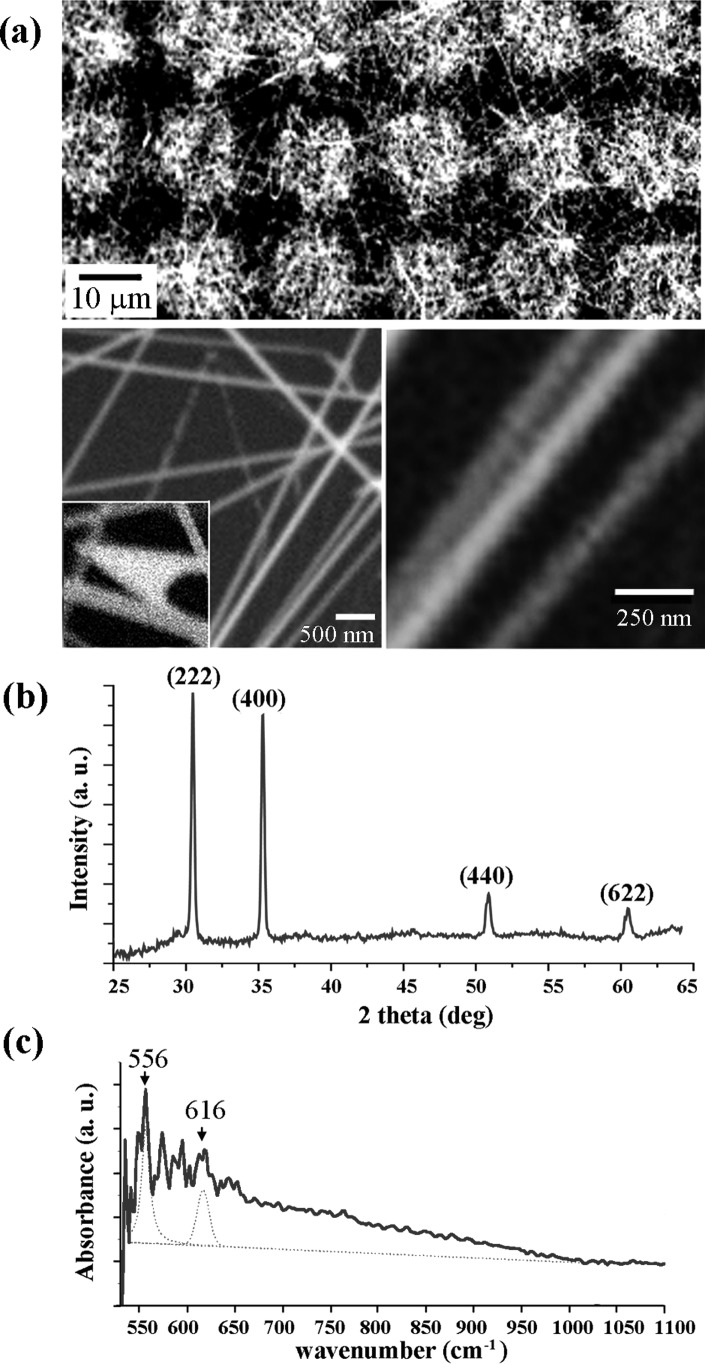
Fig. 1 displays the SEM, XRD, and FTIR data of the ITO NRs used in the Raman study. As-synthesized ITO NRs exhibit an average diameter 40 ± 1.5 nm and extend to a length of greater than 15 μm, see Fig. 1a. These long NRs tend to orient themselves parallel to the plane of the growth substrate instead of growing vertically. The ITO NRs exhibit the cubic structure of bixbyite Mn2O3 I type (C-type rare-earth oxide structure). The XRD diffraction peaks at 30.45°, 35.28°, 50.80°, and 60.40° shown in Fig. 1b correspond to (222), (400), (440), and (622) planes, respectively. Fig. 1c displays ATR FTIR data from as-grown ITO NRs. The ITO NR samples exhibit unique peaks located at 556 and 616 cm−1 which correspond to the In-O-In and Sn-O-Sn bonds in ITO NR crystals, respectively. Other nearby peaks, also observed from a blank Si, are due to symmetric and asymmetric O-Si-O vibrations of the chemical groups on the surface of the growth substrate of Si(100).25
Figure 1.
(a) SEM images of the ITO NRs used as SERS-active substrates. The scan size of the image is (top) 50 × 100 μm, (bottom left) 4 × 4 μm, (bottom right) 1 × 1 μm and the inset in the bottom left panel is 500 × 500 nm. (b and c) XRD (b) and FTIR (c) spectra of as-grown ITO NRs.
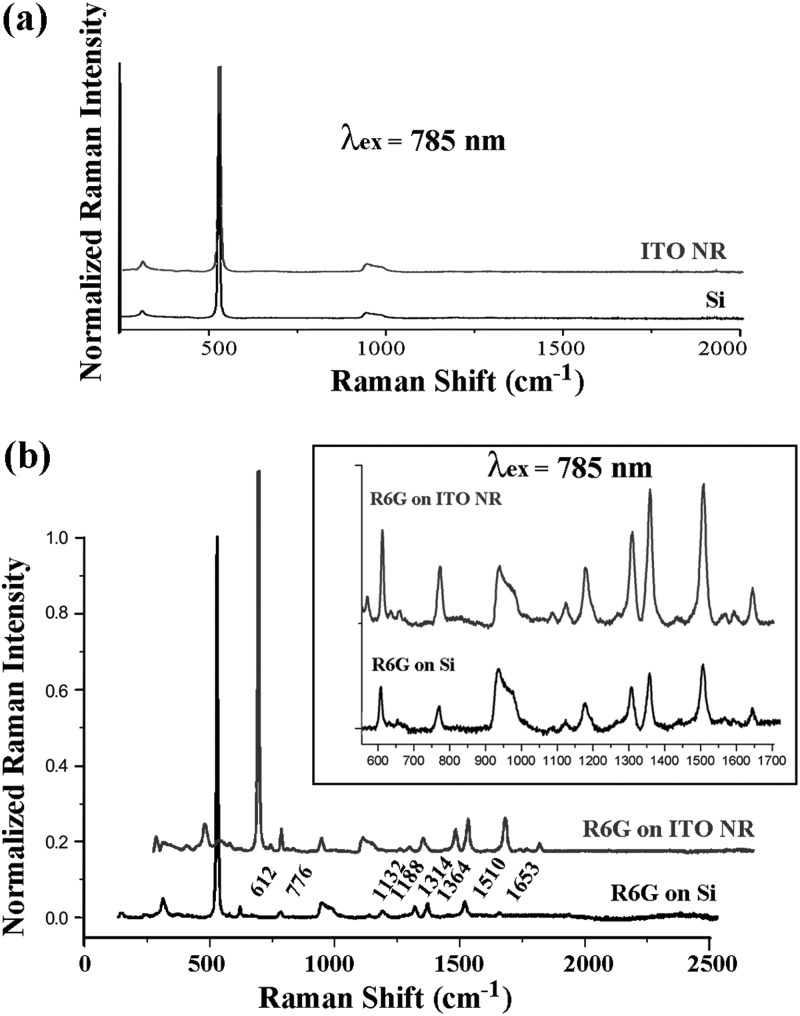
Deposition conditions for the two chemicals are kept identical between the three substrates. Raman intensity of each spectrum is normalized with respect to the characteristic strong Si peak appearing at 521 cm−1. Raman shifts of blank Si and ITO NRs are characterized in Fig. 2a. No distinctive Raman peak is seen in the ITO NR sample where the spectrum resembles that of Si. After depositing 100 μg/ml R6G, multiple Raman scans are carried out on different substrates in order to obtain the distinctive response signal corresponding to the spectroscopic signature of the dye molecule. Fig. 2b clearly displays the difference in normalized Raman intensity observed from the same concentration of R6G on an ITO NR platform versus on a Si substrate. Peaks located at 612, 776, 1132, 1188, 1314, 1364, 1510, and 1653 cm−1 are characteristic of R6G14 and they are clearly resolved using ITO NRs as a Raman substrate. Moreover, the pronounced Raman signal of R6G on ITO NRs indicates that our as-synthesized ITO NRs can be effectively employed as a SERS-active substrate.
Figure 2.
(a) Raman spectra of unmodified Si and ITO NRs. (b) Raman spectra of 100 μg/ml R6G deposited on Si and ITO NR substrates.
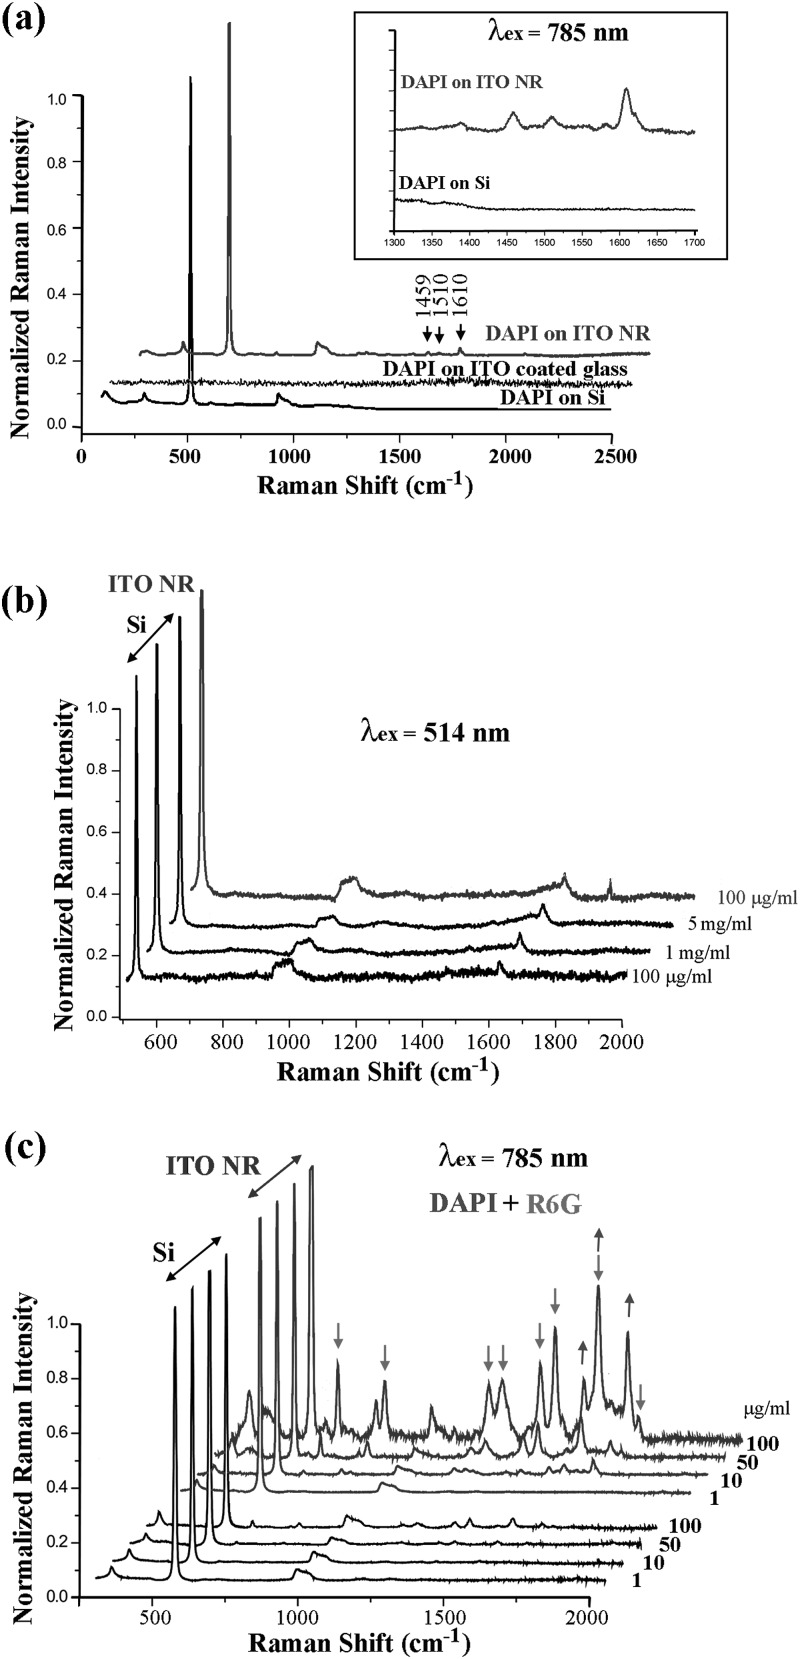
In order to substantiate this initial observation, Raman scattering experiments are repeated using a different molecule, DAPI. Fig. 3a displays Raman signal obtained from 100 μg/ml DAPI on ITO NR, ITO-coated glass, and Si samples while exciting with a 785 nm laser. For the same DAPI concentration, the Raman intensities of the DAPI peaks located at 1459, 1510, and 1610 cm−1 are much higher on ITO NRs when compared to those on Si or on ITO coated glass. In order to assess a possible link between the surface-to-volume ratio of the substrate materials and the measured Raman signal, higher concentrations of DAPI are deposited onto Si substrates and the resulting Raman intensity is compared to the ITO NR sample containing a much lower DAPI concentration. In this control experiment shown in Fig. 3b, the characteristic peak of DAPI at 1610 cm−1 is clearly observed from the ITO NR sample prepared by depositing 100 μg/ml of the dye molecule. However, the same peak cannot be resolved on Si even with fifty times higher concentration of DAPI. In order to ensure the reproducibility of our observation, Raman measurements are carried out further by using varying concentration of mixed chemical molecules of R6G and DAPI. The same tendency of increased Raman signals is repeatedly obtained from the mixture of DAPI and R6G on an ITO NR platform when compared to those from the same mixture on a Si substrate, Fig. 3c. Arrows (pointing upward: DAPI and downward: R6G) in Fig. 3c mark those peaks located at the expected Raman shift positions of the two dye molecules. The hard-to-resolve peaks of DAPI and R6G on Si are clearly identified when ITO NRs are used as Raman substrates instead.
Figure 3.
(a) Raman signal from 100 μg/ml DAPI on ITO NR, ITO-coated glass, and Si substrates. (b) Raman spectra collected from various concentrations of DAPI on ITO NR and Si samples. (c) Comparison of concentration-dependent Raman scattering signal from a mixture of DAPI and R6G molecules on ITO NR and Si substrates.
The degree of Raman enhancement observed from our ITO NR systems is compared to that of gold nanorods (AuNRs) by carrying out the identical deposition of of DAPI and R6G on both substrates. AuNRs were synthesized and purified according to the well-established methods in the literature.26, 27 UV-Vis spectra of the AuNRs were recorded on an Agilent 8453 diode-array spectrophotometer. A 5 μl droplet of the 1.6 nM AuNR solution was placed onto a clean Si substrate and left to dry in air. This procedure was repeated ten times until the surface was densely covered by AuNRs and the mixture of DAPI and R6G were drop-casted subsequently onto the AuNRs.
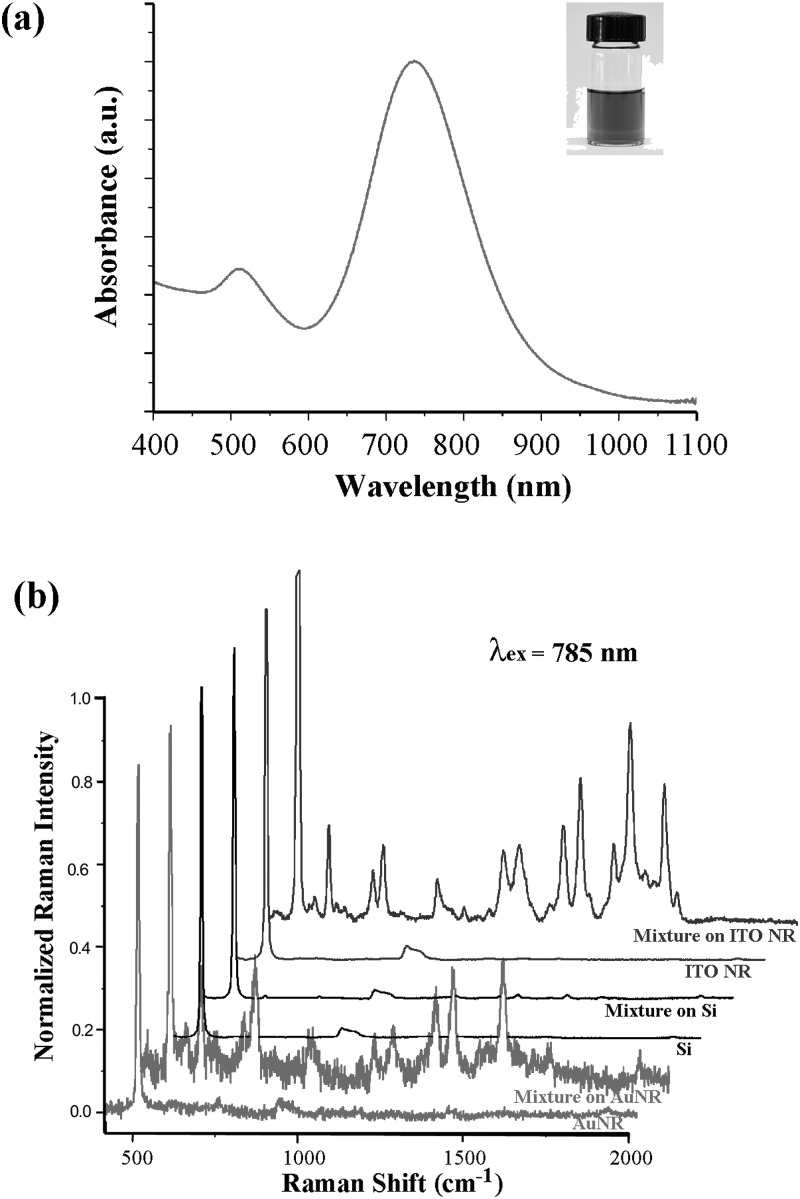
Fig. 4a displays a color photograph and a UV-Vis spectrum of the resuspended AuNR solution. The characteristic plasmon peak of the AuNRs appears at 735 nm along with a small peak at 510 nm. The characteristic peaks of DAPI and R6G shown in Fig. 4 indicate that the degree of Raman scattering on ITO NRs is comparable to that obtained on AuNR substrates. The conclusion drawn from our comparison study between ITO NRs and AuNRs may not be applied to all AuNR systems of different geometries and configurations reported in the literature. However, the result suggests that our ITO NR systems are capable of enhancing Raman signal and serve effectively as an alternative SERS-active substrate to metallic counterparts.
Figure 4.
(a) A color photograph and a UV-Vis spectrum of 1.6 nM AuNRs resuspended in deionized water. (b) Raman spectra collected with a 785 nm excitation while keeping the deposition conditions of the 100 μg/ml DAPI and R6G mixture identical on the three substrates of Si, AuNRs, and ITO NRs.
Although the charge carrier densities of metal oxides are approximately two orders of magnitude lower than those of typical metals, the surface plasmon resonance phenomena of metal oxides are similar to those of noble metals.18, 19 Therefore, it is highly likely that surface plasmons play a significant role in the enhanced Raman signal observed on ITO NRs, similar to what has been extensively reported in metallic nanoparticles.28 Unlike the 2D ITO systems reported in the literature, our 1D ITO NRs present an extremely high aspect ratio, and this shape factor can be particularly useful for SERS. The Raman signal differences observed in Fig. 3 between ITO-coated glass (2D) versus ITO NR (1D) substrates may be due to this difference in the length to diameter ratio of the support materials. Very recently, several studies have reported on the effect of nanoparticles shapes in SERS activity and have pointed out that field enhancement is very sensitive to the geometry of the nanostructures on a SERS substrate.28 For example, SERS activities of cubic or cauliflower-like particles are much greater than that of spherical ones under the same excitation condition.3, 12 The three-dimensional finite difference time domain (3D-FDTD) theory, calculating local electromagnetic fields of transition metal surfaces when compared to the free electron metals, has effectively explained the experimentally observed phenomena.3, 12, 22, 29 The increased electromagnetic fields of non-spherical particles are often referred to as the lighting rod effect near structures of high curvature on a surface. The large anisotropy of the ITO NRs (with an aspect ratio larger 1:375 (width:length)) used in our SERS measurements may intensify this effect even further, leading to higher SERS activity than their isotropic zero-dimensional counterparts and the two dimensional ITO thin films.
In summary, we have determined SERS activity observed on 1D metal oxide NRs. We demonstrate that significant enhancement in Raman intensities is observed from varying concentrations of pure and mixed R6G and DAPI molecules on ITO NRs. Our approach signifies the first attempt to assess the SERS capability of well-defined 1D metal oxide NRs and to further develop as effective SERS active substrates.
Acknowledgments
The authors acknowledge financial support on this work by the National Institutes of Health, National Research Service Award (1R01DK088016-01) from the National Institute of Diabetes and Digestive and Kidney Diseases and by the Georgetown University-Chinese Science Council (CSC) postdoctoral program. S.Z. and Y.G. are Georgetown-CSC postdoctoral fellows.
References
- Campion A. and Kambhampati P., Chem. Soc. Rev. 27, 241–250 (1998). 10.1039/a827241z [DOI] [Google Scholar]
- Moskovits M., Rev. Mod. Phys. 57, 783–826 (1985). 10.1103/RevModPhys.57.783 [DOI] [Google Scholar]
- Ren B., Liu G. K., Lian X. B., Yang Z. L., and Tian Z. Q., Anal. Bioanal. Chem. 388(1), 29–45 (2007). 10.1007/s00216-007-1141-2 [DOI] [PubMed] [Google Scholar]
- Willets K. A. and Van Duyne R. P., Annu. Rev. Phys. Chem. 58, 267–297 (2007). 10.1146/annurev.physchem.58.032806.104607 [DOI] [PubMed] [Google Scholar]
- Kneipp K., Moskovits M., and Kneipp H., Surface Enhanced Raman Scattering: Physics and Applications (Springer, Berlin, 2006). [Google Scholar]
- Stiles P. L., Dieringer J. A., Shah N. C., and Duyne R. P. V., Annu. Rev. Anal. Chem. 1, 601–626 (2008). 10.1146/annurev.anchem.1.031207.112814 [DOI] [PubMed] [Google Scholar]
- Li Y.-S., Cheng J., and Chung K.-T., Spectrochim. Acta, Part A 69(2), 524–527 (2008). 10.1016/j.saa.2007.04.030 [DOI] [PubMed] [Google Scholar]
- McLintock A., Hunt N., and Wark A. W., Chem. Commun. 47, 3757–3759 (2011). 10.1039/c0cc04353b [DOI] [PubMed] [Google Scholar]
- Zhu C., Meng G., Huang Q., Zhang Z., Xu Q., Liu G., Huang Z., and Chu Z., Chem. Commun. 47, 2709–2711 (2011). 10.1039/c0cc04482b [DOI] [PubMed] [Google Scholar]
- Abdelsalam M. E., Mahajan S., Bartlett P. N., Baumberg J. J., and Russell A. E., J. Am. Chem. Soc. 129, 7399–7406 (2007). 10.1021/ja071269m [DOI] [PubMed] [Google Scholar]
- Mrozek M. F., Xie Y., and Weaver M. J., Anal. Chem. 73, 5953–5960 (2001). 10.1021/ac0106391 [DOI] [PubMed] [Google Scholar]
- Tian Z. Q., Yang Z. L., Ren B., Li J. F., Zhang Y., Lin X. F., Hu J. W., and Wu D. Y., Faraday Discuss. 132, 159–170 (2006). 10.1039/b507773g [DOI] [PubMed] [Google Scholar]
- Tian Z. Q., Ren B., and Wu D. Y., J. Phys. Chem. B 106(37), 9463–9483 (2002). 10.1021/jp0257449 [DOI] [Google Scholar]
- Yang Y., Qiu T., Ou H., Lang X., Xu Q., Kong F., Zhang W., and Chu P. K., J. Phys. D: Appl. Phys. 44, 215305 (2011). 10.1088/0022-3727/44/21/215305 [DOI] [Google Scholar]
- Hurst S. J., Fry H. C., Gosztola D. J., and Rajh T., J. Phys. Chem. C 115(3), 620–630 (2010). 10.1021/jp1096162 [DOI] [Google Scholar]
- Franzen S., Rhodes C., Cerruti M., Gerber R. W., Losego M., Maria J.-P., and Aspnes D. E., Opt. Lett. 34(18), 2867–2869 (2009). 10.1364/OL.34.002867 [DOI] [PubMed] [Google Scholar]
- Rhodes C., Franzen S., Maria J.-P., Losego M., Leonard D. N., Laughlin B., Duscher G., and Weibel S., J. Appl. Phys. 100, 054905 (2006). 10.1063/1.2222070 [DOI] [Google Scholar]
- Franzen S., J. Phys. Chem. C 112, 6027–6032 (2008). 10.1021/jp7097813 [DOI] [Google Scholar]
- Kanehara M., Koike H., Yoshinaga T., and Teranishi T., J. Am Chem. Soc. 131, 17736–17737 (2009). 10.1021/ja9064415 [DOI] [PubMed] [Google Scholar]
- Dominici L., Michelotti F., Brown T. M., Reale A., and Di Carlo A., Opt. Express 17(12), 10155–10167 (2009). 10.1364/OE.17.010155 [DOI] [PubMed] [Google Scholar]
- Xu L., Kuang H., Xu C., Ma W., Wang L., and Kotov N. A., J. Am. Chem. Soc. 134(3), 1699–1709 (2011). 10.1021/ja2088713 [DOI] [PMC free article] [PubMed] [Google Scholar]
- Zhong L., Zhou X., Bao S., Shi Y., Wang Y., Hong S., Huang Y., Wang X., Xie Z., and Zhang Q., J. Mater. Chem. 21, 14448–14455 (2011). 10.1039/c1jm11193k [DOI] [Google Scholar]
- Slaughter L. S., Wu Y., Willingham B. A., Nordlander P., and Link S., ACS Nano 4(8), 4657–4666 (2010). 10.1021/nn1011144 [DOI] [PubMed] [Google Scholar]
- Kumar N., Parajuli O., Feng M., Xu J., and Hahm J.-i., Appl. Phys. Lett. 96, 053705 (2010). 10.1063/1.3309587 [DOI] [Google Scholar]
- Marcolli C. and Calzaferri G., J. Phys. Chem. B 101, 4925–4933 (1997). 10.1021/jp9707596 [DOI] [Google Scholar]
- Jana N. R., Small 1(8–9), 875–882 (2005). 10.1002/smll.200500014 [DOI] [PubMed] [Google Scholar]
- Jana N. R., Gearheart L., and Murphy C. J., J. Phys. Chem. B 105(19), 4065–4067 (2001). 10.1021/jp0107964 [DOI] [Google Scholar]
- Gersten J. and Nitzan A., J. Chem. Phys. 7, 3023–3037 (1980). 10.1063/1.440560 [DOI] [Google Scholar]
- Palik E. D., in Handbook of Optical Constants of Solids (Academic, New York, 1985). [Google Scholar]


