Abstract
Purpose: Motion-compensated temporal processing can have a major impact on improving the image quality in gated cardiac single photon emission computed tomography (SPECT). In this work, we investigate the effect of different optical flow estimation methods for motion-compensated temporal processing in gated SPECT. In particular, we explore whether better motion estimation can substantially improve reconstructed image quality, and how the estimated motion would compare to the ideal case of known motion in terms of reconstruction.
Methods: We consider the following three methods for obtaining the image motion in 4D reconstruction: (1) the Horn–Schunck optical flow equation (OFE) method, (2) a recently developed periodic OFE method, and (3) known cardiac motion derived from the NURBS-based cardiac-torso (NCAT) phantom. The periodic OFE method is used to exploit the inherent periodic nature in cardiac gated images. In this method, the optical flow in a sequence is modeled by a Fourier harmonic representation, which is then estimated from the image data. We study the impact of temporal processing on 4D reconstructions when the image motion is obtained with the different methods above. For quantitative evaluation, we use simulated imaging with multiple noise realizations from the NCAT phantom, where different patient geometry and lesion sizes are also considered. To quantify the reconstruction results, we use the following measures of reconstruction accuracy and defect detection in the myocardium: (1) overall error level in the myocardium, (2) regional accuracy of the left ventricle (LV) wall, (3) accuracy of regional time activity curves of the LV, and (4) perfusion defect detectability with a channelized Hotelling observer (CHO). In addition, we also examine the effect of noise on the distortion in the reconstructed LV wall shape by detecting its contours. As a preliminary demonstration, these methods are also tested on two sets of clinical acquisitions.
Results: For the different quantitative measures considered, the periodic OFE further improved the reconstruction accuracy of the myocardium compared to OFE in 4D reconstruction; its improvement in reconstruction almost matched that of the known motion. Specifically, the overall mean-squared error in the myocardium was reduced by over 20% with periodic OFE; with noise level fixed at 10%, the regional bias on the LV was reduced from 20% (OFE) to 14% (periodic OFE), compared to 11% by the known motion. In addition, the CHO results show that there was also improvement in lesion detectability with the periodic OFE. The regional time activity curves obtained with the periodic OFE were also observed to be more consistent with the reference; in addition, the contours of the reconstructed LV wall with the periodic OFE were demonstrated to show less degree of variations among different noise realizations. Such improvements were also consistent with the results obtained from the clinical acquisitions.
Conclusions: Use of improved optical flow estimation can further improve the accuracy of reconstructed images in 4D. The periodic OFE method not only can achieve improvements over the traditional OFE, but also can almost match that of the known motion in terms of the several quality measures considered.
Keywords: optical flow, 4D reconstruction, spatiotemporal processing, gated cardiac SPECT
INTRODUCTION
In nuclear cardiology, single photon emission computed tomography (SPECT) plays an important role for detection and evaluation of coronary artery disease. It can provide information of both myocardial perfusion and ventricular function.1 In gated SPECT, the data acquisition is divided into multiple time intervals according to the electrocardiogram (ECG) signal, and images are reconstructed for the different time intervals. Gated SPECT can further provide valuable functional information such as ejection fraction, wall motion, and wall thickening.
However, due to reduced data counts associated with gating, gated SPECT images suffer from significantly increased noise compared to standard SPECT. In recent years, a number of different spatiotemporal methods have been studied to improve the image quality in gated SPECT, e.g., Refs. 2, 3, 4, 5, 6, 7, 8. Collectively, these methods are known as 4D methods in the literature. A common theme among these different methods is to introduce an additional processing for the gate (i.e., temporal) dimension besides the traditional three spatial dimensions, the purpose of which is to exploit the correlation of the signal components among the different gates in a cardiac sequence for noise reduction.
A key issue associated with temporal processing in 4D reconstruction is the use of a temporal prior to enforce smoothing among the different gate frames. For example, a Bayesian estimation approach was proposed in Ref. 3 for reconstruction of gate frames based on a prior motion model. In Refs. 5 and 6, a joint reconstruction framework was presented in which motion estimation and image reconstruction were performed in an alternating fashion. In Ref. 7, we introduced a reconstruction approach in which a temporal prior was defined in the form of motion-compensation, where the motion was estimated from the image data using the classical optical flow method.9 Besides gated imaging, motion is also a key factor in other imaging applications. For example, in Ref. 10 motion compensation was used for correction of respiratory motion of the thorax in list-mode PET. In Ref. 11, the optical flow method was applied to deal with the partial volume effect in cardiac PET.
Recently in Ref. 12, we investigated the effects of various degrading factors in gated SPECT, ranging from depth-dependent spatial blur, attenuation, scatter, and motion blurring, on the reconstructed images with several reconstruction methods. It was demonstrated that the use of temporal processing in 4D reconstruction can lead to the most significant improvement in gated images when compared to several other factors. Motivated by this result, in this work we investigate whether we can further improve the temporal prior in 4D for temporal processing.
Ideally, the temporal prior in 4D should enforce smoothing along the trajectories of cardiac motion in order to avoid motion blur. However, in practice this motion information is not readily available, and has to be estimated from the image data. Conceivably, an improved estimation of the motion information for the temporal prior is expected to also lead to improved accuracy in the reconstructed images. In this work, we will conduct a quantitative evaluation study of the effects of motion estimation on 4D reconstruction. We will consider optical flow methods for motion-compensated temporal processing. In particular, we ask the following important questions: Does better motion estimation substantially improve reconstructed image quality? Moreover, how does estimated motion compare to the ideal case of known motion in terms of reconstruction?
Toward this goal, we will consider two optical flow methods for the purpose of comparison, one is the classical optical flow equation (OFE) method9 used previously in Ref. 7, and the other is a periodic OFE method we developed recently in Ref. 13. The latter method can be viewed as an extension of the classical OFE to a periodic image sequence. In this approach, a Fourier harmonic model is used to regulate the temporal behavior of the optical flow in a periodic sequence, and the optical flow is determined simultaneously for the entire sequence by estimating the parameters of the harmonic model. This approach was first proposed in Ref. 14, and further developed in Ref. 13 by exploring a piecewise smoothness constraint based on the total variation (TV) of the motion field. This piecewise smoothing property potentially can better accommodate the discontinuities in the motion field associated with an object boundary.15 It can be desirable for modeling the motion of the heart wall, which can differ greatly from that of nearby organs (i.e., the liver which can have high uptake).
In our evaluation study, we will use simulated imaging with the NURBS-based cardiac-torso (NCAT) phantom,16 wherein the ground truth is known for quantitative evaluation. Moreover, the motion trajectories of a set of anchor points on the left ventricular wall are also provided in NCAT. The NCAT phantom was modeled from real patients, in which the geometry of different organs was based on the 3D Visible Human CT dataset, and the cardiac motion was modeled from 4D tagged MRI acquired from normal subjects.16 In our experiments, these known trajectories are used to derive the motion for the temporal prior. Thus, the reconstruction with this known motion serves as an upper bound for comparison with that from estimated motion as described above.
In the experiments, we apply multiple noise realizations obtained from two sets of NCAT data with different patient geometry, one male and one female, of which the latter has significantly higher breast attenuation. For lesion detection, perfusion defects of different sizes, contrasts, and locations are introduced in the phantoms. We conduct a thorough quantitative evaluation of the reconstructed myocardium using a number of metrics: (1) overall accuracy of the myocardium, (2) regional accuracy of the left ventricular (LV) wall through bias-variance analyses, (3) accuracy of regional time activity curves (TACs), (4) perfusion lesion detectability quantified by a channelized Hotelling observer (CHO).17 Furthermore, as an indicator of distortion in the reconstructed LV wall, we also examine the shape of the LV wall by detecting its contours. As a preliminary demonstration, we also reconstruct two clinical acquisitions using the different motion models.
METHODS
To facilitate the presentation of the material in this section we will begin with a brief description of the 4D reconstruction method used in this study. We will then present the different motion estimation methods considered for 4D reconstruction. Afterward we will describe the different metrics for quantitative evaluation of the reconstruction results, followed by a description of the image datasets used for evaluation.
4D reconstruction
In gated cardiac SPECT, the acquired projection data are binned into K cardiac intervals by using the ECG signal. The imaging data are described by the following model:
| (1) |
in which gk, fk, and rk are vectors representing the acquired data, original image, and expected scatter component, respectively, of the kth gate interval, E[·] is the expectation operator, and H is a matrix describing the imaging system (a.k.a system matrix). In H, each element hij represents the probability that a photon emitted at voxel location j is detected at detector bin i without being scattered. In this study, both the depth dependent blur and attenuation effects are modeled in the system H.12
In 4D reconstruction, the different gates fk, k = 1, …, K, are treated as a single entity and determined simultaneously from the projection data gk, k = 1, …, K. Specifically, let , i.e., a vector consisting of all the gate frames; similarly, let . Then F is obtained with maximum a posteriori (MAP) estimation as
| (2) |
where p(G|F) is the likelihood function of G parameterized by F, and p(F) is a prior distribution on F.
We use a separable Gibbs prior for p(F), which is defined in the following:
| (3) |
where Us(F) and Ut(F) are two energy functions defined over space and gate intervals, respectively, and βs and βt are their corresponding scalar weighting factors.12
In Eq. 3, the energy function Ut(F) is used to enforce temporal smoothing among the different gate frames. It is defined as
| (4) |
where Ml→k denotes the motion-compensated prediction operator from gate frame l to frame k, C is a normalization constant for the weighted temporal prediction to have unit dc gain, and ‖·‖ is the l2 norm. The above definition is to penalize the difference in image intensity along the trajectories of a given point. The weighting coefficients are so defined that temporally neighboring frames will have more contribution to the current frame than frames that are further away.
The operator Ml→k in Eq. 4 depends on the relative image motion from gate frame l to frame k. This is rarely known in practice and has to be estimated from the available image data. As mentioned in the Introduction, the purpose of this study is to evaluate several motion estimation methods for 4D reconstruction, which we introduce in the following.
Image motion models
For comparison, we consider the following three methods for obtaining the image motion in 4D reconstruction: (1) Horn–Schunck optical flow method,9 (2) periodic optical flow method developed recently in Ref. 13, and (3) known motion directly from the NCAT phantom. For convenience, in the following we first describe briefly the Horn–Schunck optical flow method, and then extend it to a periodic image sequence as in Ref. 13. We will use 2D notation in the presentation in favor of its simplicity; however, in our experiments the motion estimation is actually implemented in 3D.
Horn–Schunck method
The Horn–Schunck method is based on the fundamental assumption that the image intensity at an object point remains constant along its motion trajectory over time. Consider an image sequence I(x, y, t), where t denotes time and (x, y) denotes a spatial location in image domain D. Let (u, v) denote the displacement vector of point (x, y) from time frame t to (t + 1). That is,
| (5) |
The intensity consistency condition in Eq. 5 alone is not sufficient for determining the displacement vector (u, v) (known as the aperture problem in optical flow estimation). In order to deal with this ill-posed nature of the problem, in the Horn–Schunck method a spatial regularization term is imposed on the motion field. The unknown vector (u, v) is then determined by minimizing the following objective function:
| (6) |
where the first energy term E1(u, v) is to enforce the condition in Eq. 5, and the second energy term E2(u, v) is to enforce spatial smoothness in the solution. The constant coefficient α is used to control the trade-off between the two terms.
Specifically, the term E1(u, v) in Eq. 6 is defined as follows:
| (7) |
which, upon first-order Taylor series approximation, can be rewritten as
| (8) |
where Ix = ∂I/∂x, Iv = ∂I/∂y, and It = ∂I/∂t.
The regularization term E2(u, v) in Eq. 6 is defined as
| (9) |
where ∇ denotes the spatial gradient operator. Such a definition is based on the motivation that spatially neighboring points on an object tend to move together with similar directions.
Periodic optical flow model
In our recent work,13, 14 we extended the optical flow method to periodic image sequences. Such an extension is motivated by the fact that the image motion in a periodic sequence (such as the gate frames in a cardiac cycle, as illustrated in Fig. 1) is inherently periodic over time. In this approach, we directly model the image motion at a spatial location by a periodic Fourier model over the period of the sequence. The image motion is then estimated simultaneously for the entire image sequence by determining the parameters of the Fourier model. This model plays an essential role of incorporating temporal regularization implicitly on the motion field of the sequence. In our preliminary work,13 this period model was demonstrated to be more robust in the presence of imaging noise.
Figure 1.
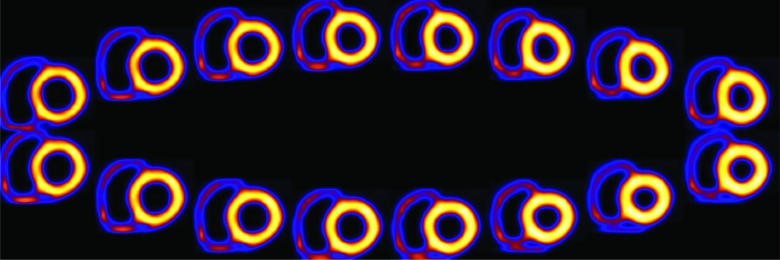
Illustration of a sequence of 16 gate frames in short-axis view. For clarity, the background activity is not shown. First row: gates 1 to 8 (left to right); second row: gates 9 to 16 (right to left).
Consider I(x, y, t) a periodic image sequence with period T, that is, I(x, y, 0) = I(x, y, T). Our goal is to determine the motion field (u, v) for all the time frames t = 0, …, T − 1.
Based on Fourier series expansion, we model the motion components (u, v) at location (x, y) over time t as
| (10) |
where al(x, y), bl(x, y), cl(x, y), and dl(x, y) are the coefficients associated with harmonic component l, , and L is the number of harmonics used.
In Eq. 10, it is assumed that the net displacement at a point (x, y) is zero over the time period T, and thus, no dc component is included. However, this component can be easily accommodated when it is present. The representation model in Eq. 10 can be advantageous in several aspects. First, by varying the number of high order harmonics used in the model, it can achieve different degrees of temporal smoothing of the motion field. Moreover, it can also allow one to directly incorporate a temporal smoothing scheme in a spatially-adaptive fashion on the motion field by varying the model order in different regions of the image domain.
Our goal then is to determine the model coefficients al(x, y), bl(x, y), cl(x, y), and dl(x, y), l = 1, … , L, in Eq. 10. Let a, b, c, and d denote the collection of coefficients al(x, y), bl(x, y), cl(x, y), and dl(x, y), respectively. We seek a simultaneous solution by minimizing the following objective function:
| (11) |
where the two energy terms are defined in detail below.
The first energy term in Eq. 11 is used to enforce the constancy condition in Eq. 5 between all consecutive frames throughout the whole sequence. It can be written from Eq. 8 as
| (12) |
By substituting the model in Eq. 10 into Eq. 12, and upon some algebraic manipulation, we obtain
| (13) |
where , , , and .
The second energy term in Eq. 11 is to used to enforce spatial regularization. With the periodic representation, this regularization term is defined directly on the model coefficients al, bl, cl, and dl. Specifically,
| (14) |
Note that in Eq. 14 the L1 norm of the gradient terms is used. The energy term E2 is formed by the total-variation of the model coefficients. Such a definition is out of the consideration to better accommodate piecewise discontinuities in the motion field (e.g., along the object boundaries).15 The numerical algorithm for optimization of the objective function in Eq. 11 is given in Appendix A.
Known motion from NCAT
As an upper bound on the performance of the estimated motion for 4D reconstruction, we also use the known motion vectors derived from the NCAT phantom. In NCAT, the motion trajectories of a set of premarked reference points on the heart wall are given over the different gate frames. The motion vectors at these premarked reference points are used to interpolate the motion vectors (with distance weighting) at integer voxel locations on the heart wall.
Numerical evaluation metrics
Overall error level of myocardium
To quantify the overall accuracy of the reconstructed myocardium, we compute the mean square error (MSE) of the reconstructed images of a 30 × 28 × 20 volumetric region containing the entire LV, of which a 2D slice is shown in Fig. 2. The MSE of this region is computed and averaged over all the K gate frames. The detailed definition of MSE is given in Appendix B.
Figure 2.
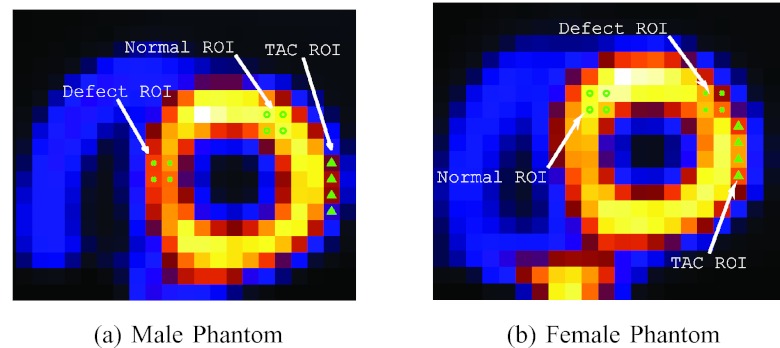
Regions of interest (ROIs) defined in the two phantoms for bias-variance, CHO, and TAC. These are from original source distributions; (a) and (b) are in short-axis slices.
Regional bias-variance analyses
To quantify the regional accuracy of the reconstructed LV, we conduct bias-variance analyses on regions of interest (ROIs) selected on the LV wall as shown in Figs. 2a, 2b. Such analyses provide results on both the bias and variance levels of the regional intensity of the LV wall in the reconstruction. In our experiments, a total of Q = 30 noise realizations were used. A detailed description of the bias-variance analysis procedure is given in Appendix B.
Time activity curve
In order to demonstrate the effect of potential temporal smoothing on cardiac motion, we also calculate the TAC of a ROI near the base of the LV myocardium shown in Figs. 2a, 2b. As the wall moves in and out of this ROI during the beating cycle, the intensity of the ROI will vary accordingly, and thus, serves as a good indicator on the degree of temporal smoothing. To quantify the accuracy of the reconstructed TAC of the ROI, we compute the normalized cross-correlation coefficient (CC) between the reconstructed TAC and its ideal reference. The definition of CC is given in Appendix B.
LV surface contour
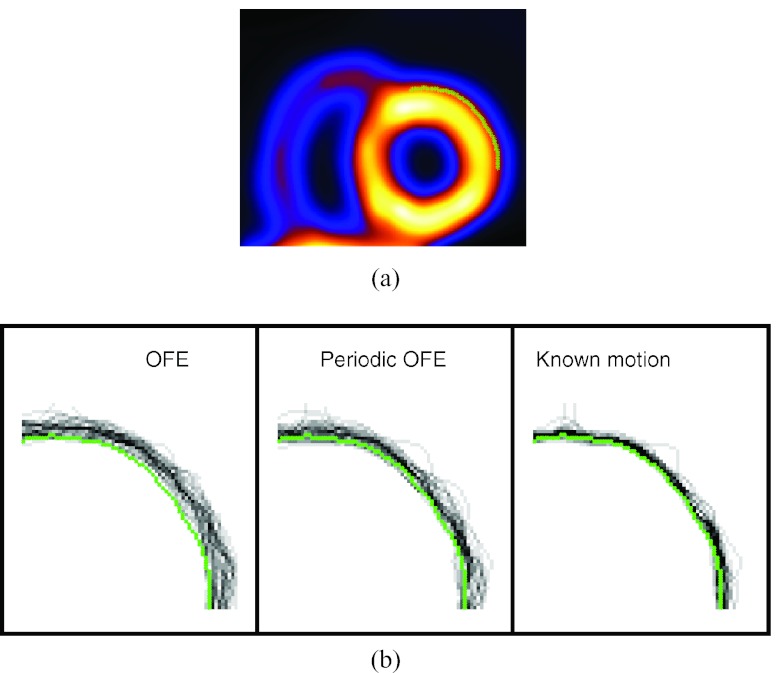
The presence of strong noise in gated images is known to cause distortion in the wall shape of the reconstructed LV. The noise pattern can vary greatly among the different gates, which exhibits as “boiling” noise when displayed in cine. To demonstrate the effect of motion compensation on reducing this noise pattern, we examine the geometric shape of the LV surface in the reconstruction. To characterize the geometric shape, we apply a boundary detector to find the surface of the LV from the reconstructed images. To illustrate this, in Fig. 3a we show a segment of the boundary contour of the epicardial surface of the LV in a 2D slice (obtained from the ideal reference). The Laplacian of Gaussian operator is applied to detect this contour which corresponds to the location of zero-crossings in the detector output.18
Figure 3.
Contour plots of reconstructed LV by different motion models: (a) reference contour of a slice on the epicardial surface of the anterior-lateral wall of the LV near the end-diastole (ED) phase; (b) contours obtained from 30 noise realizations of the same slice with different motion models.
Lesion detectability
To quantify lesion detectability in the reconstructed images, which is relevant to diagnostic accuracy, a CHO is used.17 In the CHO, four rotationally symmetric, nonoverlapping input channels are used and internal noise is included as in Ref. 19. In our experiments a total of 60 noise realizations (30 lesion-present and 30 lesion-absent) were used and the reconstructed images by each method were assessed by the CHO. The detection performance was summarized using the area under the receiver operating characteristic (ROC) curve (denoted as Az). These ROC studies represented a “signal-known exactly” and “background-known exactly” observer study.
It is noted that lesion detection is mostly conducted on ungated images in the literature because of the high noise level in conventional gated images. However, this also ignores the cardiac motion which could potentially cause blurring of the defect. As demonstrated in our previous study,12 the use of 4D reconstruction with improved noise suppression could lead to improved detectability of perfusion defects in individual gate frames. To demonstrate the effect of motion compensation on gated images, in this study the CHO is used to evaluate the lesion detectability in gated images. In our experiments, the CHO results were reported for the first gate (end-diastole) frame during which the heart wall is expanded and small lesions are easier to be seen.
Image data sets
Phantom simulation
The 4D NURBS-based cardiac-torso (NCAT) 2.0 phantom16 was used to simulate gated SPECT imaging with Tc-99m labeled sestamibi as the imaging agent. The simulation was based on a Philips Prism 3000 SPECT system with a low-energy high-resolution (LEHR) collimator. The projection data were 64 × 64 bins with a pixel size of 0.634 cm. For a circular camera rotation of 28.5 cm radius, 64 projection sets were collected for each gate for a total of 16 gates. The average spatial resolution at the location of the heart in the image slices was approximately 1.3 cm in full-width at half-maximum (FWHM). Monte-Carlo simulation with SIMIND (Ref. 20) was used for the projection data. Poisson noise at a level of 8 × 10⁶ total counts was introduced for the entire acquisition as in a typical clinical acquisition. The following relative activity levels were introduced for the different organs: heart (ventricular and atrial walls) 1.0, liver 1.0, kidney 1.0, spleen 1.0, gall bladder 0.8, and tissue background 0.053. Attenuation, scatter, and detector response effects were all included in the simulation data. In the reconstruction, both attenuation and detector depth-dependent blur effects were directly modeled in the system matrix in Eq. 1; the scatter component was estimated using the TEW method19 and included in the likelihood function.
A total of 30 noise realizations were used in our evaluation. For motion estimation, the images of the different gates were first prereconstructed independently using fully 3D MAP, which was equivalent to 4D with spatial smoothing alone [i.e., setting βt = 0 in Eq. 3]. The parameter βs with the best MSE results was used. The motion estimation algorithms were then applied to these prereconstructed images. Afterward, the images were reconstructed with the 4D reconstruction algorithm in Eq. 3.
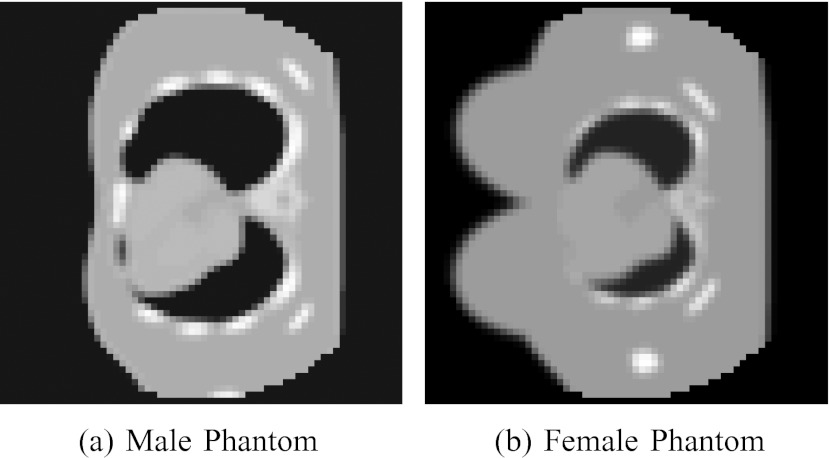
As reference, the gated images were also reconstructed from the noiseless projection data (without attenuation and scatter) using the OSEM algorithm (10 iterations, 16 subsets). These images represent the ideal case of perfect acquisition (denoted as “Ideal” below). Two versions of the phantom, one male and one female, were generated; one transverse slice is shown in Fig. 4 for each phantom. The male phantom was generated with the following body dimensions: 35.2 cm, 26.7 cm, and 41.7 cm in long-axis, short-axis, and height, respectively; the corresponding rib dimensions were 30 cm, 22.7 cm, and 37.3 cm, respectively. The female phantom was generated with the same body dimensions, but with the following smaller rib dimensions: 24 cm, 18.2 cm, and 29.8 cm in long-axis, short-axis, and height, respectively; the corresponding breast dimensions were 18.2 cm, 7.0 cm, and 14.0 cm, respectively. Consequently, the female phantom suffers from more significant breast attenuation. For each phantom, two datasets were generated, one with a lesion and the other without. For the male phantom, a transmural perfusion defect with 20% intensity reduction was introduced in the septal wall of the LV. For the female, a transmural perfusion defect with 50% intensity reduction was introduced in the anterior-posterior region of the LV. These defect locations are shown in Figs. 2a, 2b. Each dataset included 30 noise realizations. There was also a high concentration of activities in the liver. For attenuation correction, the corresponding attenuation map from each phantom was used.
Figure 4.
Transverse slices of (a) male and (b) female phantoms.
Clinical data
As a preliminary demonstration, we also used two sets of clinical data. These studies were under IRB approval with informed content. One was from a 69-year-old female and one was from a 50-year-old male. In clinical interpretations the ECG-gated images show normal wall motion and thickening for both patients. The datasets were acquired by an IRIX system21 with 68 projections (three-degree steps) and a 128 × 128 matrix. The pixel size was 0.467 cm. The acquisition started from right anterior oblique, passed through anterior and left anterior oblique, and ended at left lateral oblique. A total of eight gates were used. The photopeak window was 15% centered at 147.5 keV. The total number of counts acquired was 4.34 ×10⁶ and 12.84 × 10⁶, respectively. For attenuation correction, the attenuation maps were estimated from the transmission images of the patients. Note that in these sets of clinical data the photopeak window was set to be centered at 147.5 keV so that it was asymmetric to the high side in order to decrease scatter within the acquired photopeak window data.22
RESULTS AND DISCUSSIONS
Quantitative accuracy of reconstructed myocardium
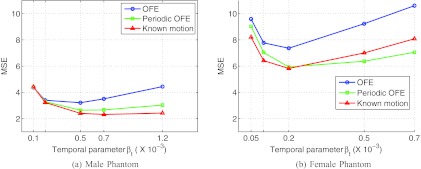
In Fig. 5, we show the MSE results of the reconstructed myocardium with 4D using different motion models. The results are given for each of the two phantoms. In these plots, each curve was obtained by varying the temporal parameter βt as in Eq. 3, while the spatial parameter was kept at βs = 0 (such a setting was based on the optimal results previously obtained in Ref. 12). For each phantom, these MSE results were obtained from the average over 30 different noise realizations.
Figure 5.
MSE of the reconstructed myocardium obtained from 30 noise realizations. (a) Male and (b) female phantoms.
From Fig. 5, it can be seen that the periodic motion model (periodic OFE) yields notably lower MSE than the traditional OFE in both phantoms. As expected, the known motion achieves the smallest MSE among the three methods. However, the periodic model achieved almost a similar MSE level as the known motion in both phantoms. In particular, for the male phantom, the smallest MSE values achieved by the three motion models were 3.21 (OFE, βt = 0.5 × 10⁻³), 2.64 (periodic OFE, βt = 0.5 × 10⁻³), and 2.31 (known motion, βt = 0.7 × 10⁻³), respectively. Similarly, for the female phantom, the achieved smallest MSE values were 7.36 (OFE, βt = 0.2 × 10⁻³), 5.93 (periodic OFE, βt = 0.2 × 10⁻³), and 5.82 (known motion, βt = 0.2 × 10⁻³). It is noted that the MSE level in the female phantom is higher than that in the male phantom, which we believe is caused by the significant breast attenuation in the female phantom.
It is also noted that in Fig. 5b for some βt values the periodic model seemingly could achieve even slightly better results than the known motion. This is likely due to the inherent error in the estimated motion, which causes the impact of the temporal smoothing term to vary with the motion estimation methods. Consequently, it is more meaningful to compare the different methods at their respective optimal settings.
LV regional accuracy
In Fig. 6, we show the results of bias vs standard deviation (std) obtained for the normal ROI on the LV (Fig. 2) in each of the two phantoms. As in the MSE results above, each curve was obtained by varying the temporal parameter βt with βs = 0: βt = [0.1, 0.2, 0.5, 0.7, 1.2] × 10−3 for the male phantom, and βt = [0.05, 0.1, 0.2, 0.5, 0.7] × 10−3 for the female phantom. In these plots the left-end of each curve corresponds to the smallest βt value. These results were obtained from 30 different noise realizations.
Figure 6.
Bias-standard deviation plots for ROIs of the two phantoms, (a) male and (b) female phantoms, from 30 noise realizations.
From these results, it can be seen that with increasing βt the noise level shows a decreasing trend but at the expense of increased bias for all the different motion models. Moreover, periodic OFE achieved a smaller bias than OFE, while the known motion achieved the smallest bias. For example, with std level fixed at 10%, the achieved bias levels by the different motion models were approximately 20% (OFE), 14% (periodic OFE), and 11% (known motion) in the male phantom; similarly, with std level fixed at 10%, the bias levels were approximately 22% (OFE), 18% (periodic OFE), and 17% (known motion) in the female phantom.
In both phantoms, the bias from periodic OFE was closer to that of known motion than OFE. Also, the bias is notably higher in the female phantom than in the male phantom, thanks to the significant breast and diaphragmatic attenuation in the former.
Time activity curve
In Table 1, we show the results of normalized CC between the reconstructed and ideal TACs of the TAC ROI (Fig. 2) obtained with the different motion models. For each motion model, the temporal parameter βt with the best MSE (Fig. 5) was used. These results were based on 30 different noise realizations.
Table 1.
Cross-correlation coefficients between reconstructed and Ideal TACs from 30 noise realizations.
| Methods | Male phantom mean (std) | Female phantom mean (std) |
|---|---|---|
| OFE | 0.7761 (0.0884) | 0.8067 (0.1102) |
| Periodic OFE | 0.9139 (0.0509) | 0.8478 (0.1033) |
| Known motion | 0.9631 (0.0362) | 0.9243 (0.0500) |
The results in Table 1 indicate that the TAC from periodic OFE is more consistent with the ideal TAC than that from OFE, while the known motion achieved the highest CC results in both phantoms. In particular, in the male phantom the CC results from periodic OFE almost matched that from the known motion.
It is noted that the TAC ROI (Fig. 2) is located at the boundary of the lateral wall, which experiences significant motion. The results in Table 1 show that the TAC from periodic OFE also achieved lower std values in CC than that from OFE. This indicates that the TAC from periodic OFE is less sensitive to the variations among different noise realizations. We believe that this is a result of the improved temporal regularization from periodic OFE.
LV wall contour
In Fig. 3b, we show the contours of the epicardial surface of the LV extracted from one slice of the anterior-lateral wall reconstructed with the different motion models. The LV was near the end-diastole phase (gate #1). These results were obtained from 30 different noise realizations, and each curve in Fig. 3b corresponds to the contour from a particular noise realization. For reference, the contour of the ideal reference is also shown. For each motion model, the temporal parameter βt with the best MSE (Fig. 5) was used.
From Fig. 3, we can see that the LV contours from OFE show a larger degree of variation over the different noise realizations than that from periodic OFE; the contours from periodic OFE exhibit an improved agreement with that from the known motion.
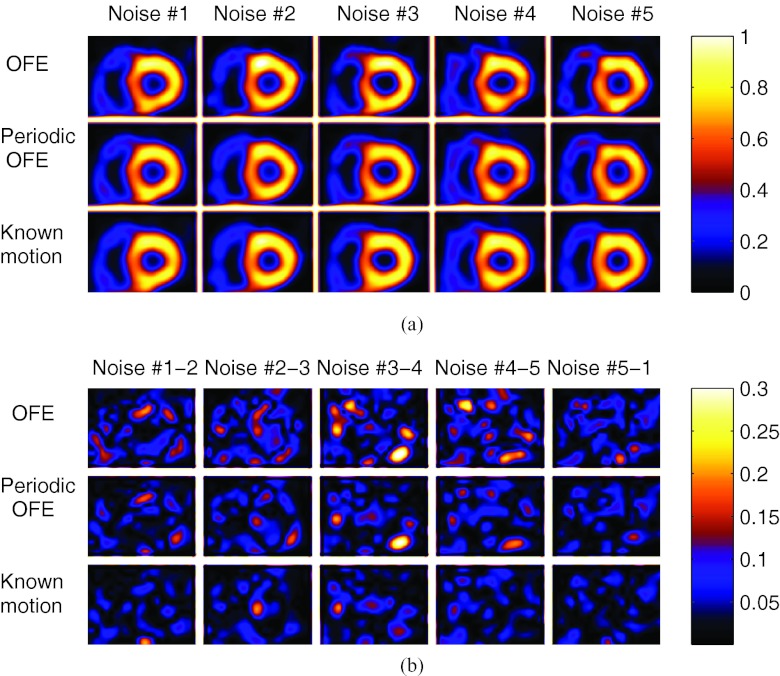
In Fig. 7a, we show the reconstructed images with the different motion models; these images were all from the same gate (gate #1) but from five different noise realizations; to illustrate the sensitivity to noise by different methods, in Fig. 7b we show the pairwise difference images between different noise realizations. In addition, in Fig. 8 we show the reconstructed images of different gates from one particular noise realization by the different methods. As can be seen from these results, the images across the different realizations are more consistent using periodic OFE than OFE, and the reconstructions from periodic OFE are closer to the reconstruction using the known motion. The wall shape also appears more consistent among the different gates in periodic OFE. Owing to the limitation of showing static images, it is difficult to assess the various artifacts in the reconstruction such as boiling noise, LV uniformity, and wall motion which are most visible when viewed in cine. To facilitate better visual assessment of the reconstructed images, we have created a cine display of the reconstruction results in Fig. 7 (see Ref. 24). This cine display demonstrates that the improvement from the periodic method is even more evident. Compared to OFE, the boiling noise is notably reduced and the LV wall appears more uniform in the periodic model. We believe that such improvement is a result of enforcement of temporal coherence in the periodic motion model.
Figure 7.
(a) Reconstructed images of the same slice in ED gate from five different noise realizations; (b) the difference images between different noise realizations, where Noise #1-2 is the absolute difference between Noise #1 and Noise #2 in (a), and similarly for Noise #2-3 and so on.
Figure 8.

Reconstructed images of different gates from one noise realization by different methods.
Lesion detectability
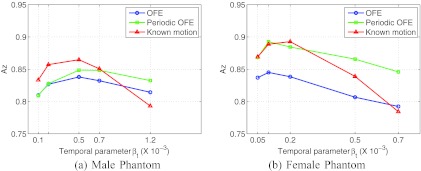
In Fig. 9, we show the lesion detectability results (measured by the CHO) obtained by different motion models. These results were obtained by varying the temporal parameter βt and βs = 0. It can be seen that periodic OFE achieved improved lesion detectability over OFE in both phantoms. In particular, in the male phantom the best Az values achieved by the three motion models are: 0.84 (OFE, βt = 0.5 × 10⁻³), 0.85 (periodic OFE, βt = 0.5 × 10⁻³), and 0.86 (known motion, βt = 0.5 × 10⁻³); in the female phantom the best Az values are 0.84 (OFE, βt = 0.1 × 10⁻³), 0.89 (periodic OFE, βt = 0.2 × 10⁻³), and 0.89 (known motion, βt = 0.1 × 10⁻³).
Figure 9.
CHO detection results of reconstruction with different motion estimation methods.
It is noted that the best Az value obtained with periodic OFE is as high as the known motion in the female phantom. We believe that this could be attributed to the location of the lesion in the female phantom (anterior-lateral wall), which experiences more motion than that in the male phantom (septal wall); the improved motion by periodic OFE in this case has led to increased lesion detectability in the reconstructed images. This is also consistent with the observed improvement in the TAC and LV results above.
Temporal correspondence from optical flow
In this study, the estimated motion is only used to play an intermediate role for defining the temporal prior in Eq. 4, so that the smoothing across the different gates is carried out along a trajectory with similar image intensity values. Therefore, we have focused on evaluating the different motion models based on how they could improve the accuracy of the reconstructed images, which after all is the ultimate goal.
To examine the effect of the motion models, we consider the correspondence error between temporally neighboring frames from the estimated optical flow. Specifically, for gate k, the correspondence error is computed as
| (15) |
Note that this error term was also used in the definition of the temporal prior term earlier in Eq. 4.
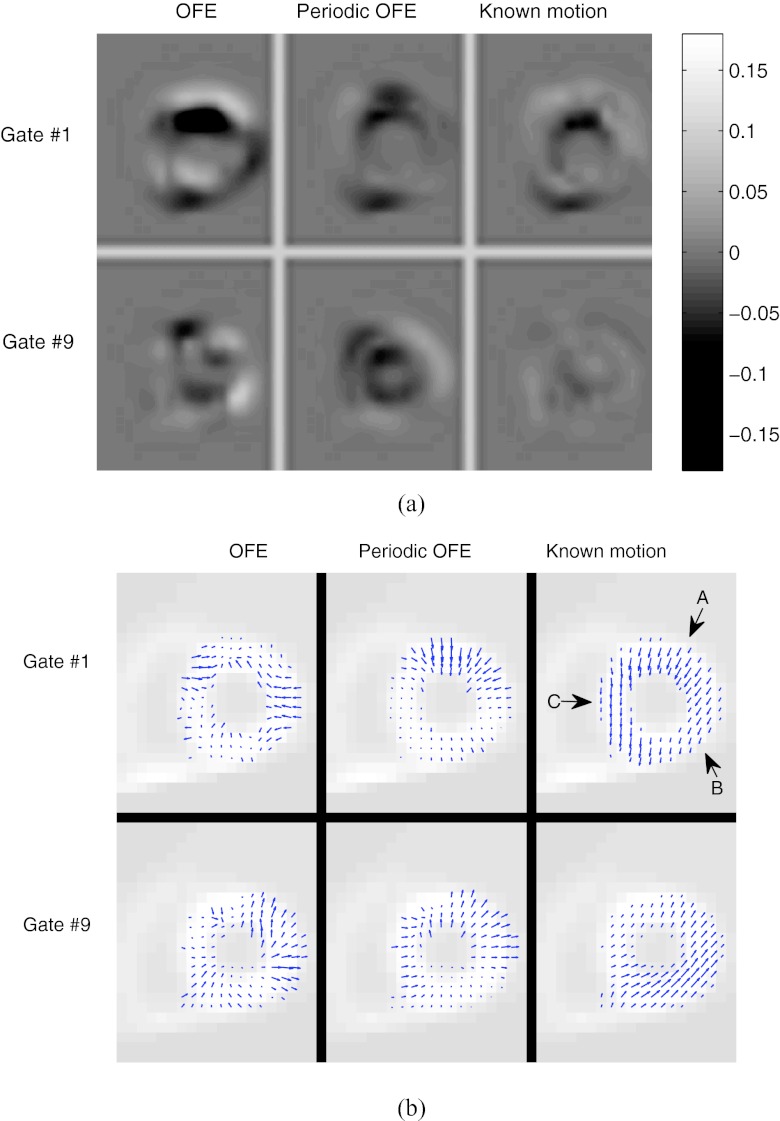
In Fig. 10a, we show a slice of the correspondence error images of two gates (ES and ED) of the male phantom obtained by the different motion models. To minimize the effect of noise, the ideal reference was used for computing the prediction error; however, the underlying motion was estimated from one particular noise realization. In these error images, a dark or bright region indicates the presence of a large correspondence error in that region by the motion model. As can be seen, the error level is notably lower in periodic OFE than in OFE; the error level in Periodic OFE is similar to that of the known motion. The peak values of the error images of the ES gate for the three models are: 0.192 (OFE), 0.077 (periodic OFE), and 0.075 (known motion); similarly, for the ED gate the peak error values are 0.085 (OFE), 0.068 (periodic OFE), and 0.027 (known motion).
Figure 10.
(a) Motion-compensated prediction error images from neighboring frames for two gates (ED and ES) obtained with different motion models from a particular noise realization; (b) estimated motion vectors for the corresponding image slice in (a) from different models.
To help understand the cause of the improvement in correspondence error by periodic OFE, in Fig. 10b we show the estimated motion vectors by the different methods for the corresponding slice in Fig. 10a, where the in-plane vectors are shown for the pixels on the LV wall. For reference, the known motion is also shown; however, as noted earlier in Sec. 2B, the optical flow condition in Eq. 5 is not sufficient for finding the true object motion, and the resulting optical flow only corresponds to the matching of image intensity patterns among the different time frames. Nevertheless, it is interesting to note in Fig. 10b that the radial component of the motion is recovered well in the estimated motion, particularly in periodic OFE (e.g., the section indicated by arrow A); however, the circumferential component is not recovered (e.g., sections indicated by arrows B and C). The latter is expected due to the diminished image gradient along the circumferential direction of the LV wall when the wall intensity is nearly uniform. In this case, the estimated motion can still provide good temporal correspondence in terms of image intensity, as indicated by the results in Fig. 10a.
It is noted that, strictly speaking, the intensity consistency condition in Eq. 5 required by OFE is not exactly satisfied in gated images due to partial volume effects (PVE). To mitigate this effect, in our implementation the motion was determined between only two temporally neighboring gates for which the difference in PVE is small. Moreover, prior to motion estimation, the images were first prereconstructed using fully 3D MAP in which resolution recovery was included. For the clinical data, we also normalized the images to have the same count level among the different gates in order to accommodate the difference in count levels.
Clinical images
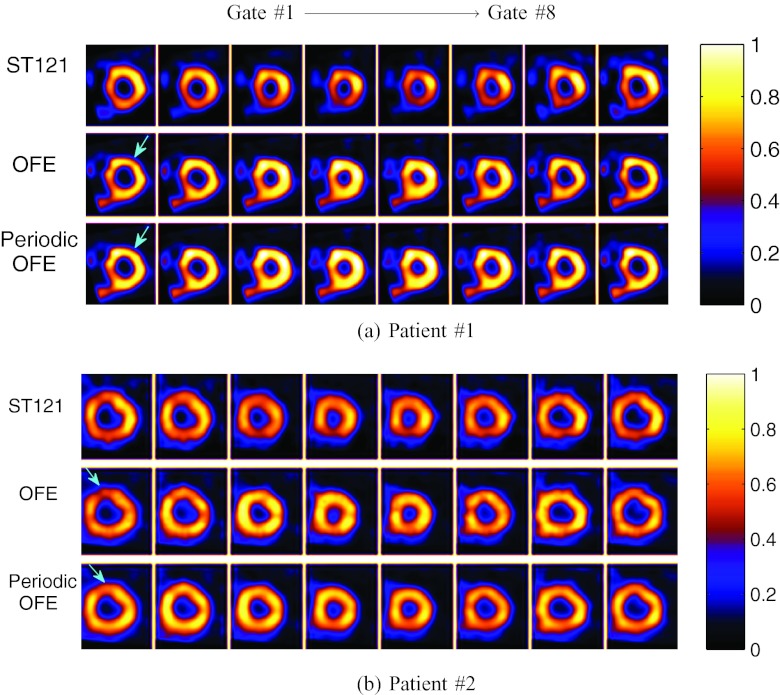
Finally, we show reconstructed images from two sets of clinical acquisitions with different motion estimation methods in Fig. 11. Owing to lack of the ground truth, the parameters βs and βt was chosen empirically, and both OFE and periodic OFE used the same parameter values (βs = 0, βt = 5 × 10⁻⁴). For comparison reconstructed images are also shown for a clinical spatiotemporal processing method (ST121) (Ref. 12); note that neither attenuation nor scatter corrections were used in ST121. From Fig. 11a (e.g., the section indicated by the arrow), it is noticed that the LV wall exhibits more consistency across the different gates in terms of both wall intensity uniformity and wall shape in periodic OFE than in OFE. This can also be observed in Fig. 11b (e.g., the section indicated by the arrow). When viewed in cine, these images are perceived to have less “boiling” noise with periodic OFE than OFE. This is also consistent with the LV contour results obtained above with NCAT images.
Figure 11.
Reconstructed images from two sets of clinical acquisitions by different methods.
CONCLUSIONS
In this work, we conducted a quantitative evaluation on the effects of motion-compensated temporal processing in 4D cardiac SPECT reconstruction. We considered two optical flow methods for determining the temporal prior: the classical Horn–Schunck OFE and a recently developed periodic OFE; for comparison, we also used the known motion derived from NCAT as an upper bound in reconstruction. We quantified the 4D reconstruction using several metrics on different aspects of the myocardium, ranging from overall error level, regional accuracy of the LV with bias-variance analyses, TAC, and lesion detectability. We also examined the surface contour of the reconstructed LV from the different motion models.
The quantitative results demonstrated that periodic OFE could further reduce the overall reconstruction MSE in the myocardium compared with OFE; it could even achieve as small MSE as with the known motion from the NCAT. The bias-variance results showed that periodic OFE could also improve the regional accuracy of the LV; specifically, for a fixed noise level, periodic OFE could yield a bias level that was smaller than that of OFE and comparable to that of the know motion. In addition, the CHO results demonstrated that periodic OFE could also improve the lesion detectability over OFE; its detection performance could almost match that of the known motion.
Moreover, the results also showed that the reconstructed TAC by periodic OFE for a ROI on the LV could be more consistent with the ideal reference. The contours of the epicardial surface from periodic OFE exhibited an improved agreement with the ideal reference. This was also demonstrated from the reconstructed images where less variation was observed in the wall shape among different noisy realizations with periodic OFE.
As a preliminary demonstration, we also tested reconstruction with the different motion models on two sets of clinical acquisitions. The reconstructed images were observed to agree with the quantitative results from the simulated NCAT imaging. Encouraged by these results, in the future we plan to conduct further evaluations using a significantly larger set of clinical acquisitions and expert observers.
ACKNOWLEDGMENTS
This work was supported by the National Institutes of Health under Grant No. HL65425.
APPENDIX A: OPTIMIZATION IMPLEMENTATION
The objective function in Eq. 11 involves an L1 regularization term defined in Eq. 14. For its optimization we adopt a duality based approach as in Refs. 15 and 23. In this approach, we introduce auxiliary variables a′, b′, c′, d′ and modify the objective function
| (A1) |
where θ is a small positive constant. Note that the above modified objective function becomes equivalent to the original objective function in Eq. 11 as θ → 0.
The modified objective function in Eq. A1 is minimized with the following alternating procedure:
Step 1: With a′, b′, c′, and d′ fixed, solve for a, b, c, and d from minimizing the following:
| (A2) |
Step 2: With a, b, c, and d fixed, solve for a′, b′, c′, and d′ from minimizing
| (A3) |
Note that the objective function in Eq. A2 is quadratic in terms of a, b, c, and d. It can be solved with a standard gradient descent algorithm. The objective function A3 involves the total-variation regularization term and can be solved by the fast gradient projection method as in Ref. 23. Below we describe this method in more detail.
First, note that the objective function in Eq. A3 can be minimized independently over the individual terms , , , and . In particular, consider . Its solution can be determined from minimizing the following subobjective function:
| (A4) |
The solution of Eq. A4 can be found by the fast gradient projection method23 as follows:
| (A5) |
where v is a vector obtained from the following iterative algorithm:
1. Initially, let iteration index k = 0, and set m1 = v0 = (0, 0)T and t1 = 1;
2. At iteration k = 1, 2, … , do the following update:
| (A6) |
| (A7) |
| (A8) |
3. Set k = k + 1, and repeat Step 2 above until the change between successive iterates of vk is below a preset threshold.
APPENDIX B: DEFINITION OF QUANTITATIVE METRICS
Mean square error
The mean square error (MSE) of a reconstructed ROI is computed as
| (B1) |
where fk and denote the reconstructed ROI and its reference, respectively. Here the l2 norm is used.
Bias-variance analysis
Consider a ROI consisting of M voxels. Let denote the mean intensity of reference image f in the ROI, i.e.,
| (B2) |
Our goal is to quantify the statistical accuracy of an estimate of this quantity from different noisy reconstructions.
Let , q = 1, …, Q, denote estimates of obtained from Q different noise realizations. The mean estimate is computed as
| (B3) |
Then the bias and std of this estimator are, respectively, estimated as
| (B4) |
| (B5) |
Time activity curve
To quantify the accuracy of the TAC of a reconstructed ROI, we compute the normalized CC between the reconstructed TAC and its reference as follows:
| (B6) |
where y = [y(1), …, y(K)]T and are the ideal and reconstructed TACs of the ROI, respectively, and and denote their respective mean values.
References
- Garcia E. V., “Imaging guidelines for nuclear cardiology procedures part I,” J. Nucl. Cardiol. 3, G1–G46 (1996). [PubMed] [Google Scholar]
- King M. A. and Miller T. R., “Use of nonstationary Wiener filter in nuclear medicine,” Eur. J. Nucl. Med. 10, 458–461 (1985). 10.1007/BF00256591 [DOI] [PubMed] [Google Scholar]
- Lalush D. S. and Tsui B. M. W., “Block-iterative techniques for fast 4D reconstruction using a prior motion models in gated cardiac SPECT,” Phys. Med. Biol. 43, 875–886 (1998). 10.1088/0031-9155/43/4/015 [DOI] [PubMed] [Google Scholar]
- Klein G. J., Reutter B. W., and Huesman R. H., “Non-rigid summing of gated PET via optical flow,” IEEE Trans. Nucl. Sci. 44, 1509–1512 (1997). 10.1109/23.632704 [DOI] [Google Scholar]
- Mair B. A., Gilland D. R., and Cao Z., “Simultaneous motion estimation and image reconstruction from gated data,” in Proceedings of the IEEE International Symposium on Biomedical Imaging: Macro to Nano (IEEE, 2002), pp. 661–664.
- Gilland D. R., Mair B. A., Bowsher J. E., and Jaszczak R. J., “Simultaneous reconstruction and motion estimation for gated cardiac SPECT,” IEEE Trans. Nucl. Sci. 49, 2344–2349 (2002). 10.1109/TNS.2002.803820 [DOI] [Google Scholar]
- Gravier E. and Yang Y., “Motion-compensated reconstruction of tomographic image sequences,” IEEE Trans. Nucl. Sci. 52, 51–56 (2005). 10.1109/TNS.2004.843092 [DOI] [Google Scholar]
- Brankov J. G., Yang Y., and Wernick M. N., “Spatio-temporal processing of gated cardiac spect images using deformable mesh modeling,” Med. Phys. 32(9), 2839–2849 (2005). 10.1118/1.2013027 [DOI] [PubMed] [Google Scholar]
- Horn B. K. P. and Schunck B. G., “Determining optical flow,” Artif. Intell. 17, 185–203 (1981). 10.1016/0004-3702(81)90024-2 [DOI] [Google Scholar]
- Lamare F., Carbayo M. J. Ledesma, Cresson T., Kontaxakis G., Santos A., Le Rest C. Cheze, Reader A. J., and Visvikis D., “List-mode-based reconstruction for respiratory motion correction in PET using non-rigid body transformations,” Phys. Med. Biol. 52, 5187–5204 (2007). 10.1088/0031-9155/52/17/006 [DOI] [PubMed] [Google Scholar]
- Dawood M., Brune C., Jiang X., Büther F., Burger M., Schober O., Schäfers M., and Schäfers K. “A continuity equation base optical flow method for cardiac motion correction in 3D PET data,” in MIAR’10, Proceedings of the 5th International Conference on Medical Imaging and Augmented Reality (Springer, 2010), pp. 88–97.
- Niu X., Yang Y., Wernick M. N., Jin M., and King M. A., “Effects of motion attenuation and scatter corrections on gated cardiac spect reconstruction,” Med. Phys. 38(12), 6571–6585 (2011). 10.1118/1.3660328 [DOI] [PMC free article] [PubMed] [Google Scholar]
- Qi W., Niu X., and Yang Y., “An improved periodic optical flow mode for cardiac gated image reconstruction,” in Proceedings of the IEEE International Symposium on Biomedical Imaging: Macro to Nano (IEEE, 2011), pp. 1276–1279.
- Li L. and Yang Y., “Optical flow estimation for a periodic image sequence,” IEEE Trans. Image Process. 19, 1–10 (2010). 10.1109/TIP.2010.2041414 [DOI] [PMC free article] [PubMed] [Google Scholar]
- Zach C., Pock T., and Bischof H., “A duality based approach for realtime tv-l1 optical flow,” in Proceedings of the 29th DAGM Conference on Pattern Recognition (Springer, 2007), Vol. 4713, pp. 214–223.
- Segars W. P., “Development of a new dynamic NURBS-based cardiac-torso (NCAT) phantom,” Ph.D. dissertation, The University of North Carolina, 2001. [Google Scholar]
- Myers K. J. and Barett H. H., “Addition of a channel mechanism to the ideal-observer model,” J. Opt. Soc. Am. A 4(12), 2447–2457 (1987). 10.1364/JOSAA.4.002447 [DOI] [PubMed] [Google Scholar]
- John C., “A computational approach to edge detection,” IEEE Trans. Pattern Anal. Mach. Intell. 8(6), 679–698 (1986). 10.1109/TPAMI.1986.4767851 [DOI] [PubMed] [Google Scholar]
- King M. A., deVries D. J., Pan T.-S., Pretorius P. H., and Case J. A., “An investigation of the filtering of TEW scatter estimates used to compensate for scatter with ordered subset reconstruction,” IEEE Trans. Nucl. Sci. 44, 1140–1145 (1997). 10.1109/23.596978 [DOI] [Google Scholar]
- Ljungberg M. and Srand S.-V., “A Monte Carlo program simulating scintillation camera imaging,” Comput. Methods Programs Biomed. 29, 257–272 (1989). 10.1016/0169-2607(89)90111-9 [DOI] [PubMed] [Google Scholar]
- Gagnon D., Tung C. H., Zeng L., and Hawkins W. G., “Design and early testing of a new medium-energy transmission device for attenuation correction in SPECT and PET,” in Proceedings of the 1998 IEEE Medical Imaging Conference (IEEE, 1999), pp. 1349–1353.
- Atkins F. B., Beck R. N., Hoffer P. N., and Palmer D., “Design and early testing of a new medium-energy transmission device for attenuation correction in spect and pet,” in Symposium on Medical Radioisotope Scintigraphy (International Atomic Energy Agency, Vienna, Austria, 1968), pp. 101–118.
- Beck A. and Teboulle M., “Fast gradient-based algorithm for constrained total variation image denoising,” IEEE Trans. Image Process. 18, 2419–2434 (2009). 10.1109/TIP.2009.2028250 [DOI] [PubMed] [Google Scholar]
- http://mypages.iit.edu/~wqi4/medphy12.htm.


