Abstract
Purpose: To determine the feasibility of three-dimensional (3D) hybrid radial (stack-of-stars) MRI with spatiotemporal total variation (TV) constrained reconstruction for dynamic contrast enhanced myocardial perfusion imaging.
Methods: An ECG-triggered saturation recovery turboFLASH sequence with undersampled stack-of-stars sampling with spatiotemporal TV constrained reconstruction was developed for dynamic contrast enhanced myocardial perfusion imaging. Simulations were performed to study the dependence of the approach to steady state on flip angle and saturation recovery time for this stack-of-stars acquisition. Phantom studies were used to show the effect of the flip angle selection and imperfect spoiling on image qualities. Studies were done in three humans to test the feasibility of the approach for myocardial perfusion imaging.
Results: The simulation and phantom studies showed that imperfect spoiling and magnetization changes during the readout were a function of flip angle and nonoptimized selection of flip angle could degrade the images. Low flip angle acquisitions in the human subjects result in images with good quality similar to multislice radial 2D images.
Conclusions: 3D stack-of-stars sampling with spatiotemporal TV constrained reconstruction provides a promising alternative for myocardial perfusion imaging.
Keywords: total variation, radial acquisition, myocardial perfusion imaging, stack-of-stars
INTRODUCTION
MR myocardial perfusion imaging is an effective method to evaluate perfusion defects and detect cardiac ischemia. Current methods typically provide three to four 2D slices per heartbeat at stress with parallel imaging.1, 2, 3 An echo planar readout can provide more than 10 slice spatial coverage with in-plane spatial resolution as high as 1.5 mm.4 However, echo planar is sensitive to chemical shift and susceptibility effects, which thus far have prevented its use in clinical practice. Large spatial coverage of the heart with high spatial and temporal resolution and good signal-to-noise ratio (SNR) is important to improve the utility of cardiac MRI perfusion. Greater spatial coverage makes it less likely to miss ischemic areas and allows for better sizing of ischemia. High spatial resolution can reduce the dark rim artifact5, 6, 7 which can mimic subendocardial defects.8 High temporal resolution can also be important in reducing dark rim effects and to accurately track signal intensity changes.
Besides parallel imaging techniques, undersampling with sophisticated reconstructions have been proposed to obtain more spatial coverage and higher spatial and temporal resolution for 2D perfusion scans. k-t SENSE methods using Cartesian undersampling have been reported to give good results for 3–4 slices with a net acceleration factor of 3–4 by acquiring 23–33 phase encoding lines.9, 10 Compressed sensing combined with parallel imaging was reported to achieve an acceleration factor of 8 by acquiring 16–24 lines.11 Radial undersampling patterns have been explored due to their robustness to motion and undersampling. A constrained reconstruction method with temporal and spatial total variation (TV) constraints was reported to acquire 10 slices per heartbeat at rest using 24 rays per slice.12 A different reconstruction method (SW-CG-HYPR) was proposed with 16 rays per slice and interleaved slices after each saturation pulse to acquire 6–8 slices per beat.13, 14 Some of these accelerated methods are sensitive to motion, or focus on high spatial resolution and do not achieve high coverage.
Three-dimensional (3D) perfusion MRI might be advantageous compared to 2D in terms of volume coverage and consistent contrast for all slices. 3D also may be more robust to interframe motion and may permit greater undersampling, although the longer 3D readout could be sensitive to cardiac motion. Undersampled 3D Cartesian myocardial perfusion imaging with SENSE reconstruction was reported to provide whole left ventricle (LV) coverage with 10 slices and relatively poor spatial resolution of 3 × 4.4 × 10 mm3 with an acceleration factor of 6, acquiring 110–115 phase encoding lines.15 This 3D method was shown to perform better than 2D multislice imaging for estimating the size of perfusion defects in a phantom.15 However, the limited spatial resolution may make it hard to detect subendocardial ischemia as well as making the acquisition prone to dark rim artifact. Recently, an undersampled 3D acquisition was reconstructed with the k-t PCA method and was reported to obtain an acceleration factor of 7, acquiring 125 phase encoding lines and providing 10 slices with a spatial resolution of 2.3 × 2.3 × 10 mm3.16 A similar approach but using k-t SENSE was reported to give an acceleration factor of 6.3 (Ref. 17) and shown to be useful for detection of ischemia in patients.17
In this paper, a 3D sampling pattern with radial sampling in the kx-ky plane and Cartesian encoding in the kz direction is used. This sampling pattern has been termed 3D hybrid radial sampling or 3D stack-of-stars (3D SOS) sampling, and has been applied to MR angiography applications.18, 19 When using a saturation recovery sequence for perfusion imaging, both 2D and 3D readouts are not at steady state. Due to its longer acquisition, 3D imaging can have more magnetization signal variation for different readouts than 2D, which may result in image artifacts. In this paper, simulations were performed to show the dependence of the signal transients on flip angle and saturation recovery time. Phantom studies were used to analyze the effect of flip angle on image quality. Human studies were performed to further assess the approach.
MATERIALS AND METHODS
3D stack-of-stars acquisition
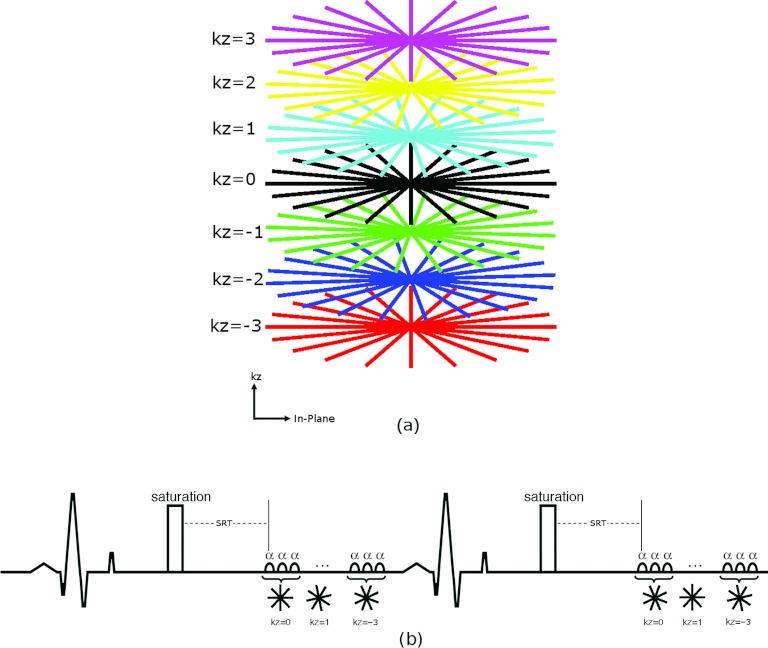
An ECG-triggered, 3D turboFLASH sequence with SOS k-space sampling and saturation recovery preparation as shown in Fig. 1 was used. Figure 1a shows an example of the sampling pattern. The 3D SOS pattern was chosen instead of 3D radial to obtain a cylindrical field of view (FOV) that better matched the heart. For stack-of-stars myocardial perfusion imaging, inconsistent projections can cause severe streaking artifacts in-plane12 and, as with 3D Cartesian imaging, there can be cross talk artifacts in the slice direction. To reduce the effect of inconsistent projections in-plane, the k-space data were acquired by sampling all in-plane radial lines of one partition (one kz encode) with an interleaved pattern, then sampling other partitions as illustrated in Fig. 1b. Centric ordering was applied in the slice (kz) direction. The radial sampling was rotated in the temporal dimension and the slice encoding direction so that with data sharing an evenly distributed fully sampled 3D SOS sampling can be obtained. Such changes in sampling patterns over time are essential for the reconstruction method to be effective.
Figure 1.
(a) Illustration of the stack-of-stars sampling pattern. (b) Schematic diagram for the 3D stack-of-stars acquisition with ECG gating.
Numerical simulations
In order to minimize the signal inconsistencies for 3D SOS imaging, simulation studies were done to determine the optimal acquisition parameters. The signal of the nth readout of saturation recovery turboFLASH is20
| (1) |
where , and SRT is the saturation recovery time between the saturation pulse and the first readout radiofrequency (RF) excitation pulse.
From Eq. 1, it can be demonstrated that, when
| (2) |
Mxy(n) is independent of n and the transverse magnetization Mxy immediately reaches its steady-state value. This is an important insight reported in Ref. 21—the readout of a saturation recovery prepared signal can be obtained immediately at steady state, if SRT and TR and T1 are known and α is selected by Eq. 2. This expression has been given for the case of 2D spiral-based sequences21 and similar work has been done in another context—to use saturation pulses to bring spoiled gradient echo sequences to steady state more rapidly.22 Since T1 is not known a priori, we evaluated the effect of varying T1 on the flip angle given by Eq. 2.
Simulations with physiologically relevant parameters were used to study the effect of nonsteady state readouts in more detail. TR was fixed to 2.5 ms to keep the acquisition time short. For each set of T1 (ranging from 100 ms to 2000 ms with samples every 100 ms), SRT (from 50 ms to 300 ms with samples every 1 ms), and flip angle (from 2° to 30° with interval steps of 0.1°), a signal intensity-readout index curve was determined by Eq. 1 The coefficient of variation (CV), the standard deviation divided by the mean value, was then calculated to evaluate how much the signal varied over the readouts. CV is a measure of the consistency of the signal intensity relative to the readout index, so a perfectly steady-state set of readouts would have CV = 0.
Phantom study
For comparison to the simulation results, a phantom was imaged on a 3T Trio scanner with a 3D saturation recovery turboFLASH sequence with slice encoding turned off. The DC term (the sum of signal intensity over the excited volume) of an 8 cm slab covering the center portion of the cylinder phantom was recorded for 160 readouts after the saturation pulse with SRT = 150 ms, TR = 2.5 ms, TE = 1.39 ms, flip angle α = 8°, 10°, 12°, 14°, and 25°, and FOV = 220 × 220 mm2. The 160 readouts were composed of 8 groups of 20 readouts, which were each composed of 4 sets of interleaved rays (flip angles [0°, 36°, 72°, 108°, 144°], [18°, 54°, 90°, 126°, 162°], [9°, 45°, 81°, 117°, 153°], [27°, 63°, 99°, 135°, 171°]).
To analyze the effect of the transient approach to steady state on the image quality, the same phantom was also imaged with slice encoding turned on. Image acquisition parameters were: SRT = 150 ms, TR = 2.5 ms, TE = 1.39 ms, flip angle α = 10° and 25°, FOV = 220 × 220 mm2, number of rays per slice = 20 in an interleaved fashion with an interleave factor of 5 in the temporal dimension, 8 slices with partial Fourier factor in slice direction = 6/8, slice oversampling factor = 25%, spatial resolution = 1.7 × 1.7 × 10 mm3, total readout time ≈ 300 ms for one time frame. Imaging was performed twice to evaluate the random spoiling effect that has been reported to show better spoiling in 2D radial imaging.23 The first time was with random RF spoiling that was implemented with pseudorandom number generator that generates numbers ranging from 0 to 32 767. The second was with the standard built-in RF spoiling that uses a quadratic phase increment of 50°. Since there were no concentration changes between time frames in the phantom, a sliding window reconstruction method that combined the acquired data in five adjacent time frames and then reconstructed with NUFFT (Ref. 24) was used. The resulting images were used to compare the effect of flip angles and different spoiling methods.
Human study
To determine the feasibility of stack-of-stars sampling in vivo, experiments were performed using a 3T Trio or Verio Siemens scanner under an IRB-approved protocol with an ECG-gated, SOS saturation recovery turboFLASH sequence and a 12-element coil array in three healthy subjects. A dose of 0.015–0.05 mmol/kg of contrast agent (Gd-BOPTA or gadofoveset trisodium), was injected at a rate of 5 ml/s followed by a 25 ml saline flush at the same rate. Based on the simulation results, SRT was set to 140–160 ms, and flip angle was specified to be 10°–14° [which is expected to give an actual flip angle of ∼8°–12° (Ref. 25)]. Other image acquisition parameters were as follows: TR = 2.1–2.9 ms, TE = 1.1–1.4 ms, FOV = (260–360) × (260–360) mm2, number of rays per slice = 20–24 in an interleaved fashion, 8–10 slices with partial Fourier factor in slice direction = 6/8, spatial resolution = (1.8–2.8) × (1.8–2.8) × (6–10) mm3, total readout time ≈ 300 ms for one time frame.
Comparison of 3D SOS and 2D radial
To compare the SNR, both 3D SOS and 2D radial imaging were performed on a cylindrical phantom. The following parameters were used: SRT = 140 ms, TR = 2.6 ms, TE = 1.43 ms, flip angle = 14°, FOV 220 × 220 mm2, the number of projections 20, interleave factor = 5, slice thickness = 10 mm. For 3D, the slice number was 8, and 25% oversampling was performed. For 2D, one slice was acquired. The sliding window reconstruction method described previously was used.
A 2D multislice myocardial perfusion imaging dataset with radial sampling was also acquired in one healthy subject with the same dose of 0.015 mmol/kg of gadofoveset trisodium as with the 3D SOS imaging for comparison. Image acquisition parameters for the 2D sequence were: SRT = 20 ms, TR = 2.3 ms, TE = 1.4 ms, flip angle = 14°, FOV = 360 × 360 mm2, matrix size = 144 × 144, slice thickness = 10 mm, the number of projections = 30, 10 slices were acquired in 1 heartbeat with 5 slices after each saturation pulse. The slices thus had SRTs of 20, 89, 158, 227, 296 ms for each set of 5 slices. The slices with SRT = 158 ms were used for comparing SNR and contrast-to-noise ratio (CNR).
Image reconstruction
After acquiring the 3D human data, the images were reconstructed using spatiotemporal TV constrained reconstruction,12, 26 with the cost function
| (3) |
Here, m(t) represents the complex image estimate for time frame t, t ranges from 1 to the total time frame number Nf, G is a nonuniform FFT applied to all slices24 that transforms images from the x-y-z domain to the kx-ky-z domain, Fz is a Fourier transform in the slice encoding direction that transforms data from the kx-ky-z domain to the kx-ky-kz domain, W(t) is the undersampled binary pattern of time frame t as shown in Fig. 1b, d(t) is the measured k-space data of time frame t. And α, β are the weighting factors of the temporal and spatial TV constraint terms,26, 27 respectively. The gradient descent method was used to minimize the cost function. Different weighting factors for TV constraints were tried on one dataset, and α = 0.7 and β = 0–0.2 were empirically determined after setting the k-space center (the mean image value) to be ∼102. These weights were used to reconstruct other datasets based on the assumption that the reconstruction method was robust to small changes of the weights.28 The initial image estimate was an inverse nonuniform FFT of the undersampled radial data, which is similar to doing filtered backprojection of the undersampled projections. The number of iterations was empirically chosen to be 50. The reconstructed images changed little after 50 iterations. The reconstruction was applied independently to the data obtained from each coil and the reconstructions from each coil were then combined using the square root of the sum of squares. The radial 2D data were reconstructed the same way as the 3D SOS except that it does not use Fourier transform in the slice direction in Eq. 3.
Analysis
For the phantom experiment, SNR were calculated by the ratio of the mean value of a 3 × 3 block from the center signal area of the images and the standard deviation of the signal intensities from a background area.
For the in vivo experiments, the reconstructed images were evaluated using SNR and CNR. SNR was calculated by the ratio of the mean and standard deviation of the signal intensities in a uniform region of the myocardium at peak myocardial enhancement time frame. CNR was computed by (Myopost−Myopre)/σ, where Myopost is the mean of the signal intensities from a uniform region in the myocardium at peak myocardial enhancement time frame, Myopre and σ are the mean and standard deviation of the signal intensities from a similar region in the myocardium in a precontrast time frame.
RESULTS
Numerical simulations
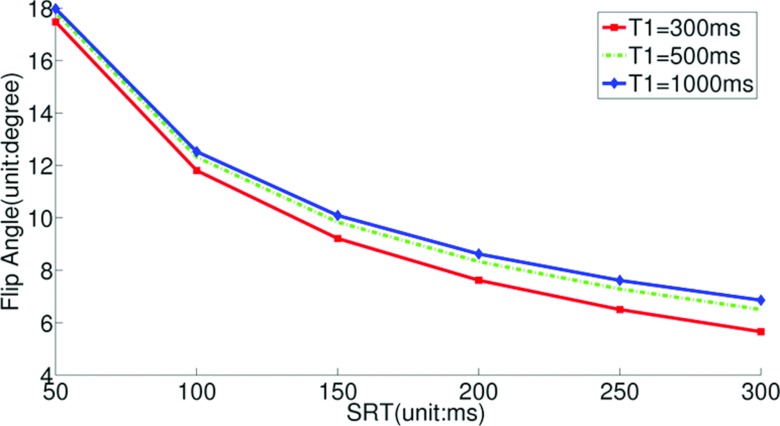
Figure 2 shows the flip angle-SRT plot calculated using Eq. 2 for three different T1 values. This plot shows that for a given SRT, the flip angle depends only weakly on T1.
Figure 2.
The flip angle-SRT plot calculated using Eq. 2 for three different T1 values. The flip angle that gives steady state readouts is relatively insensitive to T1 changes.
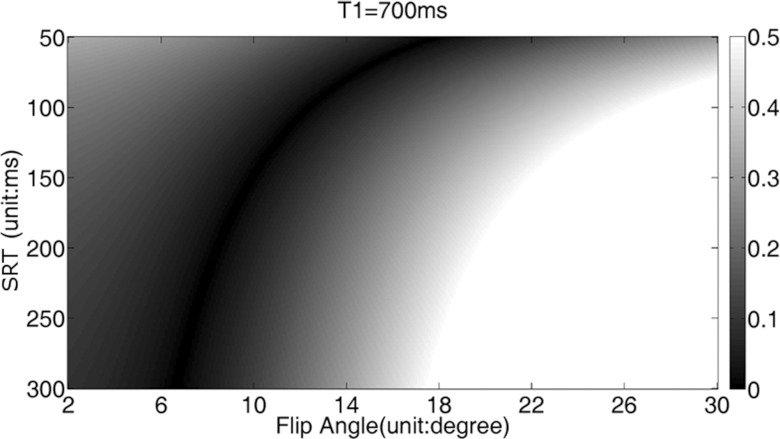
Figure 3 shows the results of CV values obtained from simulations with different SRT and flip angle values using T1 = 700 ms. The sets composed of SRT and flip angle, such as (110 ms, 12°), (150 ms, 10°), and (220 ms, 8°), provide the smallest CV values—meaning those readouts were closest to steady state. Similar results were found for T1 = 300 ms and 1200 ms (not shown here).
Figure 3.
The coefficients of variation with different SRT and different flip angle when T1 = 700 ms and TR = 2.5 ms. The sets composed of SRT and flip angle, such as (110 ms, 12°), (150 ms, 10°), and (220 ms, 8°), provide the smallest CV values.
Phantom studies
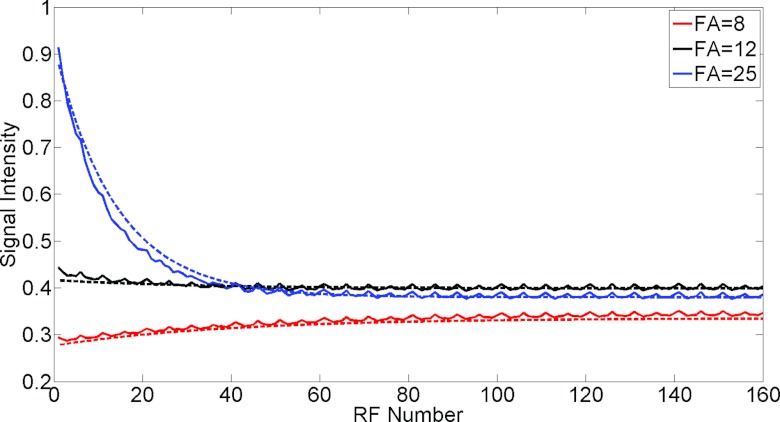
Figure 4 shows the measured signal intensity (DC term) plotted against the readout number. The signal intensity-readout curves as shown by the solid lines are obtained with SRT = 150 ms, TR = 2.5 ms using a 3D saturation recovery turboFLASH sequence with slice encoding turned off and the flip angles α specified as 8°, 12°, and 25°. The periodic fluctuations are consistent with in-plane radial angle (period = five time frames, as described in the methods). The periodic signal fluctuations that are consistent with the flip angle changes are due to the gradient delay effect.29 The effect of the signal fluctuations is negligible as described in Sec. 4. The dashed lines are calculated from Eq. 1 and manually fitted to the solid line. Lower flip angles: 6°, 9°, 18° are used to give better fits. These flip angles are closer to the actual flip angles.30
Figure 4.
The signal intensity changes with readout index acquired with TR = 2.5, SRT = 150 ms and the specified α of 8°, 12°, and 25° are shown by the solid lines, and the signal intensity is calculated by doing linear interpolation to obtain the k-space center for each ray. The dashed lines are calculated from Eq. 1 and manually fitted to the solid line. Lower flip angles: 6°, 9°, 18° are used to give better fits. These flip angles are closer to the actual flip angles (Ref. 30).
Effect of the approach to steady state on image quality
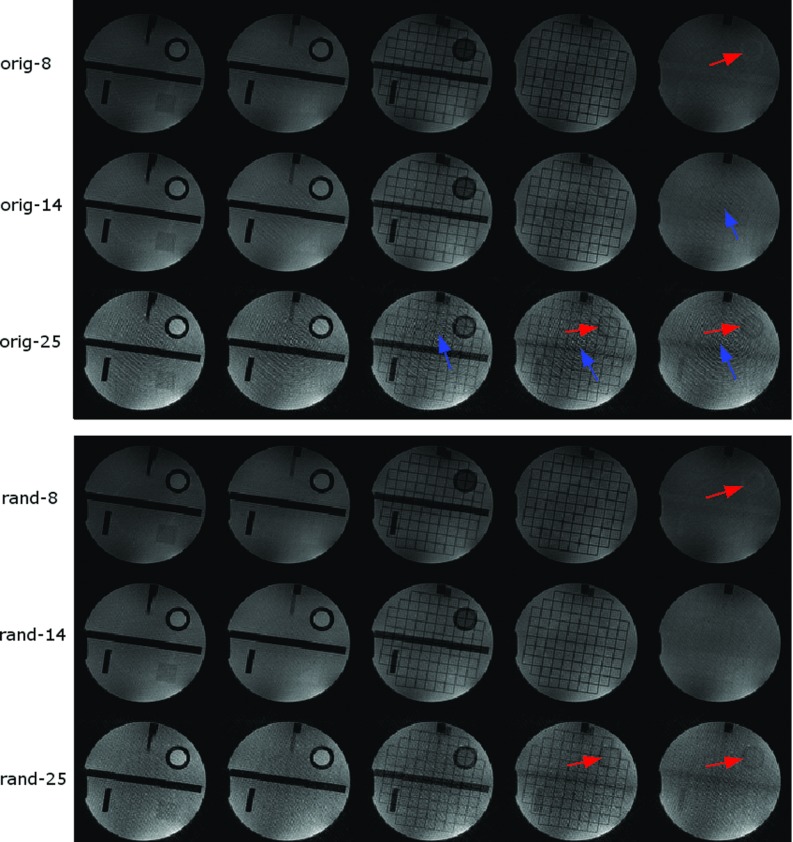
Figure 5 shows the comparison of phantom images acquired with SRT = 150 ms and flip angles of 8°, 14°, and 25° with random RF phase23 and with Siemens built-in RF spoiling with a quadratic phase increment of 50° between RF pulses. The five center slices are shown here. The images acquired with a flip angle of 25° show more cross talk and smearing artifact as indicated by the up and right arrows, respectively. Images with random RF spoiling have less smearing artifact than that with the standard 50° base increment RF spoiling.
Figure 5.
A set of phantom images acquired with SRT = 150 ms and different flip angles with different RF spoiling pattern. The reconstruction is without gradient delay correction. The top three rows are images with the standard (50° base increment) RF spoiling with flip angles of 8°, 14°, and 25° (from top to bottom). The bottom three rows are images with random RF spoiling with flip angles of 8°, 14°, and 25°. The arrows indicate artifacts including cross talk artifact (right arrows) and smearing artifact (up arrows). The center five slices are shown. The cross talk artifact is from signal inconsistency, and the smearing artifact may be from imperfect spoiling.
3D stack-of-stars in human subjects
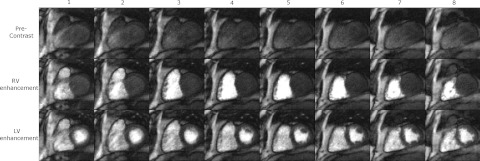
Figure 6 shows three time frames of 3D SOS images acquired from one subject, at precontrast, RV enhancement, and LV enhancement phases after reconstruction with spatiotemporal TV constraints. The different slices show similar contrast and the edge slices show some cross talk artifact.
Figure 6.
One set of eight slices (left to right) and three time frames at precontrast, RV enhancement and LV enhancement phases of 3D myocardial perfusion images from a normal volunteer, each in a different row. A total of eight slice encodings were acquired. Partial Fourier factor = 6/8 in slice direction was used so 10 slices were acquired. The two edge slices with the most aliasing artifacts were not used.
Comparison of 3D SOS and 2D radial
The SNR of cylindrical phantom using 3D SOS and 2D radial imaging of the same slice are 42.7 ± 0.9 and 30.9 ± 1.2, respectively.
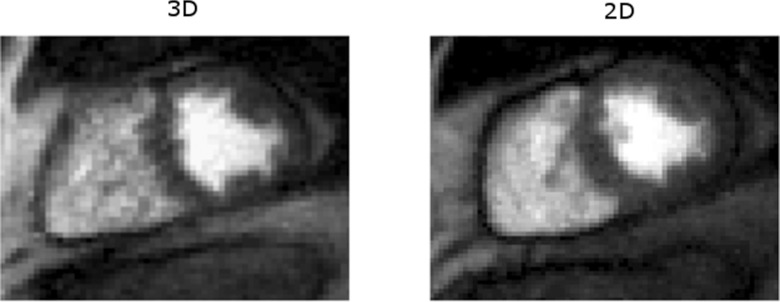
Figure 7 shows the comparison of myocardial perfusion images using 3D SOS and 2D multislice imaging with spatiotemporal TV constrained reconstruction. In this case, 3D SOS with SRT = 140 ms provides a SNR of 21.5 ± 3.0 and a CNR of 7.7 ± 1.0. The radial 2D image with SRT = 158 ms has SNR of 19.8 ± 2.5 and CNR of 7.0 ± 0.8.
Figure 7.
Image comparison of myocardial perfusion imaging using 3D stack-of-stars (left) and radial multislice 2D imaging (right) reconstructed with spatiotemporal TV constraints. Both of the images have high SNR.
DISCUSSION
This paper demonstrated the feasibility of 3D myocardial perfusion imaging using 3D SOS sampling reconstructed with spatiotemporal TV constrained reconstruction to achieve large coverage with high spatial resolution. Simulation and phantom studies were performed to show that the magnetization transient is a function of flip angle and saturation recovery time, and incorrect selection of flip angle and poor spoiling may degrade images. The use of a small flip angle and random spoiling is helpful to reduce image artifacts, as has been reported for 2D radial imaging.23 The main limitation of the study is that no conclusions regarding the clinical benefit of 3D SOS over standard 2D methods can be made from this study.
Compared to 2D multislice myocardial perfusion imaging, 3D myocardial perfusion imaging requires a longer temporal acquisition window. However, it provides volume excitation which may be more robust to through-plane motion and offers contiguous volume coverage, which is reported to be advantageous for sizing perfusion defects.15 The 3D readout is also advantageous because a single, long saturation recovery time can be used for relatively high SNR. For 2D imaging, it is not practical to have a long saturation recovery time unless multiple slices are acquired after a single saturation pulse, in which case the saturation recovery time and image contrast are variable. This issue may be manageable31 but having the same contrast for all of the slices may be an advantage of 3D imaging. SNR measured in vivo is only a relative indicator in this work, because spatiotemporal TV reconstruction may change the noise characteristics of the images. The phantom studies use fully sampled data with a noniterative reconstruction method and thus reflect the standard SNR measurement.
Compared to a 3D Cartesian acquisition, 3D SOS inherits the robustness to undersampling and motion of 2D radial acquisition. However, 3D SOS is more restricted in terms of requiring in-plane isotropic resolution with evenly distributed undersampled projections. For myocardial perfusion imaging, in-plane spatial resolution (maximum kx and ky) is desired to be similar while the resolution in the slice direction (kz) is much coarser, which makes it reasonable to apply a 3D SOS sampling pattern.
The dependence of signal intensity on readout number is determined by flip angle, T1, SRT, and TR. For a saturation recovery spoiled gradient echo pulse sequence with any given set of these parameters, there exists a null point in flip angle where steady-state magnetization is reached immediately (at the first readout). Thus, the degradation of the point spread function (PSF) that arises from readouts that are not at steady state vanishes at the null point, providing the potential for substantially improved image quality. While this is a larger effect with radial imaging due to the repeated sampling of the k-space center, the different weighting of phase encodes in Cartesian readouts also degrades the PSF.32, 33 Spatial variations in T1 and flip angle make it impossible to image at the exact null point for all voxels, but the sensitivity to T1 is weak near the null point (Fig. 2), making it possible to obtain nearly optimal consistency across readouts by flip angle optimization. The existence of this optimal flip angle was tested using measured data, assuming that the T1 and spatial flip angle variation can be ignored (Fig. 4).
Several artifacts arise in the phantom study. The images of 8° and 25° (Fig. 5) show more cross talk than that of 14°. The larger flip angle shows more smearing artifact. The greater cross talk in the slice direction is due to the greater signal variation in the approach to steady state as simulated in Fig. 3. The smearing artifact seen in Fig. 5 may result from imperfect spoiling that has more effect on large flip angle images. This is supported by the experiment that random RF spoiling helps to attenuate the artifact34 as is also seen in Fig. 5. Gradient delays may bring streaking artifacts to radial sampling, and this can be compensated through calibration.35 Figure 8 shows the effect of gradient delays and their reduction using an offset correction. However, this artifact is not obvious in the myocardial datasets and a correction factor was not incorporated beyond the standard implemented in the scanner.36
Figure 8.

One slice of a phantom image reconstructed with and without k-space center offset, and their difference image. The offset of about 0.25 voxels was measured using method described in Ref. 35 and corrected by adjusting this offset in the k-space sampling of the NUFFT reconstruction.
For 3D myocardial perfusion imaging, the slice encoding number is small due to the short acquisition window, resulting in cross talk or Fourier leakage.37 Also, the slab-excitation profile (especially when a fast RF pulse is applied with a small time-bandwidth product) is not perfect which will also degrade edge slices. From our results when reconstructing six or eight kz encodes that were offset (partial Fourier), into eight or ten slices, the outermost slice at each edge of the slab showed significant aliasing. Discarding two slices at each edge left approximately six central slices that appeared to be free of aliasing. It is also possible to shorten the acquisition time by reducing the number of readout lines in the higher slice encoding planes. Preliminary results (not shown) indicate this could enable significantly higher acceleration rates with no cost to image quality.
The reconstruction time is demanding, especially when the dataset size is large. In a MATLAB (The Mathworks, Natick, MA) implementation on a desktop PC, it takes approximately 10 min to reconstruct one slab of 50–60 time frames for one coil. Recently published papers have shown that computationally intensive medical imaging tasks can be processed on a graphics processing unit (GPU) to greatly increase computation speed.38 Taking the advantage of these techniques, clinical implementation could be feasible.
The contributions of this paper include showing the dependence of the transients on flip angle and saturation recovery time, and analyzing the effect of the flip angle on image qualities for 3D SOS perfusion imaging. The initial evaluations show that 3D stack-of-stars myocardial perfusion imaging with spatiotemporal TV constrained reconstruction is a promising alternative to provide images with consistent contrast and contiguous volume coverage of the heart.
ACKNOWLEDGMENT
This work was supported in part by National Institutes of Health (NIH) Grant No. R01EB006155.
References
- Irwan R., Lubbers D. D., van der Vleuten P. A., Kappert P., Gotte M. J., and Sijens P. E., “Parallel imaging for first-pass myocardial perfusion,” Magn. Reson. Imaging 25, 678–683 (2007). 10.1016/j.mri.2006.10.012 [DOI] [PubMed] [Google Scholar]
- Ruan C., Yang S. H., Cusi K., Gao F., and Clarke G. D., “Contrast-enhanced first-pass myocardial perfusion magnetic resonance imaging with parallel acquisition at 3.0 Tesla,” Invest. Radiol. 42, 352–360 (2007). 10.1097/01.rli.0000262566.89636.3f [DOI] [PubMed] [Google Scholar]
- Theisen D., Wintersperger B. J., Huber A., Dietrich O., Reiser M. F., and Schonberg S. O., “Myocardial first pass perfusion imaging with gadobutrol: Impact of parallel imaging algorithms on image quality and signal behavior,” Invest. Radiol. 42, 522–528 (2007). 10.1097/RLI.0b013e3180383572 [DOI] [PubMed] [Google Scholar]
- Debatin J. F., McKinnon G. C., and von Schulthess G. K., “Technical note–Approach to myocardial perfusion with echo planar imaging,” MAGMA (N.Y.) 4, 7–11 (1996). http://www.ncbi.nlm.nih.gov/pubmed/8773996. [DOI] [PubMed] [Google Scholar]
- Di Bella E. V., Parker D. L., and Sinusas A. J., “On the dark rim artifact in dynamic contrast-enhanced MRI myocardial perfusion studies,” Magn. Reson. Med. 54, 1295–1299 (2005). 10.1002/mrm.20666 [DOI] [PMC free article] [PubMed] [Google Scholar]
- Maredia N., Radjenovic A., Kozerke S., Larghat A., Greenwood J. P., and Plein S., “Effect of improving spatial or temporal resolution on image quality and quantitative perfusion assessment with k-t SENSE acceleration in first-pass CMR myocardial perfusion imaging,” Magn. Reson. Med. 64, 1616–1624 (2010). 10.1002/mrm.22493 [DOI] [PMC free article] [PubMed] [Google Scholar]
- Meloni A., Al-Saadi N., Torheim G., Hoebel N., Reynolds H. G., De Marchi D., Positano V., Burchielli S., and Lombardi M., “Myocardial first-pass perfusion: Influence of spatial resolution and heart rate on the dark rim artifact,” Magn. Reson. Med. 66, 1731–1738 (2011). [DOI] [PubMed] [Google Scholar]
- Wilke N. M., Jerosch-Herold M., Zenovich A., and Stillman A. E., “Magnetic resonance first-pass myocardial perfusion imaging: Clinical validation and future applications,” J. Magn. Reson. Imaging 10, 676–685 (1999). 10.1002/(SICI)1522-2586(199911)10:5%3C676::AID-JMRI10%3E3.0.CO;2-L [DOI] [PubMed] [Google Scholar]
- Jung B., Honal M., Hennig J., and Markl M., “k-t-space accelerated myocardial perfusion,” J. Magn. Reson. Imaging 28, 1080–1085 (2008). 10.1002/jmri.21543 [DOI] [PubMed] [Google Scholar]
- Plein S., Ryf S., Schwitter J., Radjenovic A., Boesiger P., and Kozerke S., “Dynamic contrast-enhanced myocardial perfusion MRI accelerated with k-t sense,” Magn. Reson. Med. 58, 777–785 (2007). 10.1002/mrm.21381 [DOI] [PubMed] [Google Scholar]
- Otazo R., Kim D., Axel L., and Sodickson D. K., “Combination of compressed sensing and parallel imaging for highly accelerated first-pass cardiac perfusion MRI,” Magn. Reson. Med. 64, 767–776 (2010). 10.1002/mrm.22463 [DOI] [PMC free article] [PubMed] [Google Scholar]
- Adluru G., McGann C., Speier P., Kholmovski E. G., Shaaban A., and Dibella E. V., “Acquisition and reconstruction of undersampled radial data for myocardial perfusion magnetic resonance imaging,” J. Magn. Reson. Imaging 29, 466–473 (2009). 10.1002/jmri.21585 [DOI] [PMC free article] [PubMed] [Google Scholar]
- Ge L., Kino A., Griswold M., Mistretta C., Carr J. C., and Li D., “Myocardial perfusion MRI with sliding-window conjugate-gradient HYPR,” Magn. Reson. Med. 62, 835–839 (2009). 10.1002/mrm.22059 [DOI] [PubMed] [Google Scholar]
- Ge L., Kino A., Griswold M., Carr J. C., and Li D., “Free-breathing myocardial perfusion MRI using SW-CG-HYPR and motion correction,” Magn. Reson. Med. 64, 1148–1154 (2010). 10.1002/mrm.22489 [DOI] [PubMed] [Google Scholar]
- Shin T., Hu H. H., Pohost G. M., and Nayak K. S., “Three dimensional first-pass myocardial perfusion imaging at 3T: Feasibility study,” J. Cardiovasc. Magn. Reson. 10, 57th article (2008). 10.1186/1532-429X-10-57 [DOI] [PMC free article] [PubMed] [Google Scholar]
- Vitanis V., Manka R., Giese D., Pedersen H., Plein S., Boesiger P., and Kozerke S., “High resolution three-dimensional cardiac perfusion imaging using compartment-based k-t principal component analysis,” Magn. Reson. Med. 65, 575–587 (2011). 10.1002/mrm.22620 [DOI] [PubMed] [Google Scholar]
- Manka R., Jahnke C., Kozerke S., Vitanis V., Crelier G., Gebker R., Schnackenburg B., Boesiger P., Fleck E., and Paetsch I., “Dynamic 3-dimensional stress cardiac magnetic resonance perfusion imaging: Detection of coronary artery disease and volumetry of myocardial hypoenhancement before and after coronary stenting,” J. Am. Coll. Cardiol. 57, 437–444 (2011). 10.1016/j.jacc.2010.05.067 [DOI] [PubMed] [Google Scholar]
- Peters D. C., Korosec F. R., Grist T. M., Block W. F., Holden J. E., Vigen K. K., and Mistretta C. A., “Undersampled projection reconstruction applied to MR angiography,” Magn. Reson. Med. 43, 91–101 (2000). 10.1002/(SICI)1522-2594(200001)43:1%3C91::AID-MRM11%3E3.0.CO;2-4 [DOI] [PubMed] [Google Scholar]
- Wu Y., Korosec F. R., Mistretta C. A., and Wieben O., “CE-MRA of the lower extremities using HYPR stack-of-stars,” J. Magn. Reson. Imaging 29, 917–923 (2009). 10.1002/jmri.21733 [DOI] [PMC free article] [PubMed] [Google Scholar]
- Kholmovski E. G. and DiBella E. V., “Perfusion MRI with radial acquisition for arterial input function assessment,” Magn. Reson. Med. 57, 821–827 (2007). 10.1002/mrm.21210 [DOI] [PubMed] [Google Scholar]
- Salerno M., Sica C. T., Kramer C. M., and Meyer C. H., “Optimization of spiral-based pulse sequences for first-pass myocardial perfusion imaging,” Magn. Reson. Med. 65, 1602–1610 (2011). [DOI] [PMC free article] [PubMed] [Google Scholar]
- Busse R. F. and Riederer S. J., “Steady-state preparation for spoiled gradient echo imaging,” Magn. Reson. Med. 45, 653–661 (2001). 10.1002/mrm.1088 [DOI] [PubMed] [Google Scholar]
- Lin W. and Song H. K., “Improved signal spoiling in fast radial gradient-echo imaging: Applied to accurate T(1) mapping and flip angle correction,” Magn. Reson. Med. 62, 1185–1194 (2009). 10.1002/mrm.22089 [DOI] [PubMed] [Google Scholar]
- Fessler J. A. and Sutton B. P., “Nonuniform fast Fourier transforms using min-max interpolation,” IEEE Trans. Signal Process. 51, 560–574 (2003). 10.1109/TSP.2002.807005 [DOI] [Google Scholar]
- Cunningham C. H., Pauly J. M., and Nayak K. S., “Saturated double-angle method for rapid B1+ mapping,” Magn. Reson. Med. 55, 1326–1333 (2006). 10.1002/mrm.20896 [DOI] [PubMed] [Google Scholar]
- Chen L., Schabel M. C., and DiBella E. V., “Reconstruction of dynamic contrast enhanced magnetic resonance imaging of the breast with temporal constraints,” Magn. Reson. Imaging 28, 637–645 (2010). 10.1016/j.mri.2010.03.001 [DOI] [PMC free article] [PubMed] [Google Scholar]
- Rudin L. I., Osher S., and Fatemin E., “Nonlinear total variation based noise removal algorithms,” Physica D 60, 259–268 (1992). 10.1016/0167-2789(92)90242-F [DOI] [Google Scholar]
- Adluru G., Awate S. P., Tasdizen T., Whitaker R. T., and Dibella E. V., “Temporally constrained reconstruction of dynamic cardiac perfusion MRI,” Magn. Reson. Med. 57, 1027–1036 (2007). 10.1002/mrm.21248 [DOI] [PubMed] [Google Scholar]
- Brodsky E. K., Samsonov A. A., and Block W. F., “Characterizing and correcting gradient errors in non-Cartesian imaging: Are gradient errors linear time-invariant (LTI)?,” Magn. Reson. Med. 62, 1466–1476 (2009). 10.1002/mrm.22100 [DOI] [PMC free article] [PubMed] [Google Scholar]
- Sung K. and Nayak K. S., “B1+ compensation in 3T cardiac imaging using short 2DRF pulses,” Magn. Reson. Med. 59, 441–446 (2008). 10.1002/mrm.21443 [DOI] [PubMed] [Google Scholar]
- Plein S., Radjenovic A., Ridgway J. P., Barmby D., Greenwood J. P., Ball S. G., and Sivananthan M. U., “Coronary artery disease: Myocardial perfusion MR imaging with sensitivity encoding versus conventional angiography,” Radiology 235, 423–430 (2005). 10.1148/radiol.2352040454 [DOI] [PubMed] [Google Scholar]
- Parker G. J., Baustert I., Tanner S. F., and Leach M. O., “Improving image quality and T(1) measurements using saturation recovery turboFLASH with an approximate K-space normalisation filter,” Magn. Reson. Imaging 18, 157–167 (2000). 10.1016/S0730-725X(99)00124-1 [DOI] [PubMed] [Google Scholar]
- Kim D., “Influence of the k-space trajectory on the dynamic T1-weighted signal in quantitative first-pass cardiac perfusion MRI at 3T,” Magn. Reson. Med. 59, 202–208 (2008). 10.1002/mrm.21344 [DOI] [PubMed] [Google Scholar]
- Lin W., Guo J., Rosen M. A., and Song H. K., “Respiratory motion-compensated radial dynamic contrast-enhanced (DCE)-MRI of chest and abdominal lesions,” Magn. Reson. Med. 60, 1135–1146 (2008). 10.1002/mrm.21740 [DOI] [PMC free article] [PubMed] [Google Scholar]
- Block K. T. and Uecker M., “Simple method for adaptive gradient-delay compensation in radial MRI,” in Proceedings of the International Society for Magnetic Resonance in Medicine (2011), p. 2816.
- Speier P. and Trautwein F., “Robust radial imaging with predetermined isotropic gradient delay correction,” in Proceedings of the International Society for Magnetic Resonance in Medicine (2006), p. 2379.
- Bracewell R. N., The Fourier Transform and its Applications (McGraw-Hill, New York, 1978). [Google Scholar]
- Hansen M. S., Atkinson D., and Sorensen T. S., “Cartesian SENSE and k-t SENSE reconstruction using commodity graphics hardware,” Magn. Reson. Med. 59, 463–468 (2008). 10.1002/mrm.21523 [DOI] [PubMed] [Google Scholar]


