Abstract
Purpose: Most methods to estimate patient dose from computed tomography (CT) exams have been developed based on fixed tube current scans. However, in current clinical practice, many CT exams are performed using tube current modulation (TCM). Detailed information about the TCM function is difficult to obtain and therefore not easily integrated into patient dose estimate methods. The purpose of this study was to investigate the accuracy of organ dose estimates obtained using methods that approximate the TCM function using more readily available data compared to estimates obtained using the detailed description of the TCM function.
Methods: Twenty adult female models generated from actual patient thoracic CT exams and 20 pediatric female models generated from whole body PET/CT exams were obtained with IRB (Institutional Review Board) approval. Detailed TCM function for each patient was obtained from projection data. Monte Carlo based models of each scanner and patient model were developed that incorporated the detailed TCM function for each patient model. Lungs and glandular breast tissue were identified in each patient model so that organ doses could be estimated from simulations. Three sets of simulations were performed: one using the original detailed TCM function (x, y, and z modulations), one using an approximation to the TCM function (only the z-axis or longitudinal modulation extracted from the image data), and the third was a fixed tube current simulation using a single tube current value which was equal to the average tube current over the entire exam. Differences from the reference (detailed TCM) method were calculated based on organ dose estimates. Pearson's correlation coefficients were calculated between methods after testing for normality. Equivalence test was performed to compare the equivalence limit between each method (longitudinal approximated TCM and fixed tube current method) and the detailed TCM method. Minimum equivalence limit was reported for each organ.
Results: Doses estimated using the longitudinal approximated TCM resulted in small differences from doses obtained using the detailed TCM function. The calculated root-mean-square errors (RMSE) for adult female chest simulations were 9% and 3% for breasts and lungs, respectively; for pediatric female chest and whole body simulations RMSE were 9% and 7% for breasts and 3% and 1% for lungs, respectively. Pearson's correlation coefficients were consistently high for the longitudinal approximated TCM method, ranging from 0.947 to 0.999, compared to the fixed tube current value ranging from 0.8099 to 0.9916. In addition, an equivalence test illustrated that across all models the longitudinal approximated TCM is equivalent to the detailed TCM function within up to 3% for lungs and breasts.
Conclusions: While the best estimate of organ dose requires the detailed description of the TCM function for each patient, extracting these values can be difficult. The presented results show that an approximation using available data extracted from the DICOM header provides organ dose estimates with RMSE of less than 10%. On the other hand, the use of the overall average tube current as a single tube current value was shown to result in poor and inconsistent estimates of organ doses.
Keywords: CT, tube current modulation, radiation dose, organ dose, Monte Carlo dose simulations
INTRODUCTION
Concerns about radiation risk due to computed tomography (CT) exams are rising in both the medical physics community and the general public. Today radiation exposure related to CT imaging procedures has been classified as the largest source of medical radiation exposure in the United States.1, 2 As a result of CTs increased usage and therefore increased concerns about deterministic and stochastic effects, monitoring, reporting, and recording of radiation dose from CT exams for individual patients have not only been recommended by several groups and agencies such as the National Institutes of Health, Food and Drug Administration, The Joint Commission, International Atomic Energy Agency, American College of Radiology and Image Gently,3, 4, 5 but also mandated by the state of California under the California Senate Bill 1237.6
To assess radiation risk resulting from a CT exam, it has been suggested that radiation dose to individual radiosensitive organs is a more appropriate measure than effective dose.7, 8, 9 The importance of quantifying organ dose from a CT exam has led to development of Monte Carlo based methods for estimating dose to organs. These Monte Carlo methods model multidetector CT (MDCT) scanners in detail, modeling important components of the MDCT scanners such as geometry, spectrum, and filtration.10, 11, 12, 13, 14 However, the majority of these models does not take into account tube current modulation (TCM) and instead simulate a fixed tube current scan.10, 15, 16
TCM is a widely available dose reduction technique and a feature very frequently used in many clinical protocols to reduce dose while maintaining desired image quality.17, 18, 19 Tube current modulation algorithms are either based on angular modulation, z-axis modulation, or a combination of these two, which forms a three-dimensional modulation most commonly used in conventional TCM algorithms.17, 20 The angular or x-y modulation changes the tube current based on the projection's path length through the patient. For less attenuating path lengths, the tube current decreases while for the more attenuating paths, it increases to compensate for the greater attenuation.19, 21 The z-axis modulation further reduces the tube current for sections of the body with lower density, such as lungs, and increases the tube current for areas with higher density, such as shoulders.22 Therefore, the nature of generating a TCM function makes the outcome of this feature very patient- and scan-specific. Angel et al. used TCM values extracted from the raw projection data to account for TCM in the Monte Carlo simulations by changing the weight of each simulated photon based on the TCM data.23 However, these raw projection data are not easily accessible and special programs may be needed to extract the tube current values.
Other studies have used Monte Carlo based software programs such as ImPACT and PCXMC to estimate organ dose from tube current modulated scans. Israel et al.24 used ImPACT and estimated dose to 91 patients who underwent tube current modulated CT by computing dose for each image, using extracted tube current values from the image data, and summing it for whole-organ and whole-body dose estimates. The patient size limitation of ImPACT was overcome by establishing weight correction factors for different anatomical regions by modeling the adult chest and abdomen as cylinders of water and estimating the dose for a given x-ray tube potential. In addition to the limitation of estimating patient-specific organ doses, the difference between actual dose and the estimated dose is unknown and could not be assessed in this study.
He et al.25 used PCXMC 2.0.1 to investigate how x-ray tube current modulation affects patient dose in chest CT examinations by using weighting factors for each projection. The investigated tube current modulation function was an idealized scheme based on the basic principles of tube current modulation technique, but not specific to any one manufacturer's algorithm nor what is being used clinically. The idealized TCM schemes were modeled as a function of x-ray tube angle, using intervals of 15°, and longitudinal axis of the patient. In addition to finer intervals (about 0.03°), some manufacturers’ TCM algorithms also incorporate empirical data driven from observer studies to generate a TCM function.
The purpose of this study was to compare organ dose estimates obtained using a detailed TCM function with organ dose estimates obtained using approximations to the detailed TCM function. In this work, the detailed TCM function has been extracted from the raw projection data with assistance from manufacturers. Two approximations to the detailed TCM function were evaluated. The first was a postreconstruction technique using tube current information in the DICOM header of each CT image.26, 27 The second was a single tube current value equal to the average tube current value over the entire TCM function reported by the scanner (can also be calculated using tube current values extracted from the DICOM header). The study comparison is based upon simulating tube current modulated CT exams of 40 patients and estimating radiation dose to the lung tissue and glandular breast tissue using three different methods. Organ dose estimates from different methods will be compared to the organ doses obtained using the detailed TCM method which will serve as the reference method.
MATERIALS AND METHODS
Monte Carlo simulation code
To estimate organ doses from tube current modulated chest CT scans, a previously developed and validated Monte Carlo based CT dosimetry package, modeling scanner's geometry, spectrum, and filtration, was used.12, 13, 14, 23, 28 The Monte Carlo code used is MCNPX (Monte Carlo N-Particle eXtended v2.6.0) radiation transport code developed at Los Alamos National Laboratory.29, 30 All simulations were performed in photon transport mode with a low-energy cutoff of 1 keV. This mode only tracks photon interactions and assumes secondary electrons deposit their energy at the photon interaction site. This assumption satisfies the condition of charged particle equilibrium (CPE), under which one can further assume that collision kerma is equal to absorbed dose.
MDCT source models
Two MDCT scanners were modeled in this study; a Sensation 64 (Siemens Healthcare, Forchheim, Germany) and a LightSpeed 16 (GE Healthcare, Waukesha, WI). The Monte Carlo CT source simulates a helical source path using a point source to emit photons whose initial position and direction are randomly selected from the helical path based on the scanner source-to-isocenter distance and fan angle. The equivalent source model of Turner28 was used to generate scanner-specific spectrum and filtration for each MDCT scanner. Each scanner model was validated by simulating CTDI100 at the center and periphery of both 32 and 16 cm CTDI phantoms and comparing these values to physical measurements. The number of simulated photons was chosen so that statistical errors were less than 1%. The simulation results agreed with the measurements to within 1.3% and 1.8% across all values for Siemens and GE, respectively.
Voxelized patient models
Adult female models—Chest
Twenty adult female chest models were developed using the methods previously introduced by Angel et al.23 and were obtained with IRB approval. These models were derived from MDCT scans acquired on a Siemens Sensation 64 performed with CARE Dose 4D [TCM algorithm used in Siemens MDCT scanners, modulating tube current in three dimensions (x, y, z)] and scanner settings of 120 kVp, 24 × 1.2 mm collimation, Quality Reference mAs of 275, pitch values between 0.8 and 1.2, rotation time of 0.5 s, and reconstructed image thickness of 3 mm. The raw projection data and reconstructed DICOM image data were anonymized for each model.
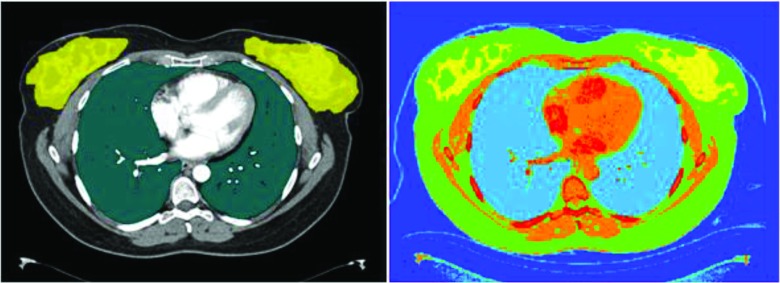
Image data were used to generate voxelized patient models; lungs and glandular breast tissue were identified using methods described by Angel et al.;23 voxels within the contoured lungs and glandular breast tissue were assigned to the corresponding organ as defined by ICRU Report 44.31 Each voxel outside the segmented region was identified as one of the six tissue types (air, water, lung, fat, muscle, and bone) and subdivided into 17 different tissue density levels as a function of CT numbers.31 Figure 1 illustrates the axial view of one of the segmented CT images with its voxelized representation.
Figure 1.
Segmented lungs and glandular breasts on an axial CT image (left), voxelized model of the same image graphically represented using MCNPX geometry visualization software (right).
Pediatric female models
Pediatric female models—Whole body
To further compare each approximation method to the reference method, a second test condition was created using a second scanner (GE LightSpeed 16) with a different TCM algorithm. A set of 20 pediatric female whole body scans were obtained from this scanner with IRB approval and used to create voxelized models using the methods described above.21 These patients ranged from 8 to 17 years old. These patient scans were part of PET/CT exam covering the chest, abdomen and pelvic regions.
These models were derived from scans that were performed with a three-dimensional (x, y, z) tube current modulation (SmartmA), pitch of 1.375, rotation time of 0.5 s, and 3.75 mm reconstructed image thickness. The maximum tube current value on the SmartmA was set to 120 mA for a 100 kVp scan and 110 mA for a 120 kVp scan (differs depending on patient's age). All of these pediatric patient whole body scans were performed using a bismuth breast shield. The shield was placed on patient's chest after the scout was acquired to eliminate its effects on the TCM algorithm. For each patient model, the TCM function and reconstructed DICOM image data were obtained and anonymized.
As with the adult patient models, the CT image data were used to generate voxelized models. Lungs and glandular breast tissue were identified and contoured using methods described by Angel et al.;23 voxels within the contoured lung and glandular breast tissue were assigned to the corresponding organ as defined by ICRU Report 44.31 Each voxel outside the segmented region was identified as one of the six tissue types (air, water, lung, fat, muscle, and bone) and subdivided into 17 different tissue density levels as a function of CT numbers.31
Pediatric female models—Chest (derived from whole body exams)
To investigate the effects of scanned anatomical region on the performance of the approximation methods, data from the thoracic region of the 20 pediatric female whole body models described above were used to create simulated thoracic scans. To do this only the TCM data from approximately 2 cm above the thoracic inlet to 2 cm below the costophrenic angles were used for the chest exam simulations. This was done to explore the effects of the region over which the average tube current is taken for the fixed tube current method (e.g., the average tube current value can be quite different when it is taken over the chest region compared to the average over the whole body region) which may affect simulated organ dose estimates.
Tube current modulation models
Detailed TCM method
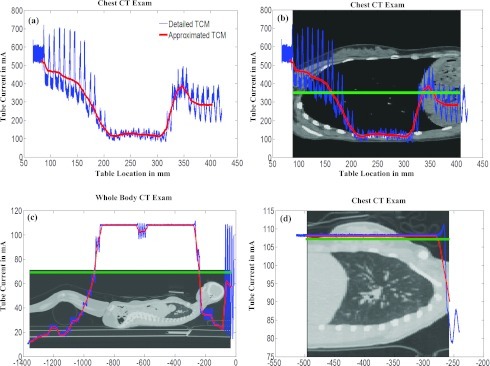
For each patient model, detailed TCM function was extracted from the raw projection data. The TCM function of most of these patients follows the basic concepts of the TCM algorithms as shown in the blue curve in Fig. 2a. The angular modulation is recognized by the peaks and valleys in the function, representing the increase of tube current in the lateral direction and decrease of tube current in the anterior-posterior direction. In addition, the modulation along the z-axis based on different anatomical regions is also evident. Some cases demonstrate the tube current at its maximum value due to multiple reasons including selection of a high Quality Reference mAs, fast rotation time which results in a high instantaneous tube current value, and some models included the arms within the scan range (which increases the local attenuation of that region of anatomy). In these situations where the tube current has reached the upper limit, the modulation along the z-axis becomes very small and the tube current is approximately constant over the scanned anatomy.
Figure 2.
(a) Graphic representation of a sample adult female chest detailed TCM function (blue) and the corresponding longitudinal approximated TCM function (red) resulting from CareDose 4D. (b) Same TCM function overlaid on the anatomy. Green corresponds to the average tube current value across the entire scan length. (c) Pediatric whole body TCM function (average tube current = 69 mA). (d) Pediatric chest TCM function (average tube current = 108 mA).
In each case, the tube current value I is a function of table position z and tube angle Θ. For a given patient, all tube current values, I(Θ, z), were normalized to the maximum tube current value used in that acquisition. Then for each simulated photon the normalized value was used to modify its contribution to each dose tally by varying its MCNPX source weight value at each (Θ, z) position along the path of the source. This modeling of the tube current modulation represents the three-dimensional modulation (angular modulation (x-y) and z-axis modulation) of tube current for each patient, hence the name “detailed” TCM function method.
For all 20 pediatric models, detailed TCM functions were obtained from the scanner with assistance from the manufacturer. The TCM functions for these pediatric patients are noticeably different from the adult patients; most of these differences appear to be related to differences in the scanner and settings such as the maximum and minimum limits set by SmartmA.
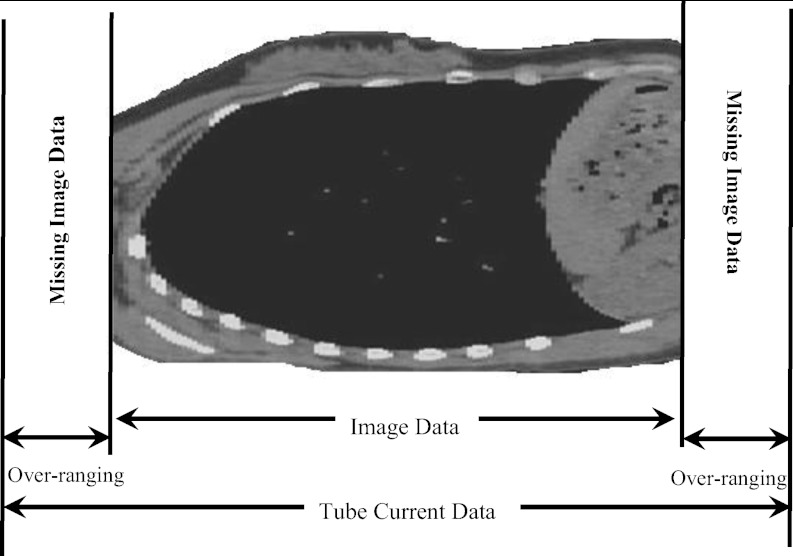
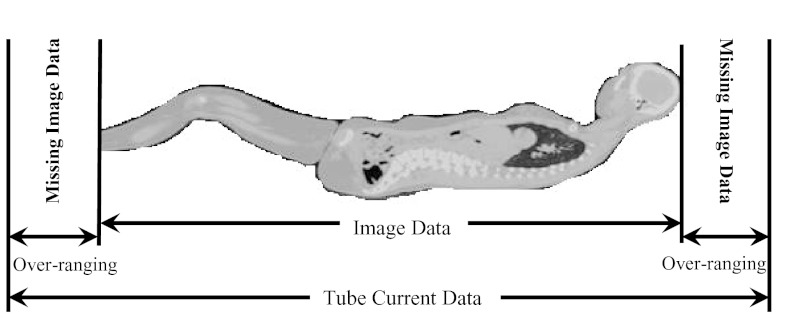
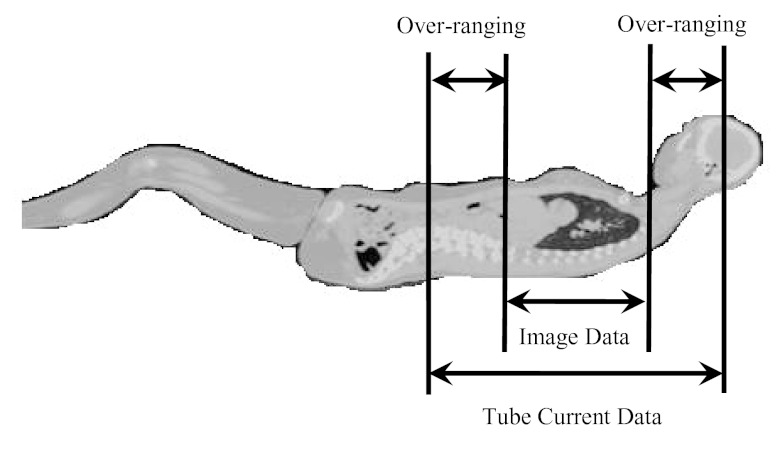
In helical mode, over-ranging refers to the region where anatomy is irradiated by the x-ray beam that is beyond the extent of image data; this is because of the need for extra data at both ends of the planned scan length for reconstruction purposes. The over-ranging region can be determined from start and end locations of the image data and locations of x-ray beam on and x-ray beam off, which are described in the tube current data that are extracted from the raw projection data. This is illustrated for each patient model group in Figs. 345. Because the detailed TCM method extracts tube current data from raw projection data, there is tube current data available from the over-ranging region. However, for the adult chest and pediatric whole body models, there is no image data – and hence no anatomy in the over-ranging region. Therefore for these models, over-ranging is approximated by modeling the tube current data, but with anatomy missing in the over-ranging region (Figs. 34). On the other hand, z-axis over-ranging is fully taken into account for the pediatric chest models because for these models both the tube current data and image data in the over-ranging region are available (Fig. 5).
Figure 3.
Over-ranging region illustrated for an adult female chest model. The figure does not represent the actual distance and is purely for illustration purposes. The models are generated from the image data and therefore do not include the anatomy of the over-ranging region, denoted as missing image data.
Figure 4.
Over-ranging distance shown for the whole body pediatric models. For these models the missing image data does not include a huge amount of anatomy as compared to the adult female chest models shown in Fig. 3.
Figure 5.
Pediatric female whole body models were used to simulate chest exams. For these chest models the over-ranging includes the anatomy due to models originating from whole body exams. The over-ranging distance was calculated from image data table location, extracted from the DICOM header of the image data, and tube current data table locations extracted from the raw projection data.
Longitudinal approximated TCM method
The longitudinal approximated TCM function was obtained from each patient's actual CT images via the DICOM header. Each image's DICOM header contains a unique tube current value along with a corresponding table location. The tube current reported in the DICOM header is the average value of the tube current over the rotation(s) used to reconstruct that image. Tube current and table location values for each image were read from the DICOM header of the image data using a MATLAB routine. Since tube angle is not available in the DICOM header of the image data, all simulations utilizing the longitudinal approximated TCM function were assumed to start at 0° (12:00 position). Using each scan's length (which is based on image data and is calculated from the first and last slice table location values), scan's collimation settings, and pitch, the number of rotations for each scan was calculated for use in assigning each table location a unique tube angle value.
The longitudinal approximated TCM function essentially only represents the z-axis modulation of the tube current but does not include the effects of over-ranging. Regardless of the availability of the image data from the over-ranging region, this method does not take into account over-ranging because the tube current data for the over-ranging distance is not available in the DICOM header. Figure 2a illustrates an example of a detailed TCM function and the longitudinal approximated TCM function, demonstrating the latter's inability to account for over-ranging.
Fixed (average) tube current method
The average tube current method is a fixed tube current simulation using a constant tube current value which is the average tube current over the entire scan length. This average is reported by the scanner, from which an average CTDIvol is calculated, but can also be calculated from the tube current data extracted from the DIOCM header. This average is shown in green for three models [Figs. 2b, 2c, 2d]. Since this method, similar to the previous one, is entirely based on image data, it does not take into account over-ranging.
Simulated CT exams
For all three sets of patient models (adult female chest, pediatric female whole body, and pediatric female chest) three sets of simulations were performed each using a different TCM method: detailed TCM function method (reference), longitudinal approximated TCM function method, and fixed tube current method using a single tube current value averaged over the entire scan length. Different scan simulations and patient combinations are shown in Table 1.
Table 1.
Different patient data sets and TCM methods to estimate organ dose illustrated in tabular form. Detailed TCM method uses a three-dimensional modulation of the tube current, extracted from the raw projection data. For this simulation set the z-axis over-ranging was taken into account only for pediatric chest models. Longitudinal approximated TCM method uses only a z-axis modulation of the tube current which is extracted from the DICOM header of the image data. The fixed tube current method is a fixed tube current simulation utilizing a single tube current value equal to the average tube current calculated from the TCM function of the scan.
| Patient models | Exam | z-axis overranging | Detailed TCM | Longitudinal approximated TCM | Fixed tube current |
|---|---|---|---|---|---|
| 20 adult | Chest | NA(Fig. 3) | ✓ | ✓ | Single ave. mA over the scan length |
| 20 pediatric | Whole body | NA(Fig. 4) | ✓ | ✓ | Single ave. mA over the whole body scan length |
| 20 pediatric | Chest | ✓(Fig. 5) | ✓ | ✓ | Single ave. mA over the chest region |
Simulated CT exams—Adult female chest exams
TCM methods were compared based on estimates of organ doses obtained with each method. The first set of tests was performed using 20 adult female chest models described above. For each patient model, each of the three methods (detailed TCM, longitudinal approximated TCM and fixed tube current scan using an average tube current) were utilized to obtain doses to lung and glandular breast tissue. Figure 2b illustrates the detailed, longitudinal approximated and fixed tube current functions for an adult patient model. These models are entirely based on image data and therefore the detailed TCM method simulations do not take into account over-ranging for these models (Fig. 3).
Simulated CT exams—Pediatric female whole body exams
The second set of tests was performed using 20 pediatric female whole body models described above. For each patient model, each of the three methods (detailed TCM, longitudinal approximated TCM, and fixed tube current using average tube current over the entire whole body scan) were utilized. From each simulation both the dose to lung and glandular breast tissue were obtained and compared to the results from the reference method.
As mentioned before the TCM functions of these pediatric patients are different compared to the adult patient models acquired on Sensation 64 scanner and it is assumed to be due to an upper and lower limit set by SmartmA, GE's TCM algorithm. Nevertheless, these data sets were used not to test the TCM algorithm, but to test the ability of approximation methods to match the results from the detailed TCM method, regardless of how it performed. Additionally, because these patients were all scanned on a different scanner than the adult patients, it allowed comparisons that included TCM algorithms from different manufacturers. Figure 2c illustrates the differences in the detailed TCM, longitudinal approximated TCM, and fixed tube current method for a pediatric patient model. Similar to the adult female chest models, detailed TCM method simulations do not take into account over-ranging for these models (Fig. 4).
Simulated CT exams—Pediatric female chest exams
The third set of tests was performed to assess the effects of different scanned anatomical region on the performance of approximation methods. In these tests, the female pediatric models were used to simulate chest exams by only utilizing the thoracic region of the TCM functions. For each pediatric female model, each of the three methods (detailed TCM, longitudinal approximated TCM, and fixed tube current using average tube current over the chest region) were utilized. From each simulation, both the dose to lung and glandular breast tissue were obtained. Figure 2d shows only the thoracic region of the patient model illustrated in Fig. 2c, demonstrating information used to simulate dose from each method. Notice that the average tube current (average = 108 mA) over the thoracic region is much higher than the average (average = 69 mA) over the entire body as shown in Fig. 2c.
Since our pediatric voxelized chest models are generated from whole body CT exams and tube current data are available for the entire scan length, we were able to account for z-axis over-ranging for the chest detailed TCM function simulations (Fig. 5).
Dose calculations
Absorbed dose in mGy was calculated for each model's lungs and glandular breast tissue. Dose was calculated using collision kerma, which is equal to absorbed dose under the assumption of charge particle equilibrium. For each simulated photon MCNPX tally type *F4 was used to track energy fluence in contoured regions and multiplied by mass energy-absorption coefficients (μen/ρ) to convert to collision kerma. The resulting dose per simulated photon for each organ was then multiplied by a normalization factor to convert to dose per mAs. This normalization factor is scanner, collimation, and kVp dependent and is used to take into account the fluence changes from varying the beam collimation.
To obtain absolute dose in mGy the calculated dose per mAs has to be multiplied by the total mAs, which is the mAs per rotation times the number of rotations. The mAs per rotation is different for each set of the simulations. For the detailed TCM method simulation the mAs per rotation is the maximum tube current value obtained from the raw projection data times the rotation time, for the longitudinal approximated TCM simulations this value is equal to the maximum tube current value obtained from the image data times the rotation time, and for the fixed tube current simulation it is equal the average mAs reported on the patient's dose report.
Dose comparison and statistical analysis
To investigate the accuracy of organ dose estimates (mGy) obtained using different methods percent differences from organ doses obtained using detailed TCM function simulations were calculated. For each organ the root-mean-square error (RMSE) of the percent error values were also calculated for all simulation results. Furthermore to examine the difference between each method and the detailed TCM function (reference), scatter plots with identity lines and Bland-Altman plots were generated using the simulated organ doses. Scatter plots with identity lines are useful to illustrate how two comparable data sets agree with each other. In this case simulated organ doses were used to generate scatter plot for each alternative method, to see their agreement with doses obtained using the detailed TCM method. From each scatter plot Pearson's correlations were calculated after the normality check. For comparing each alternative method with the reference, instead of using a difference test with the null hypothesis being, the two data sets do not differ from each other, we used an equivalence test. The problem with the difference test is that if the analysis does not show a statistically significant difference between two data sets, the null hypothesis cannot be rejected. But not being able to find any difference between two data sets does not prove that they are similar. Not being able to find a difference may just be due to the sample size; too small to detect any difference between two data sets. In equivalence test the null hypothesis tests for similarities and if the data sets differ by more than delta. The alternative hypothesis tests if the data sets differ by less than delta, i.e., they are similar. The null hypothesis, the absolute value of percent difference between alternative and detailed TCM method ≥ delta
was tested for the alternative methods, longitudinal approximated TCM function and fixed tube current. The minimum deltas (i.e., minimum equivalence limit) were reported.32, 33
RESULTS
Adult female chest models
Table 2 shows the results of each method for the adult patient models. Specifically, it shows the percent differences in estimated organ doses (for both lung and glandular breast tissue) between the detailed TCM estimates and each of the other methods. These results show that the smaller differences are between the detailed and longitudinal approximated TCM method, with mean differences of −5% and −1% for breasts and lungs, respectively; these compare to mean differences of 11% and 8% for the fixed tube current method (using average tube current) for breasts and lungs, respectively. The RMSE are also smallest for the longitudinal approximated TCM compared to the fixed tube current method.
Table 2.
Summary of organ dose percent differences calculated for each method with respect to organ dose estimates from detailed TCM function for adult female chest models. Organ estimates from detailed TCM simulations are the reference in these comparisons.
| Breasts | ||
|---|---|---|
| % Difference detailed- | % Difference detailed- | |
| Statistics | longitudinal approx. | fixed TC |
| Mean (SD) | −5 (7) | 11 (21) |
| Minimum | −25 | −13 |
| Maximum | 5 | 60 |
| RMSE | 9 | 23 |
| Lungs | ||
| % Difference detailed- | % Difference detailed- | |
| Statistics |
longitudinal approx. |
fixed TC |
| Mean (SD) | −1 (2) | 8 (10) |
| Minimum | −6 | −8 |
| Maximum | 3 | 25 |
| RMSE | 3 | 12 |
Table 3 shows the results of the equivalence tests, which demonstrate similar trends. Longitudinal approximated TCM function method and the detailed TCM method (reference) are equivalent within 3% and 1% for breasts and lungs, respectively. Calculated delta values are smaller for the longitudinal approximated TCM function than for the fixed tube current method; and in general the deltas are smaller for lungs than they are for breasts.
Table 3.
Summary of the equivalence test performed to determine the level of minimum equivalency between each method and the detailed TCM method, which is considered the reference. For example, in the case of adult female chest breasts, the mean of longitudinal approximated TCM method and detailed TCM method are equivalent within 3% with a significant p-value (0.0001) <0.05, indicating that the alternative hypothesis is accepted, i.e., the data sets are similar.
| Minimum equivalence limit to detailed TCM method |
||||
|---|---|---|---|---|
| Longitudinal | Fixed tube | |||
| approx. TCM | current | |||
| Population | (%) | p-value | (%) | p-value |
| Adult female chest-breasts | 3 | <0.0001 | 4 | 0.0034 |
| Adult female chest-lungs | 1 | 0.0006 | 4 | <0.0001 |
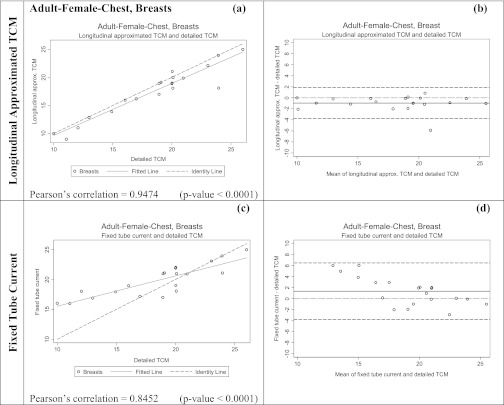
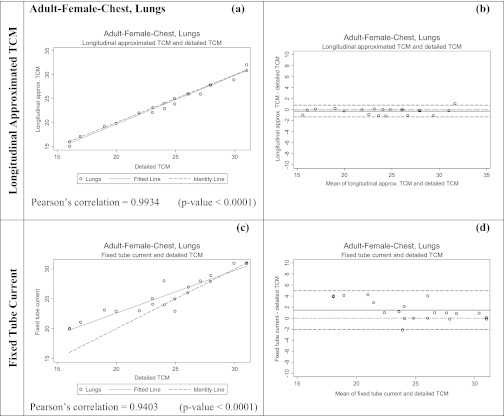
Figures 67 show both scatter plots with identity lines and Bland-Altman plots for the two alternative methods for estimating breasts and lung dose. Scatter plots with identity lines were used to illustrate the agreement between each alternative method and detailed TCM method. In this case an identity line was drawn as a reference. The more the two data sets agree, the more the scatters tend to concentrate in the surrounding area of the identity line. It is apparent that the organ dose estimates from the longitudinal approximated TCM function are closer to the results from the detailed TCM function than the estimates from fixed tube current method. On the scatter plots for the longitudinal approximated TCM function the fitted data falls either nicely right on the identity line (Fig. 7, lungs) or closely along it (Fig. 6, breasts). The Pearson's correlations are higher for this method than for the fixed tube current method, which is also graphically illustrated in the scatter plots by the fitted line (Figs. 67). As the RMSE values for lungs and breasts suggest, differences between the detailed TCM method and each of the other methods are smaller for lungs than they are for breasts.
Figure 6.
Summary of the statistical analysis performed on the breast dose data for adult patient models in mGy. Graphs (a) and (c) are the scatter plots for each method, while (b) and (d) are Bland-Altman graphs showing mean and standard deviation of the breast dose (mGy). The x axis of the scatter plot shows doses in mGy from detailed TCM function (X1) and the y axis represents doses in mGy from either the longitudinal approximated TCM or fixed tube current (X2). The x axis of the Bland-Altman graphs is (X1+X2)/2 and the y axis represents (X2-X1). For both methods the means are very close to the y = 0 lines, however, the standard deviation is larger for the fixed tube current method compared to the longitudinal approximated TCM method.
Figure 7.
Summary of the statistical analysis performed on the lung dose data for adult patient models in mGy. The graphs on the left are the scatter plots for each method [(a) and (c)]; while the ones on the right are Bland-Altman graphs [(b) and (d)] to show mean and standard deviation of the data. The x axis of the scatter plot shows lung dose in mGy from detailed TCM function (X1) and the y axis represents lung dose in mGy from either the longitudinal approximated TCM or fixed tube current (X2). The x axis of the Bland-Altman graphs is (X1+X2)/2 and the y axis represents (X2-X1). The mean for longitudinal approximated TCM method is closer to the y = 0 line, indicating a higher similarity between detailed TCM method and the longitudinal approximated TCM method. The standard deviation is also much smaller for the longitudinal approximated TCM method compared to the fixed tube current method.
In the Bland-Altman plots, both the mean and the line representing the mean of the two data sets if they were equivalent are shown. Standard deviations are larger for fixed tube current compared to the longitudinal approximated TCM method in both organs.
Pediatric female whole body
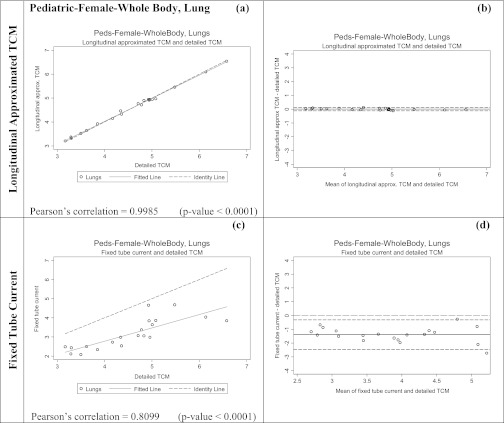
Table 4 shows the results for the pediatric whole body patient models. This table shows the percent difference in estimated organ doses (for both lung and glandular breast tissue) between the detailed TCM estimate and each of the other methods. These results also show small differences between the detailed and longitudinal approximated TCM method with mean differences of 2% and 0% for breasts and lungs, respectively; these compare to mean differences of −32% and −31% for the fixed tube current method using average tube current for breasts and lungs, respectively. The RMSE are also smaller for the longitudinal approximated TCM method compared to the fixed tube current method.
Table 4.
Statistical summary for pediatric whole body data set, showing a lower mean difference as well as lower RMS value for organ doses estimated using the longitudinal approximated TCM function.
| Breasts | ||
|---|---|---|
| % Difference detailed- | % Difference detailed- | |
| Statistics | longitudinal approx. | fixed TC |
| Mean (SD) | 2 (7) | −32 (11) |
| Minimum | −5 | −45 |
| Maximum | 25 | −7 |
| RMSE | 7 | 34 |
| Lung | ||
| % Difference detailed- | % Difference detailed- | |
| Statistics | longitudinal approx. | fixed TC |
| Mean (SD) | 0 (1) | −31 (10) |
| Minimum | −2 | −42 |
| Maximum | 3 | −5 |
| RMSE | 1 | 32 |
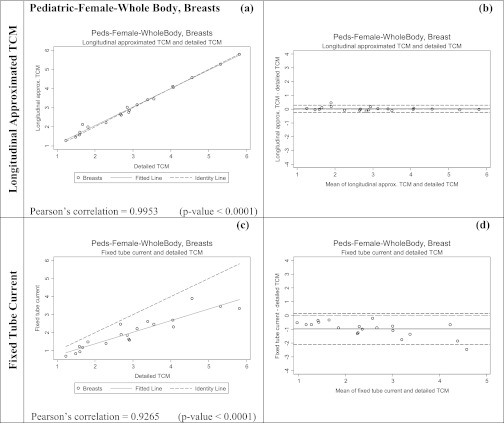
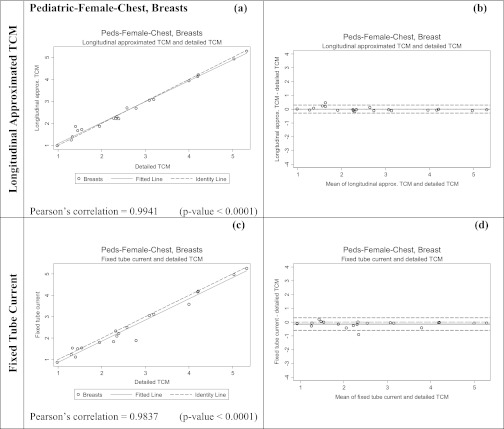
Table 5 shows the results of the equivalence tests; calculated delta values are much smaller for the longitudinal approximated TCM method than for the fixed tube current method. Figures 89 show both scatter plots and Bland-Altman plots for the two methods of estimating breasts and lung dose, respectively for the pediatric whole body patient models. It is apparent that the organ dose estimates from the longitudinal approximated TCM method are closer to the results from the detailed TCM method. On the scatter plots of the longitudinal approximated TCM function the fitted data falls nicely right on the identity line for both lungs (Fig. 8) and breast (Fig. 9). The Pearson's correlations are higher for the longitudinal approximated TCM method compared to the fixed tube current method.
Table 5.
Summary of the test performed for pediatric female whole body patient models to determine the level of minimum equivalency between each method and the detailed TCM method, which is considered the reference. For example, in the case of pediatric whole body lung, the mean of fixed tube current method, and detailed TCM method are equivalent within 29% with a significant p-value (0.0001) <0.05, indicating that the alternative hypothesis is accepted. However, this minimum equivalence limit (29%) is much larger compared to the longitudinal approximated TCM method (2%).
| Minimum equivalence limit to detailed TCM method |
||||
|---|---|---|---|---|
| Longitudinal | Fixed tube | |||
| approx. TCM | current | |||
| Population | (%) | p-value | (%) | p-value |
| Pediatric female whole body-breasts | 2 | 0.0214 | 29 | <0.0001 |
| Pediatric female whole body-lungs | 1 | 0.0007 | 27 | <0.0001 |
Figure 8.
Summary of the statistical analysis performed on the breast dose data for pediatric patient whole body models in mGy. The graphs on the left are the scatter plots for each method, while the ones on the right are Bland-Altman graphs to show mean and standard deviation of the data. The x axis of the scatter plot shows breast dose in mGy from detailed TCM function (X1) and the y axis represents breast dose in mGy from either the longitudinal approximated TCM or fixed tube current (X2). The x axis of the Bland-Altman graphs is (X1+X2)/2 and the y axis represents (X2-X1). The mean for longitudinal approximated TCM method is closer to the y = 0 line, indicating a higher similarity between reference and the longitudinal approximated TCM method. The standard deviation is also much smaller for the longitudinal approximated TCM method compared to the fixed tube current method.
Figure 9.
Summary of the statistical analysis performed on the lung dose data for pediatric patient whole body models in mGy. The graphs on the left are the scatter plots for each method, while the ones on the right are Bland-Altman graphs to show mean and standard deviation of the data. The x axis of the scatter plot shows doses in mGy from detailed TCM function (X1) and the y axis represents doses in mGy from either the longitudinal approximated TCM or fixed tube current (X2). The x axis of the Bland-Altman graphs is (X1+X2)/2 and the y axis represents (X2-X1). The mean for longitudinal approximated TCM method is closer to the y = 0 line, indicating a higher similarity between reference and the longitudinal approximated method. The standard deviation is also much smaller for the longitudinal approximated TCM method compared to the fixed tube current method.
Note that the organ dose estimates obtained from the fixed tube current method, based on an average tube current, are rather poor here. This is primarily because this average is a poor estimate of the actual tube current used in the chest region, as demonstrated in Fig. 2c. This is another motivation for simulating thoracic exams using the pediatric whole body patient models so that a more representative tube current value can be used over the chest region; demonstrating the dependency of this method's performance on the scanned anatomical region.
Pediatric female chest
Table 6 shows the results for the pediatric chest exam simulations. This table shows the percent difference in estimated organ doses (for both lung and glandular breast tissue) between the detailed TCM estimate and each of the methods, with the fixed tube current now being only based on the chest region. While these results show small differences between the detailed and longitudinal approximated TCM method, with mean differences of 2% and −2% for breasts and lungs, respectively, this table also shows mean differences of only −6% and −3% for the fixed tube current method, using the regional average tube current, for breasts and lungs, respectively. The RMSE are also smaller for the longitudinal approximated TCM compared to the fixed tube current method, but the difference is small.
Table 6.
Statistical summary for pediatric chest data set, showing similar mean differences and RMS value for organ doses estimated using both methods.
| Breasts | ||
|---|---|---|
| % Difference detailed- | % Difference detailed- | |
| Statistics | longitudinal approx. | fixed TC |
| Mean (SD) | 2 (9) | −6 (10) |
| Minimum | −7 | −32 |
| Maximum | 32 | −6 |
| RMSE | 9 | 11 |
| Lungs | ||
| % Difference detailed- | % Difference detailed- | |
| Statistics |
longitudinal approx. |
fixed TC |
| Mean (SD) | −2 (2) | −3 (3) |
| Minimum | −5 | −10 |
| Maximum | 1 | 2 |
| RMSE | 3 | 4 |
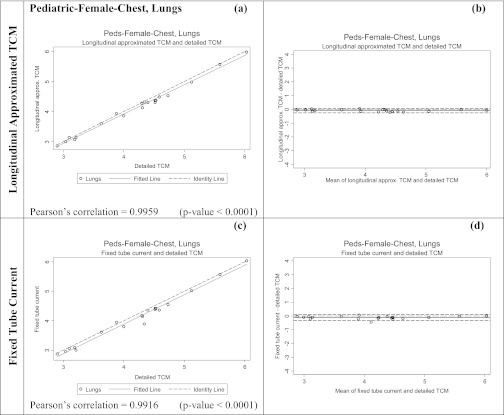
Table 7 shows the results of the equivalence tests, which demonstrate that the calculated delta values are very similar between methods. Figures 1011 show both scatter plots and Bland-Altman plots for the two methods of estimating breasts and lung dose, respectively, for the pediatric chest patient models. As opposed to previous sets of results, these figures show that there is not much difference between the two methods, for either organ dose estimates. The scatter plots for both methods show the fitted data fall nicely right on the identity line for both breasts (Fig. 10) and lungs (Fig. 11). The Pearson's correlations are also similar in both methods.
Table 7.
Summary of the test performed for pediatric female chest patient models to determine the level of minimum equivalency between each method and the detailed TCM method, which is considered the reference standard. For example, in the case of pediatric female chest breasts, the mean of longitudinal approximated TCM method, and detailed TCM method are equivalent within 3% with a significant p-value (0.0391) <0.05, indicating that the alternative hypothesis is accepted.
| Minimum equivalence limit to detailed TCM method |
||||
|---|---|---|---|---|
| Longitudinal | Fixed tube | |||
| approx. TCM | current | |||
| Population | (%) | p-value | (%) | p-value |
| Pediatric female chest-breasts | 3 | 0.0391 | 2 | 0.0023 |
| Pediatric female chest-lungs | 2 | <0.0001 | 2 | <0.0001 |
Figure 10.
Summary of the statistical analysis performed on the breast dose data for pediatric chest patient models in mGy. The graphs on the left are the scatter plots for each method, while the ones on the right are Bland-Altman graphs to show mean and standard deviation of the data. The x axis of the scatter plot shows breast dose in mGy from detailed TCM function (X1) and the y axis represents breast dose in mGy from either the longitudinal approximated TCM or fixed tube current (X2). The x axis of the Bland-Altman graphs is (X1+X2)/2 and the y axis represents (X2-X1). For both methods the means are very close to the y = 0 lines, however, the standard deviation is larger for the fixed tube current method.
Figure 11.
Summary of the statistical analysis performed on the lung dose data for pediatric chest patient models in mGy. The graphs on the left are the scatter plots for each method, while the ones on the right are Bland-Altman graphs to show mean and standard deviation of the data. The x axis of the scatter plot shows lung dose in mGy from detailed TCM function (X1) and the y axis represents lung dose in mGy from either the longitudinal approximated TCM or fixed tube current (X2). The x axis of the Bland-Altman graphs is (X1+X2)/2 and the y axis represents (X2-X1). For both methods the means are very close to the y = 0 lines and the standard deviations are small.
DISCUSSION AND CONCLUSION
This work demonstrates that the longitudinal approximated TCM function obtained from the image data is a reasonable surrogate to the detailed TCM function for use in Monte Carlo dose simulations. This was shown to be true for two different patient populations, anatomical regions, and also using two different scanner manufacturers (GE and Siemens) and therefore two different tube current modulation algorithms (CareDose4D and Smart mA). Even though the longitudinal approximated TCM function only represents the z-axis modulation of the TCM algorithm and it does not capture the over-ranging information that the detailed TCM function does, we demonstrated that it provides organ dose estimates that are close to the results obtained using the detailed TCM function which represents a three dimensional modulation of tube current (z-axis and angular x-y modulation). These results confirm that the effect of TCM is primarily due to the z-axis modulation of the tube current.25 More importantly the longitudinal approximated TCM method was shown to perform consistently across scanners, exams, and patient models.
The above results also demonstrate that the organ dose percent differences and the RMSE values for breasts are higher compared to lungs across all patients. This finding is also apparent in the scatter plots, Bland-Altman plots, and the equivalence test. These results suggest that angular modulation has a stronger effect on smaller peripheral organs (breasts) than larger and more central organs (lungs). Due to smaller size and the position of the breasts, the modulation of the tube current in the x-y plane contributes more to breast dose than to lung dose.
In addition to being more sensitive to the angular modulation, smaller, more peripheral organs are also more sensitive to the tube start angle as shown by Zhang et al.34 The tube start angle for the detailed TCM function simulations was extracted from the projection data, which is randomly assigned, however, the tube start angle for the longitudinal approximated TCM function simulations was set to zero because this information is not available in the DIOCM header of the image data. Knowing the tube start angle would improve the statistics for the smaller, more peripheral organs and therefore make the longitudinal approximated TCM function more robust.
Furthermore, the scan lengths used for the longitudinal approximated TCM method and the fixed tube current method were entirely extracted from the image data, which does not include the z-axis over-ranging. Knowing the actual scan length from beam on to beam off will further improve the performance of the longitudinal approximated TCM method. Additionally, only the pediatric chest models were able to account for z-axis over-ranging in the detailed TCM simulations, because only these models contained information on both the tube current data and image data in the over-ranging region. The other two sets of models, the adult female chest and the pediatric whole body models, contained only the tube current data but not the image data, because these models are entirely based on image data which does not contain the missing image data due to the over-ranging region. This can be improved by modeling voxelized blocks of water at each end of the image data, mimicking to the over-ranging region.
In the adult female chest models longitudinal approximated TCM method performed consistently across all patients, i.e., the method underestimated lung and breast dose compared to the reference method, the detailed TCM method. This underestimation is illustrated in the scatter plots showing the fitted line under the unity line. However, for the fixed tube current method the scatter plots do not show a consistent trend in this method's performance; sometimes it underestimates while other times it overestimates organ dose. This effect is due to the fact that the performance of the fixed tube current method depends on how closely the average tube current over the scan length represents the actual TCM function over a certain region. Depending on the shape of the TCM function this average may or may not be a good representation of the TCM function at a specific location.
For the adult female chest models the largest absolute percent difference between detailed TCM and longitudinal approximated TCM was 25% for breasts (longitudinal approximated TCM method underestimated breast dose by 25%). The glandular breast tissues for this specific patient fell more laterally than other patients. This resulted in a higher sensitivity of breasts to angular modulation for this patient. For another patient a maximum difference of 11% was observed. This patient had her arms in the scan region adjacent to her breasts, which resulted in an increase in the lateral tube current. This again resulted in a higher sensitivity of breasts to the angular modulation.
Overall it was shown that estimating organ dose using a fixed single tube current value adjusted for patient size (i.e., the average effective mAs) introduces errors in organ dose values up to 60% and 45% for adult female chest and pediatric female whole body models, respectively (Tables 2, 4). However, for a few female adult chest patients these percentages were less than 10% for both organs. For these patients, it was found that the overall average tube current value used to estimate organ dose happened to be very similar to the average tube current of the slices (images) containing breasts and lungs. Table 8 illustrates these findings for some adult female chest models. To confirm these findings the same analysis was done for a model whose fixed tube current simulation results were −45% different from those obtained with the detailed TCM function simulations; these results are shown at the bottom row of Table 8 (patient model 10). The percent difference between the overall average tube current used for this patient and the average tube current value of the locations that contained breasts was about −40%, which seems to explain most of these differences.
Table 8.
Comparisons between average tube current values (mA) from patient dose report used in the fixed tube current simulations and slices containing breasts.
| Fixed tube current mA | ||||
|---|---|---|---|---|
| reported on dose report | Detailed TCM mA | % Organ | ||
| Adult female | (used for fixed tube | averaged over slices | % mA | dose |
| chest | current method) | containing breasts | difference | difference |
| 4 | 578 | 578 | 0.0 | −2.6 |
| 5 | 520 | 540 | 3.7 | 3.7 |
| 9 | 514 | 481 | −6.9 | −8.1 |
| 11 | 570 | 574 | 0.7 | 0.8 |
| 12 | 352 | 291 | −21.0 | −4.1 |
| 15 | 568 | 567 | −0.2 | 1.3 |
| 18 | 560 | 564 | 0.7 | 2.5 |
| 19 | 558 | 552 | −1.1 | 0.5 |
| 10 | 470 | 335 | −40.3 | −45.7 |
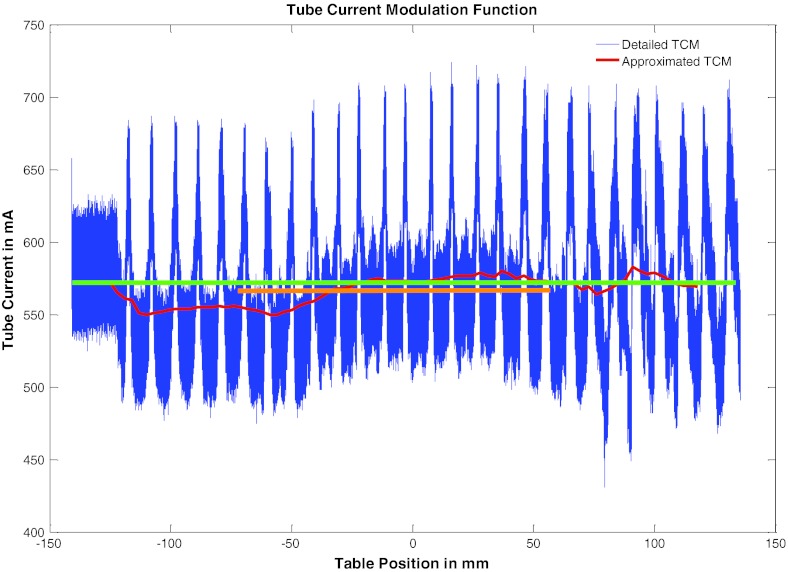
In addition, it was found that some of these patients’ TCM function had little or no z-axis modulation due to the tube current reaching its maximum limit, which in turn resulted in their average tube current being very similar to their z-axis modulation function. Patient number 15 is an example of patients with almost no z-axis modulation. This patient's detailed TCM and longitudinal approximated TCM are shown in Fig. 12. The rapid up and down of the tube current is due to the x-y modulation resulting from the elliptical shape of the patient. As illustrated by the longitudinal approximated TCM function there is only very little z-axis modulation in this patient.
Figure 12.
Illustrated is a TCM example of a maxed out tube current during an exam. Green represents the average tube current value obtained from the dose report (an average mA over the entire exam) and orange represents the average mA over images containing breasts.
Similar findings were seen for the pediatric patient models. The longitudinal approximated TCM function performed consistently across all patients while the fixed tube current method had different outcomes depending on the average tube current used. This effect was pronounced when the pediatric models were used to also simulate thoracic exams. Fixed tube current simulations performed best in the pediatric chest models compared to the pediatric whole body simulations. As illustrated in Figs. 2c, 2d, the improved performance of the fixed tube current method in chest exams is due to the use of two different average tube current values [shown in green in Figs. 2c, 2d]. For the whole body scans the average tube current value used is much lower than the actual tube current over the thoracic region, shown in blue. However, for the chest simulations the tube current was averaged only over the chest region and therefore is more representative of the actual tube current or tube output over lungs and breasts. These results are also illustrated in the scatter plots and the delta values, showing an improvement in the minimum equivalency level from 30% to 2%.
These results suggest that the fixed tube current is not very reliable; its performance is very much dependent on the TCM function for an individual patient. Prior knowledge of the TCM function can improve results from the fixed tube current simulations; this may be achieved by using region- and organ-specific average tube current instead of an average tube current from the entire scan length.
For almost all of the pediatric female models, moderate angular modulation was observed in their TCM function as compared to adult female models. Additionally, z-axis tube current modulation algorithms appear to be very different in these two scanners. Nevertheless, the longitudinal approximated TCM method performs as a reasonable approximation to the detailed TCM function independent of the type of the tube current modulation algorithm. For the pediatric female models the maximum difference between detailed TCM and longitudinal approximated TCM was 25% and 32% for breasts for whole body and chest exam simulations, respectively. After investigating the data it was found that the same patient caused these percentages. This specific patient had very small amount of glandular breast tissue and the resulting organ doses are very small. The difference between these two small numbers result in a relatively high percent difference, even though numerical difference was small – only 0.5 mGy. Comparing with adults who have higher doses, the dose percent differences for pediatric patients are more sensitive due to smaller dose values.
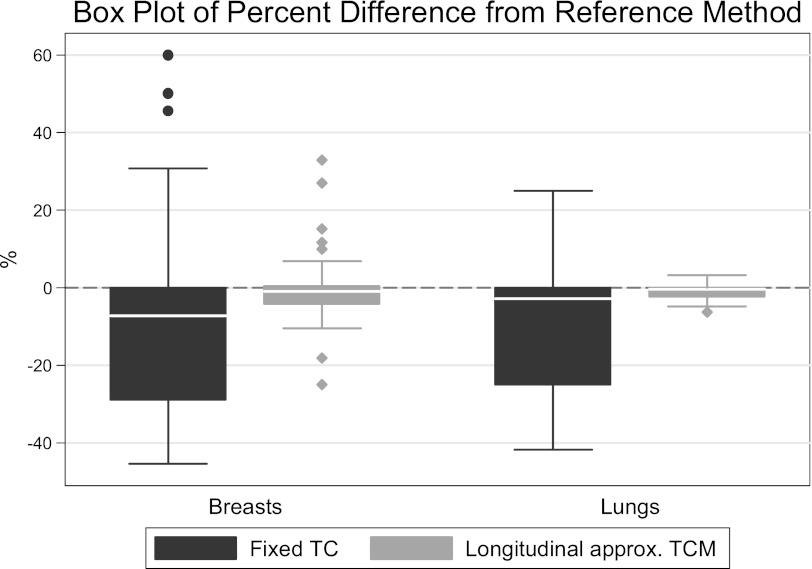
In summary, this work has shown that the detailed tube current modulation function can be approximated by using the tube current values extracted from the DICOM header information and will yield reasonably similar results when estimating organ doses. Figure 13 illustrates a summary of all data and the performance of each method across models and scanners. This was shown across two patient populations, two scanner types, and two different TCM algorithms. The longitudinal approximated TCM method is based on readily available image data and achieves excellent agreement with methods that use more detailed information. In addition, it was shown that the fixed tube current method can often yield misleading results, especially when scans contain anatomic regions with different attenuation properties such as a whole body or a chest/abdomen/pelvic scan. Future work will include other radiosensitive organs to confirm the performance of the longitudinal approximated TCM method across different exam types and organs.
Figure 13.
Summary of results represented as a box plot of organ dose percent difference from the reference method across all methods and models.
ACKNOWLEDGMENT
This work was supported by a grant from National Institute of Biomedical Imaging (NIBIB) (Grant No. R01 EB004898).
References
- F. A.MettlerJr., Thomadsen B. R., Bhargavan M., Gilley D. B., Gray J. E., Lipoti J. A., McCrohan J., Yoshizumi T. T., and Mahesh M., “Medical radiation exposure in the U.S. in 2006: Preliminary results,” Health Phys. 95, 502–507 (2008). 10.1097/01.HP.0000326333.42287.a2 [DOI] [PubMed] [Google Scholar]
- National Council on Radiation Protection and Measurements, “Ionizing radiation exposure of the population of the United States,” NCRP Report No. 160 (Bethesda, MD 2009).
- Neumann R. D. and Bluemke D. A., “Tracking radiation exposure from diagnostic imaging devices at the NIH,” J. Am. Coll. Radiol. 7, 87–89 (2010). 10.1016/j.jacr.2009.07.012 [DOI] [PMC free article] [PubMed] [Google Scholar]
- Rehani M. M. and Frush D. P., “Patient exposure tracking: The IAEA smart card project,” Radiat. Prot. Dosim. 147, 314–316 (2011). 10.1093/rpd/ncr300 [DOI] [PubMed] [Google Scholar]
- FDA, “FDA Unveils Initiative to Reduce Unnecessary Radiation Exposure from Medical Imaging” (February 9, 2010).
- C. S. B. 1237, California Health and Safety Code, Radiation Control: Health facilities and clinics: Records (http://leginfo.legislature.ca.gov/faces/billNavClient.xhtml?bill_id=200920100SB1237&search_keywords=)
- Brenner D. and Hall E., “Computed tomography–an increasing source of radiation exposure,” N. Engl. J. Med. 357, 2277–2284 (2007). 10.1056/NEJMra072149 [DOI] [PubMed] [Google Scholar]
- Hall E. J. and Brenner D. J., “Cancer risks from diagnostic radiology,” Br. J. Radiol. 81, 362–378 (2008). 10.1259/bjr/01948454 [DOI] [PubMed] [Google Scholar]
- Martin C., “Effective dose: How should it be applied to medical exposures?,” Br. J. Radiol. 80, 639–647 (2007). 10.1259/bjr/25922439 [DOI] [PubMed] [Google Scholar]
- “ImPACT CTDosimetry. Imaging performance assessment of CT Scanners: a medical devices agency evaluation group. CT scanner matching data, tables of CTDI values in air, CTDIw, and phantom factor values,” (ImPACT Internet home page (http://www.ImPACTscan.org); status: August, 2000).
- Schmidt B., and Kalender W. A., “A fast voxel-based Monte Carlo method for scanner- and patient-specific dose calculations in computed tomography,” Phys. Med. 18 43–53 (2002). [Google Scholar]
- Jarry G., DeMarco J. J., Beifuss U., Cagnon C. H., and McNitt-Gray M. F., “A Monte Carlo-based method to estimate radiation dose from spiral CT: From phantom testing to patient-specific models,” Phys. Med. Biol. 48, 2645–2663 (2003). 10.1088/0031-9155/48/16/306 [DOI] [PubMed] [Google Scholar]
- DeMarco J. J., Cagnon C. H., Cody D. D., Stevens D. M., McCollough C. H., Zankl M., Angel E., and McNitt-Gray M. F., “Estimating radiation doses from multidetector CT using Monte Carlo simulations: Effects of different size voxelized patient models on magnitudes of organ and effective dose,” Phys. Med. Biol. 52, 2583–2597 (2007). 10.1088/0031-9155/52/9/017 [DOI] [PubMed] [Google Scholar]
- DeMarco J. J., Cagnon C. H., Cody D. D., Stevens D. M., McCollough C. H., O’Daniel J., and McNitt-Gray M. F., “A Monte Carlo based method to estimate radiation dose from multidetector CT (MDCT): Cylindrical and anthropomorphic phantoms,” Phys. Med. Biol. 50, 3989–4004 (2005). 10.1088/0031-9155/50/17/005 [DOI] [PubMed] [Google Scholar]
- Kalender W. A., Schmidt B., Zankl M., and Schmidt M., “A PC program for estimating organ dose and effective dose values in computed tomography,” Eur. Radiol. 9, 555–562 (1999). 10.1007/s003300050709 [DOI] [PubMed] [Google Scholar]
- Huda W., Sterzik A., Tipnis S., and Schoepf U. J., “Organ doses to adult patients for chest CT,” Med. Phys. 37, 842–847 (2010). 10.1118/1.3298015 [DOI] [PMC free article] [PubMed] [Google Scholar]
- McCollough C. H., Bruesewitz M. R., and J. M.KoflerJr., “CT dose reduction and dose management tools: overview of available options,” Radiographics 26, 503–512 (2006). 10.1148/rg.262055138 [DOI] [PubMed] [Google Scholar]
- Kalender W. A., Wolf H., Suess C., Gies M., Greess H., and Bautz W. A., “Dose reduction in CT by on-line tube current control: Principles and validation on phantoms and cadavers,” Eur. Radiol. 9, 323–328 (1999). 10.1007/s003300050674 [DOI] [PubMed] [Google Scholar]
- Kalender W. A., Wolf H., and Suess C., “Dose reduction in CT by anatomically adapted tube current modulation. II. Phantom measurements,” Med. Phys. 26, 2248–2253 (1999). 10.1118/1.598738 [DOI] [PubMed] [Google Scholar]
- Kalra M. K., Naz N., Rizzo S. M., and Blake M. A., “Computed tomography radiation dose optimization: Scanning protocols and clinical applications of automatic exposure control,” Curr. Probl. Diagn. Radiol. 34, 171–181 (2005). 10.1067/j.cpradiol.2005.06.002 [DOI] [PubMed] [Google Scholar]
- Gies M., Kalender W. A., Wolf H., and Suess C., “Dose reduction in CT by anatomically adapted tube current modulation. I. Simulation studies,” Med. Phys. 26, 2235–2247 (1999). 10.1118/1.598779 [DOI] [PubMed] [Google Scholar]
- Greess H., Wolf H., Baum U., Lell M., Pirkl M., Kalender W., and Bautz W. A., “Dose reduction in computed tomography by attenuation-based on-line modulation of tube current: Evaluation of six anatomical regions,” Eur. Radiol. 10, 391–394 (2000). 10.1007/s003300050062 [DOI] [PubMed] [Google Scholar]
- Angel E., Yaghmai N., Jude C. M., Demarco J. J., Cagnon C. H., Goldin J. G., Primak A. N., Stevens D. M., Cody D. D., McCollough C. H., and McNitt-Gray M. F., “Monte Carlo simulations to assess the effects of tube current modulation on breast dose for multidetector CT,” Phys. Med. Biol. 54, 497–512 (2009). 10.1088/0031-9155/54/3/003 [DOI] [PMC free article] [PubMed] [Google Scholar]
- Israel G. M., Cicchiello L., Brink J., and Huda W., “Patient size and radiation exposure in thoracic, pelvic, and abdominal CT examinations performed with automatic exposure control,” Am. J. Roentgenol. 195, 1342–1346 (2010). 10.2214/AJR.09.3331 [DOI] [PubMed] [Google Scholar]
- He W., Huda W., Magill D., Tavrides E., and Yao H., “X-ray tube current modulation and patient doses in chest CT,” Radiat. Prot. Dosim. 143, 81–87 (2011). 10.1093/rpd/ncq291 [DOI] [PubMed] [Google Scholar]
- Tsalafoutas I. A. and Metallidis S., “A method for calculating the dose length product from CT DICOM images,” Br. J. Radiol. 84, 236–243 (2010). 10.1259/bjr/37630380 [DOI] [PMC free article] [PubMed] [Google Scholar]
- Lin P.-J. P., Kubo T., and Krishnapillai R., “Extraction of tube current values from DICOM CT images for patient dose estimation,” Med. Phys. 37, 2951–2955 (2010). 10.1118/1.3429054 [DOI] [PubMed] [Google Scholar]
- Turner A., “A method to generate equivalent energy spectra and filtration models based on measurement for multidetector CT Monte Carlo dosimetry simulations,” Med. Phys. 36, 2154–2164 (2009). 10.1118/1.3117683 [DOI] [PMC free article] [PubMed] [Google Scholar]
- Waters L., (ed) 2002 MCNPX User's Manual Version 2.4.0 Los Alamos National Laboratory Report LA-CP-02-408.
- Waters L., (ed) 2003 MCNPX Version 2.5.C Los Alamos National Laboratory Report LA-UR-03-2202.
- International Commission on Radiation Units and Measurements (ICRU), “Tissue substitutes in radiation dosimetry and measurement,” Report No. 44 (ICRU, Bethesda, MD, 1989).
- Cribbie R. A., Gruman J. A., and Arpin-Cribbie C. A., “Recommendations for applying tests of equivalence,” J. Clin. Psychol. 60, 1–10 (2004). 10.1002/jclp.10217 [DOI] [PubMed] [Google Scholar]
- Schuirmann D. J., “A comparison of the two one-sided tests procedure and the power approach for assessing the equivalence of average bioavailability,” J. Pharmacokinet Biopharm. 15, 657–680 (1987). 10.1007/BF01068419 [DOI] [PubMed] [Google Scholar]
- Zhang D., “Reducing radiation dose to selected organs by selecting the tube start angle in MDCT helical scans: A Monte Carlo based study,” Med. Phys. 36, 5654–5664 (2009). 10.1118/1.3259773 [DOI] [PMC free article] [PubMed] [Google Scholar]


