Abstract.
Fiber optic endomicroscopy is a valuable tool for clinical diagnostics and animal studies because it can capture images of tissue in vivo with subcellular resolution. Current configurations for endomicroscopes have either limited spatial resolution or require a scanning mechanism at the distal end of the fiber, which can slow imaging speed and increase the probe size. We present a novel configuration that provides high contrast pixel images at 7.2 frames per second, without the need for mechanical scanning at the proximal or distal end of the fiber. The proof-of-concept benchtop system is tested in fluorescence mode and can resolve 1.5 µm features of a high resolution 1951 USAF target.
Keywords: endomicroscope, spectral encoding, imaging
Endomicroscopy is an important tool for minimally invasive diagnosis and surgery as well as cellular research in animal models. Small and flexible fiber optic endomicroscopes with outer diameter have been built by utilizing optical fibers that transmit an image to a light detector outside of the body. Although fibers enable a small distal probe size and microscopic field-of-view, the image quality and/or frame rate is reduced as a consequence of the fiber-dependent optical system.
Several configurations for fiber optic endomicroscopes have been shown.1 A common implementation uses a coherent bundle of optical fibers as an image guide. Some confocal and multi-photon fiber bundle systems illuminate one fiber at a time with a pair of raster-scanning devices, while a point-detector such as a photo-multiplier tube (PMT) detects returning light.2–4 Alternatively, a two-dimensional detector array can be used to capture an image in a single exposure. This configuration can have reduced cost, size, and optical complexity.5,6 In addition, it can take advantage of modern scientific-grade camera technologies such as scientific CMOS (sCMOS), electron multiplying CCD (EMCCD), or back-thinned sensors that provide higher speed, greater quantum efficiency, lower noise, and more sampling than with a scanning-type system.7 When using a fiber bundle, however, the quantity of optical fibers that can be packed into the bundle (usually to 30,000 fibers) limits the number of spatial samples, which limits the resolution of images being displayed.8
Some endomicroscopes avoid this limitation by using a single optical fiber coupled to a two-axis mechanical scanner at the sample plane. High-speed scanning systems are difficult to miniaturize; therefore, these systems sacrifice frame rate and probe size for improved image quality.9,10 Another single fiber technique, known as spectrally encoded endoscopy (SEE), replaces mechanical scanning in one dimension with a prism and a broadband light source in order to create a line of spectrally dispersed light on the sample.11,12 Spectrally encoded spatial information can be detected with a line-spectrometer at the proximal end of the fiber, which reduces the size and complexity of the distal system. The technology, however, still requires one axis of mechanical scanning and is difficult to implement in fluorescence imaging mode due to the Stokes shift of fluorescent contrast agents.13
In this letter, we present a potential endomicroscope configuration that combines the benefits of using a fiber bundle with the increased sampling of spectral encoding. To the best of our knowledge, this is the first demonstration of increasing lateral resolution in a fiber bundle imaging system without the need for moving parts in the system. The benchtop configuration shown here is well suited for miniaturization because no electronics or mechanics are required at the distal end.
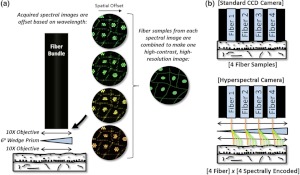
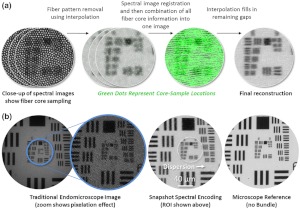
The concept that we call snapshot spectrally encoded endomicroscopy is illustrated in a fluorescence imaging configuration in Fig. 1(a). The setup uses an optical system at the distal end of the -element fiber bundle in order to sample the fluorescent object at different spatial offsets. Figure 1(b) shows spatial offsets are from dispersion of a prism. The fiber bundle samples the dispersed image at spatial offsets that correspond to different emission wavelengths. Once spatial information is spectrally encoded into the fiber bundle, an imaging spectrometer captures the offset spectral images at the proximal bundle face. Spectral images are combined into a single high-resolution image using a custom reconstruction algorithm. This series of steps registers the offset spectral images, determines the intensity information contained at each fiber core within the spectral images, and then combines all of the sampling information into a single image. The algorithm includes (1) fiber bundle pattern removal, (2) image registration, and (3) combination of spectral images. Using this reconstruction procedure, the spatial samples from each of the spectral images are combined into a single image with spatial samples as illustrated in Fig. 2. The increase in sampling improves the image resolution without the need for any scanning mechanism in the system.
Fig. 1.
Snapshot spectral encoding concept. (a) A prism and lenses are mounted at the distal end of a coherent fiber bundle. The image of the sample is dispersed over the face of the bundle, which causes the fibers to sample the image at slightly different offsets. Using a reconstruction algorithm, the fiber samples from each wavelength are combined to produce one image with higher contrast and resolution. (b) In a traditional fiber bundle imaging system, the number of spatial samples is limited by the amount of fibers within the bundle. Our configuration uses dispersion to overcome this sampling limitation. A hyperspectral camera captures the encoded images.
Fig. 2.
Snapshot spectral encoding calibration procedure. (a) A datacube of a high resolution 1951 USAF target is acquired. The fiber bundle pattern is removed from each spectral image using interpolation based on fiber core centers. Spectral images are then registered. All spectral images are combined by taking the maximum fiber core intensity at each image coordinate. Effectively, void spaces between fibers in one spectral image are filled with fiber core intensity from other spectral images. Any remaining void spaces are filled with interpolation. (b) An image from a traditional fiber bundle endomicroscope5,6 has a pixelation effect. The result of snapshot spectral encoding shows improved resolution and contrast, comparable to an image obtained directly from a microscope stage. The dotted circle represents the region of interest shown in (a).
Our previous studies used a traditional fiber bundle endomicroscope configuration to detect size and distribution of cell nuclei within potentially cancerous tissue.5,6 In the proof-of-concept system presented here, we aimed to improve the lateral resolution using snapshot spectral encoding. The fluorophore proflavine is used to stain nuclei and has an emission full-width half-maximum (FWHM) over the range 515 to 570 nm. In order to increase fiber bundle sampling of the fluorescent object, we chose to match the dispersion range of the emission spectrum to a distance comparable to the fiber spacing as shown in Fig. 1(b). This was achieved with two infinity-corrected Olympus objectives, mounted in an afocal 4-f imaging configuration, with a 6° wedge prism placed in between. These objectives were chosen because they are well-corrected for axial and lateral chromatic aberration. Excitation and emission light were separated with a FITC filter set. The system also included a Mercury arc lamp that delivered excitation light through the 6000-element S-Type Fujikura fiber bundle. A snapshot imaging spectrometer called the Image Mapping Spectrometer (IMS) was used for image detection.14 This system was selected because it collects all spatial-spectral information in a single exposure and has high light efficiency; therefore, it can detect low fluorescence signals and does not suffer from motion artifacts of scanning-type imaging spectrometers. It has also been used in other endoscope configurations.15 The IMS acquires spatial spectral samples within the emission range 515 to 570 nm, at 7.2 frames per second (FPS), 12-bit digitization, and with percent light efficiency.14,15 Thus, datacubes contain fibers spectral-encoded measurements, which correspond to 120,000 unique spatial samples. This improvement in sampling is comparable to increasing a pixel image to a pixel image.
The system is calibrated with a high-resolution 1951 USAF resolution target (Edmund Optics, Barrington, NJ) backed with a Fluor-Ref green fluorescent slide (Ted Pella, Redding, CA). After recording a datacube of the resolution target, the calibration starts by removing the fiber bundle pattern from each spectral image. This step is required because the fiber bundle pattern would otherwise interfere with registration of spectral images. The pattern is removed by implementing the interpolation method described in Ref. 16. This method first identifies the pixel at the center of each fiber core, because these pixels best represent intensity values from the object. Pixel locations are determined using the Matlab regional maxima function imregionalmax.m described in Ref. 17. Next, pixels around identified fiber cores are filled using a fast two-dimensional linear interpolation.16 The result of interpolation for one spectral image is shown within Fig. 2(a).
Interpolated spectral images are then registered. The purpose of registration is to determine the horizontal and vertical subpixel spatial offset of each spectral image. The magnitude/direction is dependent on the dispersion introduced by the prism. Images with fiber pattern removed are intensity normalized and then registered with the FFT algorithm described in Ref. 18.
Next, core locations from each coregistered spectral image are combined into a single image. This process essentially fills void spaces between fiber cores in an image with information from fiber cores of other spectral images. Intensity values at all core locations are combined using a maxima function,
| (1) |
where is the image containing all fiber core information from spectral images . Finally, any remaining void space is filled using the previously described interpolation method.
Figure 2(b) shows the calibration result compared to a fiber bundle endomicroscope with no spectral encoding. An increase in resolution is apparent from the zoomed sections. Group 8 Element 3 () can be partially resolved for the result, whereas the bundle system with no spectral encoding resolves up to Group 7 Element 3 lines (). The final image also has increased contrast. The achievable resolution is dependent on the performance of the distal optics, the pseudo-regular spacing of fibers within the bundle, the reconstruction algorithm, and the pixel quantity on the detector.
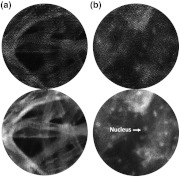
After the calibration, all subsequent spectral images taken with the snapshot spectrally encoded endoscope are combined using the same fiber locations and spatial offsets determined in the calibration procedure. Figure 3 shows images of 3(a) lens paper and 3(b) in vivo epithelial cells from the lower lip of a normal volunteer, acquired at 7.2 FPS, with and without snapshot spectral encoding. Reconstructed images contain higher contrast, and details such as nuclear shape and cell membranes are more clearly visualized.
Fig. 3.
(a) Lens paper and (b) in vivo epithelial tissue from a normal volunteer’s lower lip stained with proflavine. Snapshot spectrally encoded images have higher contrast and resolution, which can increase visibility of details such as cell nuclei and membranes.
This report describes a potential configuration for a endomicroscope device that can be used to obtain high quality images with no scanning mechanism required at the proximal or distal end. Signal from objects with broadband emission can be used, within the 470 to 670 nm spectral range of the current detector. Implementation of the modality has only recently become possible due to advances in real-time, high-throughput snapshot hyper- and multi-spectral imaging technology. Other distal optics with different types of lateral chromatic distortion can be used to offset spatial sampling, such as holographic diffraction gratings or GRIN lenses that have inherent radial lateral chromatic aberration.19 Future work aims to improve imaging performance and to miniaturize distal optics using in-house techniques for fabricating outer diameter lenses.20 The postprocessing algorithm will also be improved to account for spherical and chromatic aberrations induced by the distal optics.
Acknowledgments
This work was supported by R01CA124319.
References
- 1.Flusberg B. A., et al. , “Fiber-optic fluorescence imaging,” Nat. Methods 2(12), 941–950 (2005). 10.1038/nmeth820 [DOI] [PMC free article] [PubMed] [Google Scholar]
- 2.Laemmel E., et al. , “Fibered confocal fluorescence microscopy (Cell-viZio) facilitates extended imaging in the field of microcirculation. A comparison with intravital microscopy,” J. Vasc. Res. 41(5), 400–411 (2004). 10.1159/000081209 [DOI] [PubMed] [Google Scholar]
- 3.Liang C., et al. , “Fiber confocal reflectance microscope (FCRM) for in-vivo imaging,” Opt. Express 9(13), 821–830 (2001). 10.1364/OE.9.000821 [DOI] [PubMed] [Google Scholar]
- 4.Göbel W., et al. , “Miniaturized two-photon microscope based on a flexible coherent fiber bundle and a gradient-index lens objective,” Opt. Lett. 29(21), 2521–2523 (2004). 10.1364/OL.29.002521 [DOI] [PubMed] [Google Scholar]
- 5.Muldoon T. J., Gillenwater A., Richards-Kortum R., “Subcellular-resolution molecular imaging within living tissue by fiber microendoscopy,” Opt. Express 15(25), 16413–16423 (2007). 10.1364/OE.15.016413 [DOI] [PMC free article] [PubMed] [Google Scholar]
- 6.Muldoon T. J., et al. , “Noninvasive imaging of oral neoplasia with a high-resolution fiber-optic microendoscope,” Head Neck 34(3), 305–312 (2012). [DOI] [PMC free article] [PubMed] [Google Scholar]
- 7.Gao L., et al. , “Depth-resolved image mapping spectrometer (IMS) with structured illumination,” Opt. Express 19(18), 17439–17452 (2011). 10.1364/OE.19.017439 [DOI] [PMC free article] [PubMed] [Google Scholar]
- 8.Kyrish M., et al. , “Improving spatial resolution of a fiber bundle optical biopsy system,” Proc. SPIE 7558, 755807 (2010). 10.1117/12.842744 [DOI] [PMC free article] [PubMed] [Google Scholar]
- 9.Polglase A. L., et al. , “A fluorescence confocal endomicroscope for in vivo microscopy of the upper- and the lower-GI tract,” Gastrointest. Endosc. 62(5), 686–695 (2005). 10.1016/j.gie.2005.05.021 [DOI] [PubMed] [Google Scholar]
- 10.Shin H. J., et al. , “Fiber-optic confocal microscope using a MEMS scanner and miniature objective lens,” Opt. Express 15(15), 9113–9122 (2007). 10.1364/OE.15.009113 [DOI] [PubMed] [Google Scholar]
- 11.Tearney G. J., Webb R. H., Bouma B. E., “Spectrally encoded confocal microscopy,” Opt. Lett. 23(15), 1152–1154 (1998). 10.1364/OL.23.001152 [DOI] [PubMed] [Google Scholar]
- 12.Boudoux C., et al. , “Rapid wavelength-swept spectrally encoded confocal microscopy,” Opt. Express 13(20), 8214–8221 (2005). 10.1364/OPEX.13.008214 [DOI] [PubMed] [Google Scholar]
- 13.Strupler M., et al. , “Rapid spectrally encoded fluorescence imaging using a wavelength-swept source,” Opt. Lett. 35(11), 1737–1739 (2010). 10.1364/OL.35.001737 [DOI] [PubMed] [Google Scholar]
- 14.Bedard N., et al. , “Image mapping spectrometry: calibration and characterization,” Opt. Eng. 51(11), 111711 (2012). 10.1117/1.OE.51.11.111711 [DOI] [PMC free article] [PubMed] [Google Scholar]
- 15.Kester R. T., et al. , “Real-time snapshot hyperspectral imaging endoscope,” J. Biomed. Opt. 16(5), 056005 (2011). 10.1117/1.3574756 [DOI] [PMC free article] [PubMed] [Google Scholar]
- 16.Rupp S., Winter C., Elter M., “Evaluation of spatial interpolation strategies for the removal of comb-structure in fiber-optic images,” in 31st Annual International Conf. of the IEEE EMBS, pp. 3677–3680, IEEE, Minneapolis, Minnesota: (2009). [DOI] [PubMed] [Google Scholar]
- 17.Soille P., Morphological Image Analysis: Principles and Applications, Springer, New York: (1999). [Google Scholar]
- 18.Guizar-Sicairos M., Thurman S. T., Fienup J. R., “Efficient subpixel image registration algorithms,” Opt. Lett. 33(2), 156–158 (2008). 10.1364/OL.33.000156 [DOI] [PubMed] [Google Scholar]
- 19.Leiner D. C., Prescott R., “Correction of chromatic aberrations in GRIN endoscopes,” Appl. Opt. 22(3), 383–386 (1983). 10.1364/AO.22.000383 [DOI] [PubMed] [Google Scholar]
- 20.Kyrish M., et al. , “Ultra-slim plastic endomicroscope objective for non-linear microscopy,” Opt. Express 19(8), 7603–7615 (2011). 10.1364/OE.19.007603 [DOI] [PMC free article] [PubMed] [Google Scholar]


