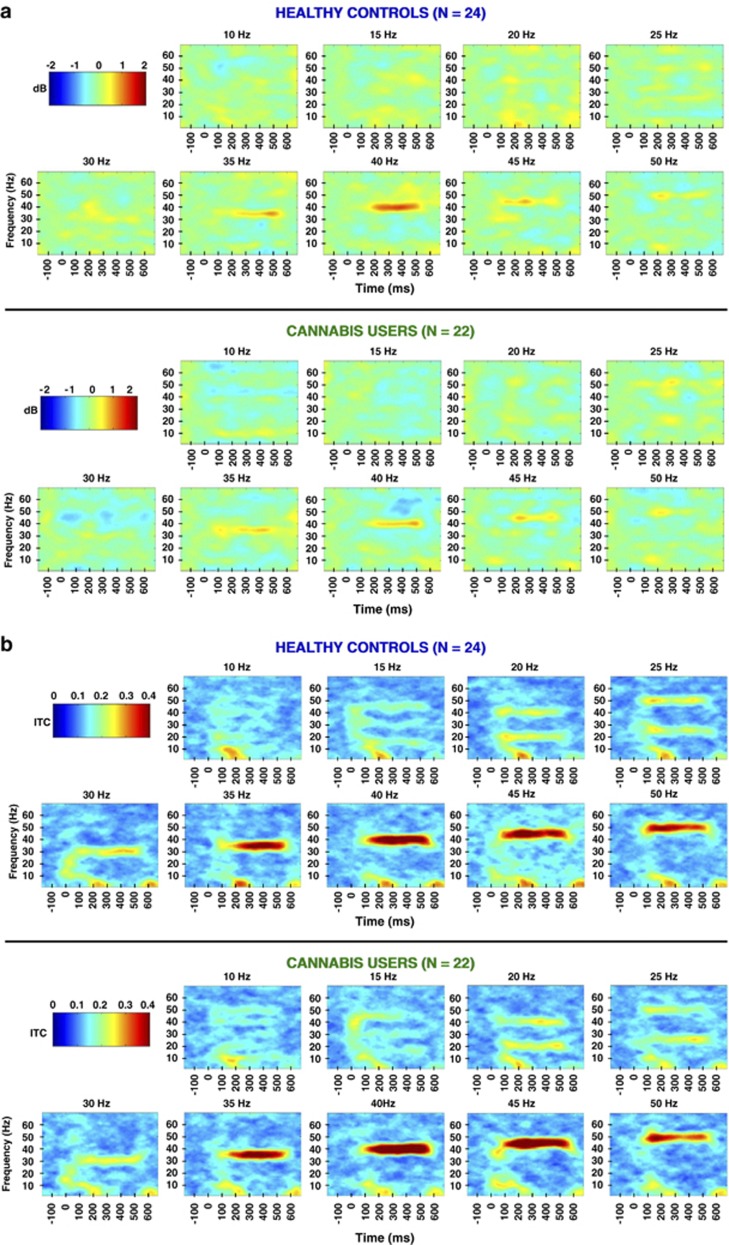
Figure 1.
(a) Grand-averaged time X frequency plots demonstrating spectral power across all stimulation frequencies (FCz). Note the preferred resonance of mean trial power (MTP) at 40 Hz stimulation. (b) Grand-averaged time X frequency plots for inter-trial coherence (ITC) across all stimulation frequencies (FCz).

