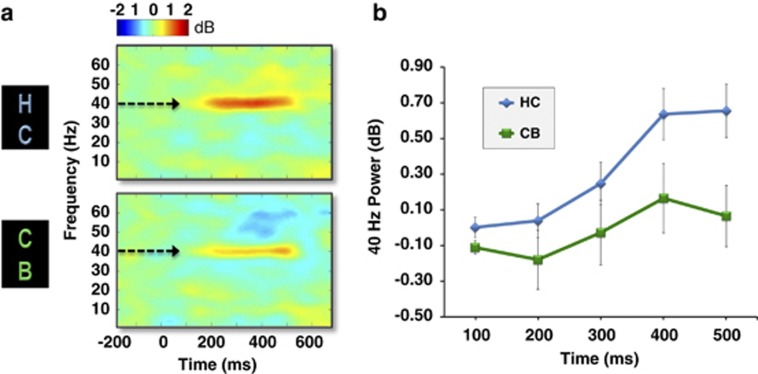
Figure 2.
(a) Grand-averaged time X frequency plots of MTP during gamma-band (40 Hz) auditory stimulation at electrode FCz for healthy controls (HC; top; n=24) and cannabis users (CB; bottom; n=22). Greater 40 Hz power was seen in control subjects compared with cannabis users. (b) Average MTP values in 100 ms intervals during the 500 ms window after onset of the 40 Hz click trains for control subjects (blue line) and cannabis users (green line) at FCz (error bars indicate ±SE).

