

Abstract
This work presents microdosimetric measurements performed at the Midwest Proton Radiotherapy Institute in Bloomington, Indiana, USA. The measurements were done simulating clinical setups with a water phantom and for a variety of stopping targets. The water phantom was irradiated by a proton spread out Bragg peak (SOBP) and by a proton pencil beam. Stopping target measurements were performed only for the pencil beam. The targets used were made of polyethylene, brass and lead. The objective of this work was to determine the neutron-absorbed dose for a passive and active proton therapy delivery, and for the interactions of the proton beam with materials typically in the beam line of a proton therapy treatment nozzle. Neutron doses were found to be higher at 45° and 90° from the beam direction for the SOBP configuration by a factor of 1.1 and 1.3, respectively, compared with the pencil beam. Meanwhile, the pencil beam configuration produced neutron-absorbed doses 2.2 times higher at 0° than the SOBP. For stopping targets, lead was found to dominate the neutron-absorbed dose for most angles due to a large production of low-energy neutrons emitted isotropically.
INTRODUCTION
Microdosimetry with tissue-equivalent proportional counters (TEPCs) is a well-established method for the determination of energy deposition in a small volume of tissue. Most microdosimetric studies are related to neutron fields and to gamma–neutron mixed fields. These detectors are usually used for the determination of neutron field characteristics, such as absorbed dose, and have been used for shielding calculations, kerma coefficients and radiation quality factor determination, and for boron neutron capture therapy(1–3).
TEPCs are also useful in the characterisation of neutron fields for proton therapy. In fact, the production of neutrons during proton therapy has been the centre of some debate for several years. Nevertheless, the use of these detectors in proton therapy is sparse(4–6). To the authors’ knowledge, there are no studies in proton therapy that compare the angular distribution of neutron production during passive and active beam delivery measured experimentally with TEPCs, or that measure the neutron angular distribution due to the interaction of the clinical proton beam with materials usually found in the treatment head beam line. Neutrons are of concern because they contribute to the out-of-field dose, possibly compromising long-term survival due to an increase in secondary cancer risk. Specifically, it has been claimed that neutron production during passive scatter delivery can be 10 times higher than during dynamic delivery(7). However, more recent studies show that neutron production during passive scatter delivery is smaller than previously reported(8–11). During passive scatter delivery, the energy of the beam is modulated and laterally spread by several components of the treatment nozzle before reaching the patient. In a scattering system, the proton beam interacts with scatterers made of lead and/or a combination of lead and Lucite-like materials, range modulation wheels (RMW) made of low-density materials like polyethylene, collimators made of brass or Lipowitz's metal and Lucite or wax compensators. These interactions, together with the interactions within the patient or target, comprise the neutron production in passive proton therapy(7, 12–14). A detailed description of proton dose delivery systems can be found elsewhere(15–17). The goal of the present study was to determine the total neutron-absorbed dose during a clinical setup for a passive and an active delivery nozzle configuration at several angles with respect to the initial proton direction and a water phantom as well as to measure the neutron-absorbed dose due to interaction of protons with materials typically present in the treatment nozzle such as lead, brass and polyethylene.
MATERIALS AND METHODS
The measurements presented here were performed at the Midwest Proton Radiotherapy Institute (MPRI) at Bloomington, Indiana, USA(11, 18–20). MPRI has two proton uniform scanning (dynamic delivery) rooms and one double-scattering room (passive scatter). Measurements were performed for a 10-cm physical diameter aperture with a 10-cm spread out Bragg peak (SOBP) irradiating ∼1000 cm3 and a pencil beam of ∼2.5-cm full-width half maximum laterally and longitudinally irradiating ∼10 cm3 within a water phantom. The same number of protons was delivered from the accelerator for both types of measurements. In addition, stopping target measurements were done for polyethylene, brass and lead targets. All measurements were performed for a 159-MeV proton beam in the double-scattering room. For the pencil beam measurements, no beam-modifying components were used; only the near monoenergetic pencil beam bombarded the target. This technique mimics the dynamic scanning scenario.
Tissue-equivalent proportional counters
TEPCs’ general characteristics
The TEPCs used for these measurements were built by Far West Technology and contain a built-in alpha-particle source, 244Cm, that emits alpha particles with an average energy of 5.8 MeV(21, 22). This alpha-particle source is used for the calibration of the detector because it's stopping power and mean energy required to create an ion pair (W/e) are similar to that of lower energy protons. Alpha particles are collimated to traverse the diameter of the counter. A description of the calibration process is introduced later in the text.
The outer shell of the detector is made of aluminium and encapsulates the cavity wall, collection volume and electrodes. The collection volume is defined by a spherical shell made of A-150 tissue-equivalent (TE) plastic, 3.8 mm thick and 12.7 mm inner diameter. The cavity of the collection volume was filled with propane-based TE gas at 12 kPa pressure.
Determination of appropriate gas pressure for TEPCs
The gas pressure to be used for the measurements was determined after testing how the gas gain changed for different pressures. The detector was filled to pressures of 8.0, 12.0 and 16 kPa. For each pressure, the voltage applied to the detector was varied from 300 to 750 volts. The position of the energy deposition peak for alpha particles traversing a diameter was recorded for each change in voltage. Even though higher gas gain was obtained for a pressure of 16 kPa, for which higher voltages can be used, the detector was operated at 12 kPa. Using too high of a voltage can induce a space charge effect that can degrade the resolution of the data and subsequently the spectrum obtained(23). A degradation of the resolution leads to unsharpness of the proton edge. In addition, keeping the detector running for long times at such high voltages can damage the collection electrodes. In summary, the detector was operated at 12 kPa and 600 volts.
Absorbed dose determination
This detector measures the energy deposited in the gas cavity by charged particles generated in the detector wall and in the gas itself in the cavity on an event-by-event basis. In this work, any direct neutron–gas interactions are ignored as they are assumed to contribute in a negligible manner. When uncharged particles, neutrons, interact with the A-150 wall, charged particles set in motion in the wall enter the counter gas volume and subsequently ionise the gas depositing energy. During ion collection, charge multiplication takes place between the helix and central electrode as shown in Figure 1. Finally, an electrical signal proportional to the total ionisation produced by a single event is created and transported throughout the electronics. Note that gamma-ray-induced events are also present, but their contribution to the energy deposited is small (see, e.g., Figure 4 where gamma-ray-induced events are observed <0.1 keV μm−1). In this study, dose integrations are limited to energies >0.1 keV μm−1 to reduce the gamma contribution to the final neutron-absorbed dose calculation presented in Tables 1 and 2.
Figure 1.

Collection volume region. The TEPC cavity is filled with propane-based TE gas. The region between the helix and the central electrode is where charge multiplication takes place(34).
Figure 4.

Event size spectra for a 100×100-mm2 SOBP for 159-MeV protons stopping in a water phantom measured at 0°, 45° and 90° and at 1 m from isocentre. All data are normalised by the beam current delivered and the run time. In addition, it was normalised by the maximum neutron-absorbed dose of the dataset for the spectra shown here.
Table 1.
Neutron-absorbed dose per incident charge for the two clinical setups, SOBP and pencil beam.
| Angle (°) | SOBP (nGy C−1) | Pencil beam (nGy C−1) |
|---|---|---|
| 0 | 0.17 | 0.37 |
| 45 | 0.56 | 0.48 |
| 90 | 0.51 | 0.37 |
Table 2.
Neutron-absorbed dose per incident charge for polyethylene, brass and lead stopping targets.
| Angle (°) | Polyethylene (nGy C−1) | Brass (nGy C−1) | Lead (nGy C−1) |
|---|---|---|---|
| 0 | 0.52 | 2.33 | 2.20 |
| 45 | 0.61 | 1.02 | 1.22 |
| 90 | 0.12 | 0.84 | 1.02 |
| 120 | 0.16 | 0.65 | 1.55 |
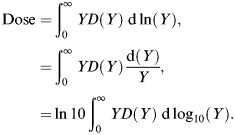
An event occurs every time when a charged particle deposits energy in the counter gas(25). The deposition of energy in the counter can be represented as event size Y, which can be defined as the energy deposited in the cavity normalised to the track length in tissue (keV μm−1), where the track length is defined as the counter diameter. More directly, event size can simply be recognised as the energy deposited divided by the cavity gas mass, the result being in units of Gy. One then measures the frequency distribution of event size in dose units. Hence, the absorbed dose in any event size interval is given by D(Y)= YN(Y), where N(Y) is the number of single event for a specific event size.
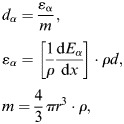
To determine the event size (expressed as keV μm−1 or as Gy) for each individual interaction in the cavity, it is necessary to determine several factors during the TEPC calibration. A calibration was performed before each measurement. During the calibration, the position of the energy deposited by the alpha particles from the calibration source in the cavity in the energy deposition spectrum is determined. With knowledge of this position and the stopping power of the alpha particles in the gas, it is possible to calibrate the acquisition channels in terms of keV μm−1 or absorbed dose. The conversion of the channel to event size is achieved with the use of the alpha-particle spectrum and a variable gain pulser signal used to linearise the alpha-particle pulse-height spectrum. In this way, the channel of the centroid of the alpha-particle spectrum is correlated with its event size in keV μm−1 or the absorbed dose. The absorbed dose for a single alpha-particle event is given by
 |
(1) |
where dα is the absorbed dose (in Gy) of the alpha particle. εα is the energy deposited by the alpha particle in the gas calculated with the alpha-particle mass stopping power, (1/ρ)(dEα/dx), and path length, ρd. The alpha-particle effective mass stopping power was calculated for an alpha particle with initial energy of 5.8 MeV, that is the most probable energy of alpha particles produced by the 241Cm source. Alpha particles of this energy were then transported across the gas-filled cavity and an effective stopping power determined. Finally, m is the mass of the gas in the detector's cavity in terms of detector's radius, r, and gas density, ρ. This equation presents dα as the incremental dose deposited by the α particles of the self-calibrated α source.
| (2) |
where
| 2 |
Finally, the factor, calculated using Equation (1), can also be used to convert the event size to units from keV μm−1 to Gy (Equation (2))(24). In any case, the total absorbed dose represented by the measured spectra is determined from:
 |
(3) |
The total absorbed dose value calculated from the event size spectra was normalised by the beam current delivered and the run time.
Experimental setup
Two setups were used for these measurements, a simulated clinical setup with a water phantom as shown in Figure 2 and a stopping target setup as shown in Figure 3. During the clinical setup, the water phantom was placed as close as possible to the treatment nozzle with an air gap of 0.051 m. The dimensions of the water phantom are 0.67×0.64×0.56 m3. The detectors were placed at 0°, 45° and 90° from the longitudinal direction of the proton beam and at a distance of 1 m with respect to isocentre. One detector was always positioned at 90° with respect to isocentre while the other one was moved to 0° and 45°. Each detector had a nylon build up cap. A 30-mm thick cap was used for the detector at 0° and 45°and one of 15 mm was used for the detector at 90°. The build up caps were used to ensure the charged particle equilibrium. A thicker build up cap was used for the detector at 0° and 45°, because at these positions it was expected to detect some neutrons with energies close to the primary proton beam. For larger angles, less energetic neutrons were expected; therefore, less material in the build up cap was required. In essence, a compromise was made between build up thickness and neutron energy. The most appropriate thickness was used since a build up cap for neutrons with energies >100 MeV would be too massive. This might lead to an underestimation of the neutron-absorbed dose measured by the detectors(26). Measurements in the clinical setup included a 100×100-mm2 SOBP and a pencil beam. The pencil beam was achieved by removing the RMW and scatter foils from the beam path.
Figure 2.

Schematic representation of the experimental setup for the water phantom measurements. The water phantom dimension was 0.67×0.64×0.56 m3. Each detector was positioned at 1 m from isocentre. Measurements were performed at 0°, 45° and 90° for SOBP and pencil-beam configurations(34).
Figures 3.

Experimental setup for lead, polyethylene and brass stopping targets. Detectors placed at 0°, 45°, 90° and 120° 1 m from the middle of the target. The polyethylene and brass targets were pieces manufactured to mount directly into the snout, whereas lead bricks were placed at 36-mm distance from the snout(34).
The polyethylene and brass targets used for the stopping target measurements were pieces manufactured to mount directly in the snout. There was no such piece for lead; hence, lead bricks were used instead. These were positioned as close as possible to the exit of the snout, but there was still an air gap of 36 mm between the snout and the bricks. The thickness of the polyethylene, brass and lead targets were 0.21, 0.07 and 0.10 m, respectively. For the stopping target measurements, the detectors were placed at 0°, 45°, 90°, and 120° at 1 m from the centre of the target, as shown in Figure 3. Again, the detector at 90° was fixed during all measurements.
Data acquisition
The signal from a TEPC went to a preamplifier that converted the charge signal from the detector into a voltage signal, which was directed to three dual amplifiers that further amplified the signal. The system gain was set such that a 1:104 energy region was covered. The energy region was subdivided into a low-gain region, gain=1, medium gain region, gain=3, and large gain region, gain=10. This is a common technique used for the appropriate recording of data(3, 27). The output signal from the amplifiers then went to a Canberra Multiport Multichannel Analyzer system, which employed six analog-to-digital converter (ADC)/multichannel analyser (MCA) boards. Each one of the boards works as an ADC and an MCA. Finally, the digital signal went to the computer where it was analysed with the data-processing system (GennieTM 2000, version 3.1). The data were stored in 1024 channels. Two detectors were simultaneously used at all times.
RESULTS AND DISCUSSION
Clinical setup
Figure 4 shows the microdosimetric spectra for the water phantom irradiation for the SOBP setup and for detectors at 0°, 45° and 90°. The neutron-absorbed dose at 0° and 45° is primarily due to high-energy neutrons, although there is some contribution from low-energy neutrons (large event size). At 90°, the spectra show almost equal contribution from low- (larger event size) and high-energy neutrons. For the pencil beam spectra, shown in Figure 5, most of the neutron contributions at all angles is due to high-energy neutrons. There is some contribution from low-energy neutrons, but this is less than what is observed for the SOBP configuration.
Figure 5.

Event size spectra for a 159-MeV pencil-beam impinging in a stopping water phantom measured at 0°, 45° and 90° at 1 m from isocentre. All data are normalised by the beam current delivered and the run time. In addition, it was normalised by the maximum neutron-absorbed dose of the dataset for the spectra shown here.
The neutron-absorbed dose per incident charge (DN/C) was calculated from these spectra. The higher absorbed dose was found at 45° for the SOBP and the pencil beam setup. A comparison between the SOBP and pencil beam spectra at 0° showed a DN/C of 2.2 times higher for the pencil beam setup. The same comparison at 45° and 90° showed a DN/C 1.1 and 1.3 times higher, for the SOBP, respectively. A larger neutron-absorbed dose at 45° and 90° during the SOBP delivery could be due to neutrons produced by the snout of the treatment nozzle, which is considered a major source of neutrons during proton therapy(13, 28–30). Nevertheless, some of the neutrons measured at 45° could be due to scatter neutrons from the water phantom. For the SOBP setup at 0°, there is a much smaller contribution from low-energy neutrons. Meanwhile, for the pencil-beam setup, the neutron-absorbed dose is mainly due to high-energy neutrons at all angles produced by the interactions of the proton beam with the water phantom. The highest DN/C was measured at 45°, Table 1.
The event size spectra obtained during these measurements are consistent with other studies in the literature including those performed in proton therapy centres(4, 5). Some discrepancies can be attributed to the difference in setup and detectors used for measurements. The neutron production in proton therapy is also highly dependent on the institution's treatment nozzle design, which varies from one proton centre to the next. These measurements showed that in fact high neutron doses are delivered with a passive scatter system, but the difference in neutron doses between passive scatter and dynamic delivery is not as significant as previously stated which agrees with previous studies in the literature(8, 10, 11). A possible limitation of this work when comparing neutron doses to those reported in the literature measured in dynamic systems is that contrary to what is done clinically the absorbed dose was not prescribed to a volume. It was not possible to actively change the beam energy during delivery for the treatment room where the measurements were performed. Nevertheless, the pencil-beam measurements of this study represent a good approximation to a clinically used dynamic delivery system and the comparison between modalities is appropriate since the same number of protons were delivered for each one. In terms of the neutron doses measured during the dynamic delivery, some studies show higher doses at 0° than at 45°(7). These differences could be due to the dimensions of the phantom used during the measurements. Scattered high-energy neutrons traversed less of the water phantom before reaching the detector at 45° than those neutrons forward peaked that reach the detector at 0°.
Thick target setup
The neutron-induced event size spectra for the polyethylene target are shown in Figure 6a. The maximum neutron-absorbed dose was measured at 45°. The spectra and absorbed dose are similar to that obtained for the pencil beam interacting with the water phantom, but the neutron-absorbed dose per incident charge at 0° is approximately 1.4 times higher for polyethylene than that for water, see Table 2. This could be due to the difference in thickness between targets. The polyethylene target was 0.21 m thick, while the water phantom was 0.67 m. This difference in thickness can lead to the attenuation in water of more neutrons that will not reach the detector at 0°. Figure 6b shows the spectra for the brass target. These spectra show considerable contributions from low- and high-energy neutrons at all the angles studied. For this target, the largest neutron contribution was at 0°, where high-energy neutrons dominate the spectra. This spectra is similar to the one reported by Binns and Hough for a passive system with the aperture blocked by a brass plug(4). The DN/C at 0° is two to four times higher than for the remaining angles. Both the high- and low-energy neutron components due to interaction with brass decrease considerably as the angle increases. Finally, Figure 6c presents the neutron-induced spectra for the lead target. The neutron-absorbed dose due to the interaction with lead is dominated by low-energy neutrons, evaporation neutrons, except at 0°, where a similar behaviour to that of brass is observed. In summary, Figure 7a–d shows a comparison between targets at different angles. It is clear that the neutron-absorbed dose from lead dominates most angles, except at 0° where the absorbed dose due to the interaction with brass is slightly higher. The interactions with lead produced the highest intensity of low-energy neutrons, mainly evaporation neutrons that are emitted isotropically. A similar behaviour was observed by Siebers et al.(2, 31) although some of the slow neutrons in their study were attenuated by concrete before reaching the detector. Neutrons produced by lead might be of a lesser concern regarding doses to the patient because usually lead components are located far away from the patient. This can pose a concern for shielding considerations. Contrary to lead, components made of brass like the collimator and the RMW made of low-density materials like polyethylene are usually closer to the patient during treatment.
Figure 6.

Event size spectra for the (a) polyethylene, (b) brass, and (c) lead stopping targets with the detector at 0°, 45°, 90° and 120° at 1 m from the target's centre. Each target data set was normalised by the beam current delivered and the run time. In addition, it was normalised by the maximum neutron-absorbed dose of the data set for the spectra shown here.
Figure 7.

Event size spectra for the polyethylene, brass and lead stopping targets at (a) 0°, (b) 45°, (c) 90°, and (d) 120° at 1 m from the target's centre. Each target data set was normalised by the beam current delivered and the run time. In addition, it was normalised by the maximum neutron-absorbed dose of the data set for the spectra shown here.
UNCERTAINTIES
There are types A and B uncertainties associated with these measurements and they are summarised in Table 3. Type A uncertainties are given by the statistical fluctuations during measurements. These are determined with the standard deviation of each lineal energy measurement. The statistical uncertainty is in the order of 6 % among the amplification gains used during these measurements. This uncertainty agrees with what others have reported(3, 27). Type B uncertainties, on the other hand, are those involving previous measured data, knowledge of instrument behaviour and manufacturer specifications, among others. In the microdosimetric measurements, the type B uncertainties are due to the alpha source calibration, W/e values, detector positioning and the collecting volume diameter. The alpha calibration is used to determine energy deposited per track length by charged particles. The calibration uncertainty is due to the determination of the alpha spectrum centroid and its lineal energy. This value was calculated elsewhere and is on the order of 3 %(24). The W/e uncertainty, on the other hand, is due to the assumption of a uniform value for all particles created in the detector. This uncertainty was reported to be of 3 %(32). The uncertainty associated with the detector positioning during measurements was calculated assuming a triangular distribution of the detector distance from the centre of the target or the isocentre of the water phantom with a confidence interval (k) of 2 for a 0.4 % uncertainty. Meanwhile, a rectangular distribution with k=1 was assumed for uncertainty in the diameter of the detector. The diameter is used for the neutron-absorbed dose calculation. The manufacturer provides this dimension. If this dimension was off by ±0.5 mm, it would introduce an uncertainty of 0.8 %. Adding the types A and B uncertainties in quadrature for k=1 give a combined uncertainty of 7.4 % and an expanded uncertainty for a coverage factor of 2 (k=2) of 14.8 %(33).
Table 3.
Uncertainties associated with microdosimetric measurements(34).
| Characteristics | Type A (%) | Type B (%) |
|---|---|---|
| Statistics | 6 | – |
| α Calibration | 3 | |
| W/e | 3 | |
| Collection volume diameter | 0.8 | |
| Positioning | 0.04 | |
| Combined standard uncertainty | 7.4 | |
| Expanded uncertainty | 14.8 |
CONCLUSIONS
These measurements showed higher neutron doses during the passive delivery of protons in comparison to dynamic delivery that agrees with recent studies. The neutron production due to thick targets was dominated by lead. From the materials used in the treatment nozzle lead and brass produce the highest DN/C. In addition, there was a predominant isotropic contribution from low-energy neutrons due to the interactions with lead and brass. For polyethylene, the contribution to DN/C was primarily due to high-energy neutrons in the forward direction. This is of special concern because most institutions use low atomic number materials like polyethylene for the range compensators mounted at the end of the nozzle. This could represent a major component of the neutron-absorbed dose received by the patient during proton therapy. Nevertheless, these results suggest that it might be possible to further reduce the neutron production during passive delivery if appropriate shielding is added to the treatment nozzle. Although, it will not be possible to completely eliminate the neutron exposures during passive delivery due to the nature of the technique.
FUNDING
This work was supported by the National Institute of Health: Ruth L. Kirschstein National Research Service Award Individual Predoctoral Fellowship Program (award number F31 CA119943-03), and by an award from the Medical Physics Foundation, Madison, WI, USA.
ACKNOWLEDGEMENTS
The authors thank the Midwest Proton Therapy Institute for allowing these measurements in their facility and for all their assistance. In addition, they also thank Chris Campe and Adam Hecht for their collaboration with the equipment setup during measurements.
REFERENCES
- 1.Langen K. M., Binns P. J., Schreuder A. N., Lenox A. J., DeLuca P. M., Jr Measurement of tissue to A-150 tissue equivalent plastic kerma ratio at two p(66)Be neutron therapy facilities. Phys. Med. Biol. 2003;48:1345–1359. doi: 10.1088/0031-9155/48/10/308. [DOI] [PubMed] [Google Scholar]
- 2.Siebers J. V., DeLuca P. M., Jr., Pearson D. W., Coutrakon G. Measurements of neutron dose equivalent and penetration in concrete for 230 MeV proton bombardment of Al, Fe, and Pb targets. Radiat. Prot. Dosim. 1992;44(1/4):247–251. [Google Scholar]
- 3.Waker A. J., Maughan R. L. Microdosimetric investigation of a fast neutron radiobiology facility utilizing the d(4)-9 Be reaction. Phys. Med. Biol. 1986;11:1281–1290. doi: 10.1088/0031-9155/31/11/010. [DOI] [PubMed] [Google Scholar]
- 4.Binns P. J., Hough J. H. Secondary dose exposure during 200 MeV proton therapy. Radiat. Prot. Dosim. 1997;79:441–444. [Google Scholar]
- 5.Coutrakon G., Cortese J., Ghebremedhin A., Hubbard J., Johanning J., Koss P., Maudsley G., Slater C. R., Zuccarelli C., Robertson J. Microdosimetry spectra of the Loma Linda proton beam and relative biological effectiveness comparisons. Med. Phys. 1997;24(9):1499–1596. doi: 10.1118/1.598038. [DOI] [PubMed] [Google Scholar]
- 6.Yonai S., Kase Y., Matsufuji N., Kanai T., Nishio N., Namba M., Yamashita W. Measurement of absorbed dose, quality factor, and dose equivalent in water phantom outside of the irradiation field in passive carbon-ion and proton radiotherapies. Med. Phys. 2010;37(8):4046–4055. doi: 10.1118/1.3458721. [DOI] [PubMed] [Google Scholar]
- 7.Schneider U., Agosteo S., Pedroni E. Secondary neutron dose during proton therapy using spot scanning. Int. J. Radiat. Oncol. Biol. Phys. 2002;53:244–251. doi: 10.1016/s0360-3016(01)02826-7. [DOI] [PubMed] [Google Scholar]
- 8.Tayama R., Fujita Y., Tadokoro M., Fujimaki H., Sakae T., Terunuma T. Measurement of neutron dose distribution for a passive scattering nozzle at the Proton Medical Research Center (PMRC) Nucl. Instrum. Methods A. 2006;564:532–536. [Google Scholar]
- 9.Fontenot J., Taddei P., Zheng Y., Mirkovic D., Jordan T., Newhauser W. Equivalent dose and effective dose from stray radiation during passively scattered proton radiotherapy for prostate cancer. Phys. Med. Biol. 2008;53:1–12. doi: 10.1088/0031-9155/53/6/012. [DOI] [PubMed] [Google Scholar]
- 10.Newhauser W. D., Fontenot J. D., Mahajan A., Kornguth D., Stovall M., Zheng Y., Taddei P. J., Mirkovic D., Mohan R., Cox J. D., et al. The risk of developing a second cancer after receiving craniospinal proton irradiation. Phys. Med. Biol. 2009;54:2277–2291. doi: 10.1088/0031-9155/54/8/002. [DOI] [PMC free article] [PubMed] [Google Scholar]
- 11.Hecksel D., Sandison G. A., Farr J. B., Edwards A. C. Scattered neutron dose equivalent from an active scanning proton beam delivery system. Australas. Phys. Eng. Sci. Med. 2007;30(4):326–330. [PubMed] [Google Scholar]
- 12.Agosteo S., Birattari C., Caravaggio M., SilariMand Tosi G. Secondary neutron and photon dose in proton therapy. Radiother. Oncol. 1998;48:293–305. doi: 10.1016/s0167-8140(98)00049-8. [DOI] [PubMed] [Google Scholar]
- 13.Yan X., Titt U., Koehler A. M., Newhauser W. D. Measurement of neutron dose equivalent to proton therapy patients outside of the proton radiation field. Nucl. Instrum. Methods A. 2002;476:429–434. [Google Scholar]
- 14.Polf J. C., Newhauser W. D. Calculations of neutron dose equivalent exposures from range-modulated proton therapy beams. Phys. Med. Biol. 2005;50:3859–3873. doi: 10.1088/0031-9155/50/16/014. [DOI] [PubMed] [Google Scholar]
- 15.Chu W. T., Ludewigt B. A., Renner T. R. Instrumentation for treatment of cancer using proton and light-ion beams. Rev. Sci. Instrum. 1993;64:2055–2122. [Google Scholar]
- 16.International Commission on Radiation Units and Measurements. ICRU; 1998. Proton dosimetry: Part 1. Beam production, beam delivery and measurement of absorbed dose. ICRU Report 59. [Google Scholar]
- 17.International Commission on Radiation Units and Measurements. ICRU; 2007. Prescribing, recording, reporting proton-beam therapy. ICRU Report 78. [Google Scholar]
- 18.Farr J. B., Mascia A. E., Hsi W. C., Allgower C. E., Jesseph F., Schreuder A. N., Wolanski M., Nichiporov D. F., Anferov V. Clinical characterization of a proton beam continuous uniform scanning system with dose layer stacking. Med. Phys. 2008;35(11):4945–4954. doi: 10.1118/1.2982248. [DOI] [PMC free article] [PubMed] [Google Scholar]
- 19.Kim A., Kim J. W., Hahn I., Schreuder N., Farr J. Simulations of therapeutic proton beam formation with GEANT4. J. Korean Phys. Soc. 2005;47(2):197–201. [Google Scholar]
- 20.Mesoloras G., Sandison G., Stewart R., Farr J., Hsi W.-C. Neutron scattered dose equivalent to a fetus from proton radiotherapy of the mother. Med. Phys. 2006;7:2479–2490. doi: 10.1118/1.2207147. [DOI] [PubMed] [Google Scholar]
- 21.International Commission on Radiation Units and Measurements. ICRU; 1983. Microdosimetry. ICRU Report 36. [Google Scholar]
- 22.Dietze G., Edwards A. A., Guldbakke S., Kludge H., Leroux J. B., Lirdbong L., Menzel H. G., Nguyen V. D., Schmitz T., Schuhmacher H. Investigation of radiation protection instruments based on tissue-equivalent proportional counters. 1988. Office for Official Publications of the European Communities.
- 23.Burmeister J., Kota C., Maughan R.L., Walker A. J. Miniature tissue-equivalent proportional counters for BNCEFNT dosimetry. Med. Phys. 2001;28(9):1911–1925. doi: 10.1118/1.1398303. [DOI] [PubMed] [Google Scholar]
- 24.Siebers J. V. University of Wisconsin-Madison; 1990. Shielding measurements for a 230 MeV proton beam. PhD thesis. [Google Scholar]
- 25.Rossi H. H. Specification of radiation quality. Radiat. Res. 1959;10:522–531. [PubMed] [Google Scholar]
- 26.Perez-Nunez D., Bravi L. Effects of wall thickness on measurements of dose for high energy neutrons. Health Phys. 2010;98(1):37–41. doi: 10.1097/HP.0b013e3181b8d032. [DOI] [PubMed] [Google Scholar]
- 27.Waker A. J. Experimental uncertainties in microdosimetry measurements and examination of the performance of three commercially produced proportional counters. Nucl. Instrum. Methods A. 1985;234:354–360. [Google Scholar]
- 28.Perez-Andujar A., Newhauser W. D., Deluca P. M. Neutron production from beam-modifying devices in a modern double scattering proton therapy beam delivery system. Phys. Med. Biol. 2009;54:993–1008. doi: 10.1088/0031-9155/54/4/012. [DOI] [PMC free article] [PubMed] [Google Scholar]
- 29.Zheng Y., Newhauser W., Fontenot J., Koch N., Mohan R. Monte Carlo simulations of stray neutron radiation exposures in proton therapy. J. Nucl. Mat. 2007;361:289–297. [Google Scholar]
- 30.Fontenot J. D., Newhauser W. D., Titt U. Design tools for the proton therapy nozzles based on the double scattering foil technique. Radiat. Prot. Dosim. 2005;116:211–215. doi: 10.1093/rpd/nci229. [DOI] [PubMed] [Google Scholar]
- 31.Siebers J. V., DeLuca P. M., Jr., Pearson W. Shielding measurements for 230-MeV protons. Nucl. Sci. Eng. 1993;115:13–23. [Google Scholar]
- 32.International Commission on Radiation Units and Measurements. ICRU; 1993. Average energy required to produce an ion pair. ICRU Report 31. [Google Scholar]
- 33.Taylor B. N., Kuyatt C. E. National Institute of Standards and Technology; 1994. Guidelines for evaluation and expressing the uncertainty of NIST measurement results. NIST Technical Note 1297. [Google Scholar]
- 34.Perez-Andujar A. Theoretical and experimental neutron dose determination for proton therapy delivery techniques. PhD thesis. University of Wisconsin-Madison (2011)