Abstract
The neural mechanism of unconsciousness has been a major unsolved question in neuroscience despite its vital role in brain states like coma and anesthesia. The existing literature suggests that neural connections, information integration, and conscious states are closely related. Indeed, alterations in several important neural circuitries and networks during unconscious conditions have been reported. However, how the whole-brain network is topologically reorganized to support different patterns of information transfer during unconscious states remains unknown. Here we directly compared whole-brain neural networks in awake and anesthetized states in rodents. Consistent with our previous report, the awake rat brain was organized in a nontrivial manner and conserved fundamental topological properties in a way similar to the human brain. Strikingly, these topological features were well maintained in the anesthetized brain. Local neural networks in the anesthetized brain were reorganized with altered local network properties. The connectional strength between brain regions was also considerably different between the awake and anesthetized conditions. Interestingly, we found that long-distance connections were not preferentially reduced in the anesthetized condition, arguing against the hypothesis that loss of long-distance connections is characteristic to unconsciousness. These findings collectively show that the integrity of the whole-brain network can be conserved between widely dissimilar physiologic states while local neural networks can flexibly adapt to new conditions. They also illustrate that the governing principles of intrinsic brain organization might represent fundamental characteristics of the healthy brain. With the unique spatial and temporal scales of resting-state fMRI, this study has opened a new avenue for understanding the neural mechanism of (un)consciousness.
Introduction
Loss of consciousness is not unusual in life. Anesthetic-induced unconsciousness is particularly interesting given its essential role in modern medicine. Although the molecular mechanisms of various anesthetic agents have been fairly well understood (Alkire et al., 2008; Brown et al., 2011), the system-level neural basis underlying anesthetic-induced unconsciousness is still obscure. In particular, how the whole-brain network is reorganized to support new patterns of information exchange in the anesthetized state remains largely unknown. Given the tight linkage among neural connectivity, information integration, and conscious states (Tononi, 2008), investigating this issue is essential for understanding consciousness.
The emerging technique of resting-state fMRI (rsfMRI) has been used to understand the alterations in neural circuitries and networks at unconscious conditions. Unlike conventional task-based fMRI, rsfMRI does not involve active stimuli but instead relies on low-frequency intrinsic fluctuations of the fMRI signal to examine functional connectivity (FC). Therefore, rsfMRI is particularly suitable for studies of unconsciousness. With this technique, it has been reported that FC might be correlated with the degree of consciousness in locked-in syndrome, minimally conscious state, vegetative state, and brain death (Boly et al., 2009; Cauda et al., 2009; Vanhaudenhuyse et al., 2010). In addition, changes in thalamocortical connectivity and frontoparietal connectivity under anesthetic-induced unconsciousness have been reported in humans (Boveroux et al., 2010; Deshpande et al., 2010; Martuzzi et al., 2010). Furthermore, effort has been made to explore the alteration of FC in several animal models in anesthetized conditions, though mainly by comparing different anesthetic depths without reference to the awake condition (Vincent et al., 2007; Moeller et al., 2009; Williams et al., 2010; Liu et al., 2011; Wang et al., 2011).
Despite these important contributions, it is unclear whether and how the organization of global functional networks is altered during unconsciousness. This issue is critical because it directly addresses the impact of unconsciousness on the governing principles of brain network organization. The organizational principles of human brain networks have been extensively studied by neuroimaging techniques in combination with graph-theory analysis. In such analysis, the brain network is modeled as a graph, with nodes being individual brain regions and edges being connections between nodes. Various topological properties like clustering coefficient can be evaluated with brain graphs (Rubinov and Sporns, 2010). Accumulating evidence has suggested that the topological architecture of the human brain network is governed by several fundamental principles such as small-worldness and modularity (Bullmore and Bassett, 2011). Importantly, it has been found that topological properties of functional networks are susceptible to various pathological disruptions (Bassett and Bullmore, 2009) such as Alzheimer's disease (Supekar et al., 2008) and schizophrenia (Liu et al., 2008).
We previously reported that the awake rat brain conserved fundamental topological properties in the same manner as the human brain (Liang et al., 2011). To further explore the intrinsic organization of the unconscious rat brain, here we have directly compared resting-state neural networks in the awake and anesthetized states. The changes of topology and FC strength of the anesthetized brain networks have been examined.
Materials and Methods
Animal preparation and MR experiment.
Imaging data were acquired in a previous study (Liang et al., 2012) and reprocessed for the purpose of this study. All studies were approved by the Institutional Animal Care and Use Committee of the University of Massachusetts Medical School. Briefly, 24 adult male Long–Evans rats (300–400 g) were housed in Plexiglas cages (two to a cage) and maintained in ambient temperature (22–24°C) on a 12 h light:12 h dark schedule. Food and water were provided ad libitum. Rats were acclimated to MRI restraint and noise for 7 d before imaging (for detailed acclimation procedures, see King et al., 2005; Zhang et al., 2010; Liang et al., 2011, 2012). On the imaging day, the animal was first briefly anesthetized with isoflurane when it was fit to a head restrainer with a built-in saddle coil. Isoflurane was then discontinued and the restrainer was placed in the scanner. Imaging sessions started ∼15–20 min after animals were placed in the magnet. All rats were fully awake during imaging. Of the 24 rats, 16 rats underwent the imaging session in the anesthetized condition at least 7 d after they were imaged in the awake condition. In this experiment, the animal-preparation procedure was the same as that in the awake imaging experiment. Isoflurane gas (2%) was then delivered to the animal through a nose cone in the magnet to maintain the anesthetized state. The body temperature of the animal was monitored and maintained at 37 ± 0.5°C by using a feedback controlling heating pad.
All experiments were performed on a Bruker 4.7T/40 cm horizontal magnet interfaced with a Biospec Bruker console. A dual 1H radiofrequency coil configuration (Insight NeuroImaging Systems) consisting of a volume coil for exciting the water proton spins and a surface coil for receiving the MRI signal was used. The volume and surface coils were actively tuned and detuned to prevent mutual coil coupling. For each session, anatomical images were acquired with a fast spin-echo sequence [rapid acquisition with refocusing echoes (RARE)] with the following parameters: TR = 2125 ms, RARE factor = 8, TE = 50 ms, matrix size = 256 × 256, FOV = 3.2 cm × 3.2 cm, slice number = 18, slice thickness = 1 mm. Gradient-echo images covering the whole brain were then acquired using the echo-planar imaging sequence with the following parameters: TR = 1 s, TE = 30 ms, flip angle = 60°, matrix size = 64 × 64, FOV = 3.2 cm × 3.2 cm, slice number = 18, slice thickness = 1 mm. Two hundred volumes were acquired for each run, and six runs were obtained for each session.
Data preprocessing.
All images were coregistered to a fully segmented rat atlas and were then subject to motion correction with SPM8 (http://www.fil.ion.ucl.ac.uk/spm/), spatial smoothing (FWHM = 1 mm), regression of motion parameters and the signals of white matter and ventricles, and 0.002–0.1 Hz bandpass filtering. Scans with excessive motion (>0.25 mm) were discarded.
Construction of whole-brain resting-state functional network.
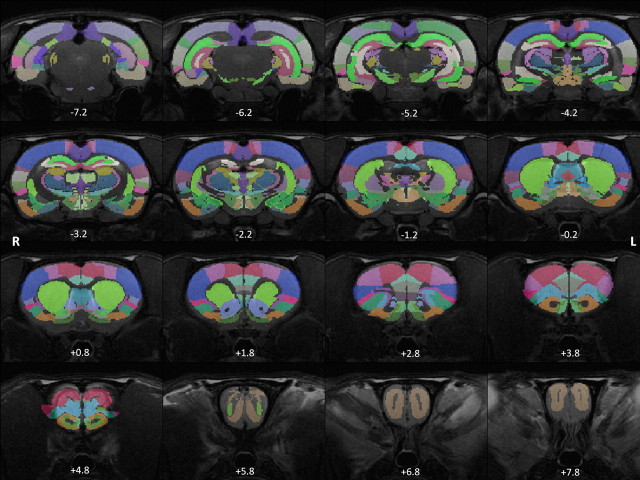
The rat brain was parcellated into 114 anatomical ROIs (57 regions for each hemisphere) using MIVA (http://ccni.wpi.edu/; Fig. 1). Anatomical definitions were based on the Swanson atlas (Swanson, 2004). See Table 1 for the complete list of all anatomical ROIs. Based on this parcellation scheme, a regionally averaged time course for each ROI was generated by averaging the time courses of all voxels within the ROI. FC was evaluated by Pearson correlation between the time courses of each pair of ROIs. Correlation coefficients (i.e., r values) were transformed to z scores by using Fisher's z transformation and averaged across all runs for each subject. Averaged z scores were then transformed back to r values. As a result, a 114 × 114 matrix of correlation coefficients was generated for each subject and each element of this matrix represented the strength of FC between two ROIs. To examine the reliability of FC, matrices of the awake and anesthetized conditions were each randomly split into two subgroups and averaged within each subgroup. The correlation between the FC strength of all functional connections between the two subgroups (i.e., the correlation between the corresponding elements of the two matrices) was then calculated for each condition. This process was repeated 1000 times to generate a measure of reliability. The result revealed high reliability of FC in both awake (mean ± SD, 0.93 ± 0.01) and anesthetized (mean ± SD, 0.90 ± 0.02) conditions.
Figure 1.
Parcellation scheme of the rat brain. Colored regions represent anatomically parcellated ROIs overlaid on anatomical images. Distance to bregma (in mm) is labeled at the bottom of each slice.
Table 1.
List of ROIs
| Anatomical–functional system | ROI (left, right) | Abbreviation | Full name |
|---|---|---|---|
| 1 | 1, 58 | AON | Anterior olfactory nucleus |
| 1 | 2, 59 | MOB | Main olfactory bulb |
| 1 | 3, 60 | PIR | Piriform area |
| 1 | 4, 61 | ILA | Infralimbic area |
| 1 | 5, 62 | TR | Postpiriform transition area |
| 1 | 6, 63 | MOp | Primary somatomotor area |
| 1 | 7, 64 | MOs | Secondary somatomotor areas |
| 1 | 8, 65 | GU | Gustatory area |
| 1 | 9, 66 | VISC | Visceral area |
| 1 | 10, 67 | TT | Tenia tecta |
| 1 | 11, 68 | SSp | Primary somatosensory area |
| 1 | 12, 69 | SSs | Supplemental somatosensory area |
| 1 | 13, 70 | AUD | Auditory areas |
| 1 | 14, 71 | VIS | Visual areas |
| 2 | 15, 72 | PTL | Parietal region |
| 2 | 16, 73 | TeV | Ventral temporal association areas |
| 2 | 17, 74 | PL | Prelimbic area |
| 2 | 18, 75 | ORB | Orbital area |
| 2 | 19, 76 | ACA | Anterior cingulate area |
| 2 | 20, 77 | AI | Agranular insular area |
| 2 | 21, 78 | ECT | Ectorhinal area |
| 2 | 22, 79 | RSP | Retrosplenial area |
| 3 | 23, 80 | ENT | Entorhinal area |
| 3 | 24, 81 | PAR | Parasubiculum |
| 3 | 25, 82 | POST | Postsubiculum |
| 3 | 26, 83 | PRE | Presubiculum |
| 3 | 27, 84 | SUB | Subiculum |
| 4 | 28, 85 | CA1 | Field CA1 |
| 4 | 29, 86 | DG | Dentate gyrus |
| 4 | 30, 87 | CA3 | Field CA3 |
| 5 | 31, 88 | COA | Cortical amygdalar nucleus |
| 5 | 32, 89 | AMG | Amygdala |
| 6 | 33, 90 | ACB | Nucleus accumbens |
| 6 | 34, 91 | CP | Caudoputamen |
| 6 | 35, 92 | OT | Olfactory tubercle |
| 6 | 36, 93 | FS | Striatal fundus |
| 6 | 37, 94 | LSX | Lateral septal complex |
| 7 | 38, 95 | BST | Bed nuclei stria terminalis |
| 7 | 39, 96 | MSC | Medial septal complex |
| 7 | 40, 97 | GP | Globus pallidus |
| 7 | 41, 98 | SI | Substantia innominata |
| 8 | 42, 99 | MG | medial geniculate complex |
| 8 | 43, 100 | ATN | anterior nuclei, dorsal thalamus |
| 8 | 44, 101 | VENT | Ventral nuclei, dorsal thalamus |
| 8 | 45, 102 | LAT | Lateral nuclei, dorsal thalamus |
| 8 | 46, 103 | MED | Medial nuclei, dorsal thalamus |
| 8 | 47, 104 | MTN | Midline group, dorsal thalamus |
| 8 | 48, 105 | LG | Lateral geniculate complex |
| 8 | 49, 106 | RT | Reticular nucleus thalamus |
| 8 | 50, 107 | ZI | Zona incerta |
| 9 | 51, 108 | MEZ | Medial zone of hypothalamus |
| 9 | 52, 109 | LZ | Lateral zone of hypothalamus |
| 9 | 53, 110 | PVZ | Periventricular zone of hypothalamus |
| 0 | 54, 111 | SNr | Substantia nigra |
| 0 | 55, 112 | VTA | Ventral tegmental area |
| 0 | 56, 113 | TRN | Tegmental reticular nucleus, pontine gray |
| 0 | 57, 114 | CLA | Claustrum |
The first column lists the number of the anatomical-functional system to which each ROI is affiliated (see Table 3), the second column lists the number of each ROI (the same number used in Fig. 5), the third column lists the abbreviation of each ROI (Fig. 3), the fourth column lists the full name of each ROI.
Graph theory analysis of the whole-brain network.
In a brain graph, a node represented an anatomical ROI and an edge represented the functional connection between two ROIs. All brain graphs were visualized by Pajek (http://pajek.imfm.si/doku.php). Matrices of individual subjects generated in the previous step were subject to density-based thresholding, similar to the procedure used by Zhang et al. (2011). Network density was defined as the ratio of existing edges to the maximal number of all possible edges in the network. A range of network densities were selected based on the following criteria. The lower boundary was selected to ensure the averaged degree was not smaller than 2 × log(N), where N was the total number of nodes (i.e., N = 114). This lower boundary guaranteed that the resulting networks were estimable networks (Watts and Strogatz, 1998). The upper boundary was selected to ensure that mean small-worldness (see below for the definition of small-worldness) of the awake brain was not smaller than 1.5. This upper boundary ensured that thresholded networks were biologically plausible in the sense of being small-world networks and had as few spurious edges as possible. As a result, the network density of each brain graph was thresholded in the range from 9% to 26% with a step size of 1%. At each threshold in this range, correlation coefficients of each matrix were first sorted from high numbers to low numbers. A binary matrix was then obtained by retaining the highest correlation coefficients and setting their values to 1, and the correlation coefficients of the rest of the matrix were set to 0. The portion of the correlation coefficients retained was equal to the threshold chosen (e.g., 9%). The averaged size of the largest connected networks ranged from 99.3 (at 9% density) to 112.5 (at 26% density) nodes for the awake condition, and from 101.2 (at 9% density) to 113.5 (at 26% density) nodes for the anesthetized condition.
The local clustering coefficient c was defined as follows:
 |
where Ej is the number of edges connecting the neighbors of node j, and Vj is the number of neighbors of node j. The global clustering coefficient C is the average of local clustering coefficients of all nodes within the network:
 |
where m is the total number of nodes of the network. Mean shortest path length was defined as the harmonic mean of the shortest path length between all possible pairs of nodes:
 |
where min_path is the shortest path length between nodes i and j. The harmonic mean was used to address the issue of infinite path length between disconnected nodes. Global clustering coefficient and mean shortest path length was normalized to the corresponding metrics of random networks (see below for details about random networks). Small-worldness was defined as the ratio of normalized global clustering coefficient to normalized mean shortest path length.
Betweenness centrality of a node v was defined as follows:
 |
where σst(v) = 1 if the shortest path between nodes s and t passes through node v, otherwise it was 0. Modularity was defined as follows:
where ki and kj were the degree of nodes i and j, respectively; ci was the group to which node i belongs, and δ(ci,cj) was the Kronecker delta symbol. For each network, Newman's algorithm (Newman, 2006) implemented in the Brain Connectivity Toolbox (https://sites.google.com/a/brain-connectivity-toolbox.net/bct/) was repeated 100 times and the modularity (Q) calculated for each repetition was then averaged. Modularity values were normalized to the corresponding values of random networks.
It has been reported that modularity-based network partition algorithms are complicated by the issue of degeneracy (Good et al., 2010). To avoid this problem and identify consistent community structures of the whole-brain functional network, the within-module connectivity likelihood method was adopted in the present study (Rubinov and Sporns, 2011). In the connectivity likelihood matrix, the value of each matrix entry measured how likely it was that both nodes (i.e., the column and row of this entry) were within the same module in all network partitions. Specifically, a matrix entry was assigned to 1 for each network partition if both nodes belonged to the same module and 0 otherwise. These matrices were then averaged across all partition repetitions, all network densities, and then all subjects to generate the final connectivity likelihood matrix. This approach has been used to reconstruct consistent community structures across a large number of network partitions (Rubinov and Sporns, 2011). In the current study, the likelihood matrix was based on the total partition numbers of 100 repetitions for each network × 18 network densities for each subject × the total number of subjects in each condition. The final community structure was created by thresholding the averaged within-module connectivity likelihood matrix at 0.75 for both conditions, meaning that if the likelihood for two nodes belonging to the same module was >0.75, they were considered in the same module.
To normalize network metrics of the awake and anesthetized conditions, each empirical network was randomized to generate 100 random networks with the same degree distribution. Network metrics (global clustering coefficient, mean shortest path length, and modularity) of random networks were then calculated. Finally, all empirical metrics were normalized to the corresponding metrics of random networks.
The area-under-the-curve method was used to summarize the results of aforementioned network metrics across the range of network density.
Statistics.
The statistical analysis of network metrics was performed with nonparametric permutation test (Nichols and Holmes, 2002). First, the difference between the means of the two conditions was calculated as the actual group difference. Second, the combined pool of the two conditions was resampled into two new groups. The mean of these two resampled groups was then calculated. This process was repeated 50000 times to generate a null distribution of the difference of the group mean. The p value of the actual group difference was calculated as the percentile in the null distribution. For local network metrics (i.e., local clustering coefficient and betweenness centrality), false discovery rate (FDR) correction was also performed to correct for multiple comparisons. p values <0.05 after FDR correction was considered statistically significant.
Connectional strength.
The connectional strength was compared between the corresponding connections of the awake and anesthetized conditions with the same permutation test. p value <0.05 after FDR correction was deemed statistically significant.
Physical distance.
The physical distance between two anatomical ROIs was defined as the Euclidean distance between the two ROIs' centers of mass. Coordinates of ROIs were obtained from the parcellated anatomical template. Mean connectivity strength was plotted against the physical distance, binned at 1 mm, for both conditions.
Results
The brain network was reorganized under the same governing principles at the anesthetized state
Although anesthesia can dramatically impact numerous brain functions, it is unknown whether the global functional neural network remains organized under similar principles. Here we compared four global network topological metrics (global clustering coefficient, mean shortest path length, small-worldness, and modularity) between the awake and anesthetized conditions. Strikingly, all four metrics showed no statistically significant difference between the two conditions (Fig. 2). Similar global clustering coefficients (p = 0.18) indicated a close level of cliquishness between brain regions, and similar mean shortest path length (p = 0.34) implied indistinguishable communication efficiency. Small-worldness, measured by the ratio of the first two metrics, was also not significantly different between the two conditions (p = 0.25). Lastly, comparing modularity between the awake and anesthetized conditions revealed a similar level of modular organization (p = 0.32). These results collectively demonstrated that the global neural network at the anesthetized state was topologically organized under the same governing principles as the awake state.
Figure 2.
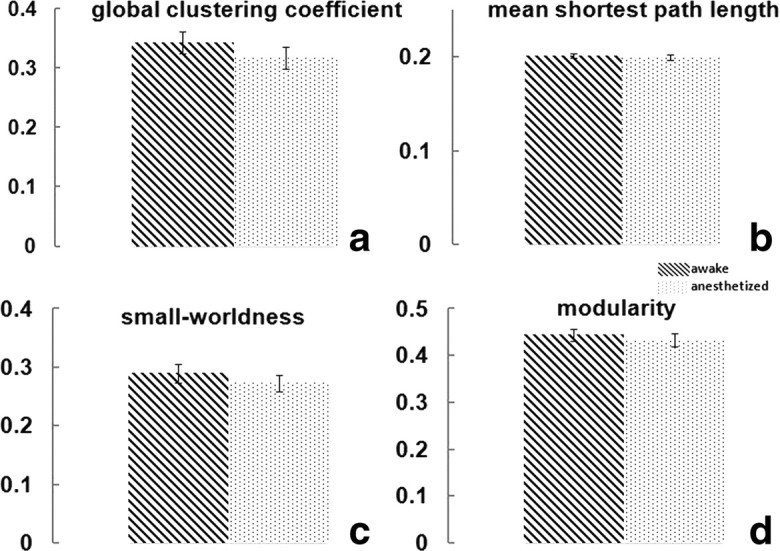
a–d, Consistent global topological features including global clustering coefficients (a; p = 0.18), mean shortest path lengths (b; p = 0.34), small-worldness (c; p = 0.25), and modularity (d; p = 0.32) during the awake and anesthetized states. Error bars indicate SEM. The difference between the awake and anesthetized states was evaluated by using nonparametric permutation test. Statistical significance was thresholded at p < 0.05.
Despite similar global topological properties, local topological metrics such as local clustering coefficient and betweenness centrality demonstrated pronounced changes in specific brain areas (p < 0.05, FDR corrected; Table 2). In particular, regions of the basal ganglia, including nucleus accumbens and septal nuclei, showed significantly reduced local clustering coefficients in the anesthetized condition. Also, several thalamic nuclei showed decreased betweenness centrality (Table 2), indicating impaired information relay in the thalamus in the anesthetized rat brain.
Table 2.
Altered local network metrics in the awake and anesthetized rat brain
| ROI | L | R | |
|---|---|---|---|
| Local clustering coefficient | ACB | × | × |
| AON | × | ||
| MSC | × | × | |
| LSX | × | × | |
| TT | × | × | |
| Betweeness centrality | LAT | × | |
| MTN | × | ||
| LG | × |
× indicates significantly decreased local network metrics in the anesthetized rat brain. L, left hemisphere, R, right hemisphere.
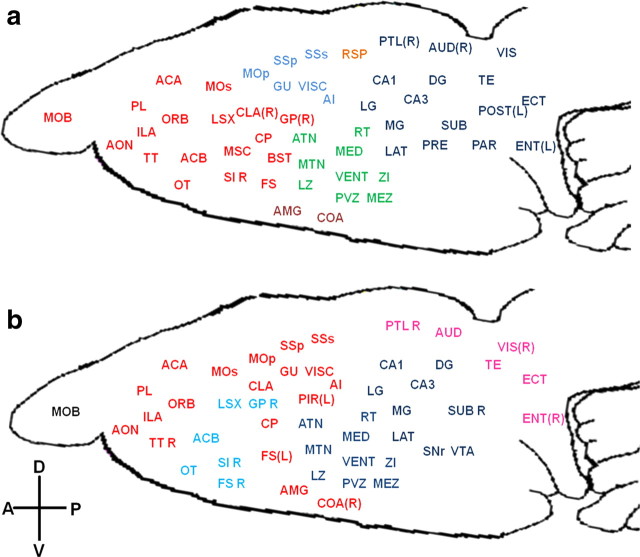
Additional changes in local connectivity were examined through the measure of community structure. By using the within-module connectivity likelihood method (see Materials and Methods, above), it is possible to reveal consistent modules across different network densities and subjects in the awake and anesthetized conditions, respectively (Rubinov and Sporns, 2011). Figure 3a showed that the awake rat brain was primarily comprised of a frontal module (red), a sensory-motor module (light blue), a thalamo-hypothalamo module (green), a thalamo-hippocampal-posterior cortices module (dark blue), a bilateral retrosplenial cortex module, and an amygdala complex module. In contrast, the anesthetized rat brain was considerably reorganized in community structure. The cortex was mainly divided into an anterior module and a posterior module, and subcortical areas were reorganized into a hypothalamo-thalamo-hippocampal module and a basal ganglia module. Notably, unlike the awake brain in which cortical or subcortical regions frequently mingled together into a single community structure, cortex and subcortex tended to be isolated in separate communities in the anesthetized state. For example, all thalamic nuclei, the hypothalamus, and the hippocampus were clustered in one module without much involvement of cortex in the anesthetized condition (Fig. 3b, dark blue), whereas part of thalamus and the whole hippocampus were in the same community with posterior cortical regions at the awake condition (Fig. 3a, dark blue). The same scenario also occurred in the frontal module of the awake brain, which included the frontal cortex and basal ganglia, whereas they were separated into different modules in the anesthetized brain (Fig. 3b, red and light blue). These results collectively indicate that the cortical–subcortical communication was significantly compromised in the anesthetized condition.
Figure 3.
a, b, Community structures in the awake (a) and anesthetized (b) conditions. ROIs with the same color are within the same module. ROIs without the annotation of “L” or “R” suggest the modules include bilateral sides. L, Left; R, right; A, anterior; P, posterior; V, ventral; D, dorsal. See Table 1 for the list of abbreviations of brain regions.
Alterations in FC strength at specific anatomical locations
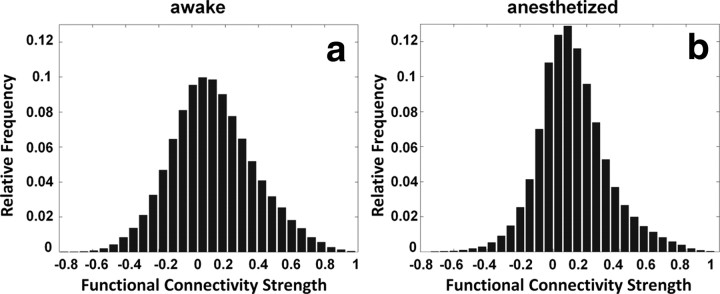
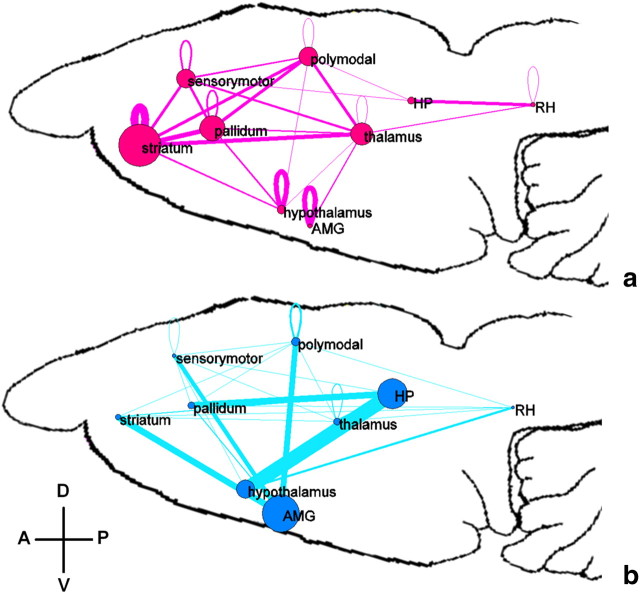
The distributions of connectivity strength of all functional connections across the whole brain in both awake and anesthetized conditions are shown in Figure 4. Consistent with previous studies (Peltier et al., 2005; Boveroux et al., 2010; Martuzzi et al., 2010), the connectivity strength on average was significantly lower in the anesthetized condition (two-sample t test, p < 10−10). Specific anatomical information of significantly changed FC was further revealed by individually comparing the corresponding connections between the two conditions (p < 0.05, FDR corrected; Fig. 5). To better conceptualize the complex pattern of altered FC, ROIs of the whole brain were divided into nine major functional-anatomical groups based on the Swanson Atlas (Swanson, 2004) (Table 3), and altered FC within and between these groups was displayed in brain graphs (Fig. 6). To preserve the quantitative information, the weight of the edge between two groups was proportional to the percentage of the total number of significantly changed connections between the two groups (p < 0.05 with FDR correction) relative to the total number of all possible connections between the two groups. The node size was proportional to the percentage of the total number of significantly changed connections within the group relative to the total number of all possible connections within the group. The results showed that FC was profoundly weakened in striatum, pallidum, thalamus, and cortices, albeit considerably strengthened in hippocampus, amygdala, and hypothalamus in the anesthetized condition.
Figure 4.
a, b, Histograms of functional connectivity strength in awake (a) and anesthetized (b) conditions. The connectivity strength was, on average, significantly weaker in the anesthetized condition (two-sample t test, p < 10−10).
Figure 5.
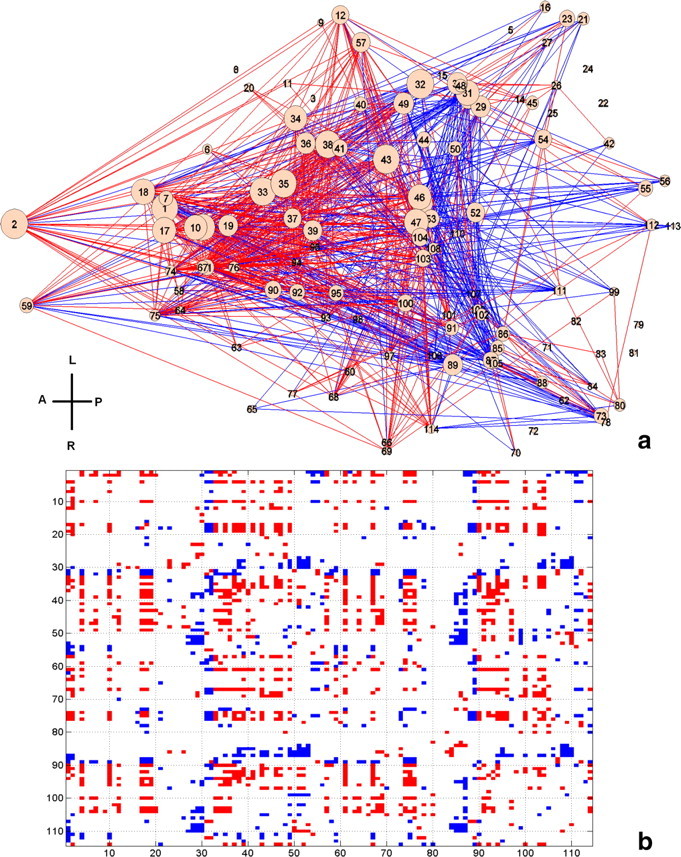
a, Significantly changed functional connectivity (p < 0.05, FDR corrected) displayed in the dorsal view of the rat brain. Each node represents an anatomical region listed in Table 1. Red (blue) lines indicate connections with significantly stronger (weaker) connectivity in the awake condition. The size of each node is proportional to the number of altered connections for this node. b, Matrix representation of a. Red (blue) elements are connections with significantly stronger (weaker) connectivity strength in the awake condition. A, Anterior; P, posterior; V, ventral; D, dorsal. The numbers on the x- and y-axes are the ROI numbers listed in Table 1.
Table 3.
List of nine major anatomical–functional systems
| Group number | Designation in Figure 6 | Anatomical–functional system |
|---|---|---|
| 1 | Sensorymotor | Sensory-motor |
| 2 | Polymodal | Polymodal association |
| 3 | RH | Retrohippocampal regions |
| 4 | HP | Hippocampus |
| 5 | AMG | Amygdala complex |
| 6 | Striatum | Striatum |
| 7 | Pallidum | Pallidum |
| 8 | Thalamus | Thalamus |
| 9 | Hypothalamus | Hypothalamus |
| 0 | Not included |
Figure 6.
a, b, Significantly decreased (a) and increased (b) functional connectivity during the anesthetized state. ROIs of the whole brain were divided into nine major functional–anatomical groups (Table 3) based on the Swanson Atlas (Swanson, 2004). The weight of edges in both graphs was proportional to the percentage of the total number of significantly changed connections relative to the total number of all possible connections between the two groups. The node size was proportional to the percentage of the total number of significantly changed connections within the group divided by the total number of all possible connections within the group. A, Anterior; P, posterior; V, ventral; D, dorsal. See Table 3 for the list of abbreviations of nine anatomica—functional systems.
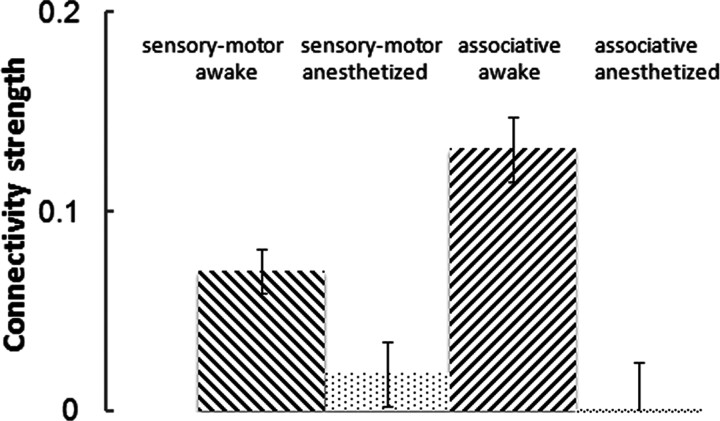
Recently, Boveroux et al. (2010) reported a selective decrease of thalamocortical connectivity in high-order associative networks compared with low-level sensory–motor networks in the anesthetized condition. In the present study, we specifically compared the thalamocortical connectivity strength in associative networks (i.e., between associative cortices and thalamic nuclei related to associative cortices) and sensory–motor networks (i.e., between sensory–motor cortices and thalamic nuclei related to sensory–motor cortices) between the awake and anesthetized conditions. As expected, thalamocortical connectivity strength in both types of networks was reduced under anesthesia (p < 0.0001; Fig. 7). More importantly, there was a significant interaction effect (p = 0.022) between the category of thalamic nuclei (i.e., related to associative or sensory–motor cortices) and awake/anesthetized conditions. Thus, this result clearly indicates that thalamocortical connectivity in associative networks was more affected than that in low-level sensory–motor networks under anesthesia.
Figure 7.
Connectivity strength changes in thalamocortical connections between the awake and anesthetized conditions. The thalamus was segregated into seven nuclei. Among these nuclei, medial geniculate complex, lateral geniculate complex, and ventral nuclei are related to low-level sensory-motor cortices; anterior nuclei, lateral nuclei, medial nuclei, and midline group are related to high-level associative cortices (Swanson, 2004). Sensory-motor is FC between sensory-motor cortices and thalamic nuclei related to sensory-motor cortices. Associative is FC between associative cortices and thalamic nuclei related to associative cortices. ANOVA analysis with factors thalamic nuclei (sensory-motor/associative) and condition (awake/anesthetized): nuclei: p = 0.2; condition: p < 0.0001; interaction: p = 0.022.
The relationship between the strength and physical distance of functional connections
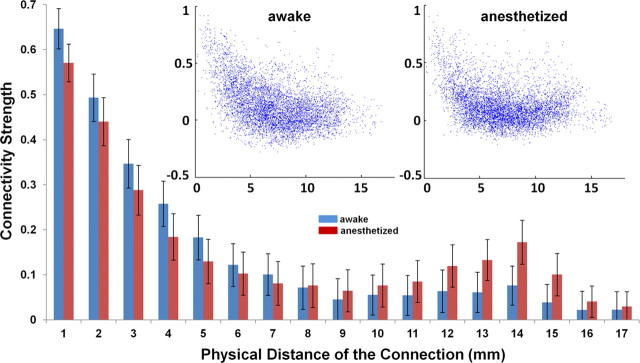
It has been long hypothesized that anesthesia affects the information integration of neural networks by reducing long-distance functional connections (Alkire et al., 2008). To elucidate this issue, we examined the relationship between the physical distance and connectivity strength across all functional connections. Figure 8 demonstrates that FC strength nonlinearly decreased as the physical distance between two ROIs increased for both awake and anesthetized conditions (Fig. 8, insert). However, in the long-distance range (>10 mm), the connectivity strength appears to rebound, and this trend was even more pronounced in the anesthetized condition. In contrast, the strength of short-distance connections was decreased in the anesthetized condition. Our results suggest that long-distance connections were not preferentially reduced in the anesthetized condition.
Figure 8.
Connectivity strength as a function of physical distance. Anesthesia does not preferentially reduce long-distance functional connections. Bars are SEM. Insert, Scatter plots of functional connectivity strength versus physical distance. Left, Awake state. Right, Anesthetized state; x-axis, physical distance of the functional connection (in mm); y-axis, connectivity strength.
Discussion
In the present study, we examined changes in whole-brain neural networks in anesthetized rats. Our results suggest that functional neural networks are reorganized from the awake to anesthetized state, and this reorganization was governed by the same topological principles. One remarkable finding was that, although the connectivity strength was, on average, decreased in the anesthetized condition, long-distance connections were not preferentially reduced. To our knowledge, this is the first study to examine the reconfiguration of the architecture of large-scale resting-state neural networks in the anesthetized state by directly comparing topological features and connectivity strength between the awake and anesthetized brains in animals.
Perhaps the most important finding of the present study is the preservation of global topological characteristics of the whole-brain neural network in the anesthetized state. Among all global network metrics calculated, only global clustering coefficients showed a marginal, statistically insignificant decrease (p = 0.18). Mean shortest path length was even slightly shorter in the anesthetized condition, suggesting the overall information integration capacity is not impaired in the anesthetized rat brain. Likewise, small-worldness and modularity did not show any changes between the two states, again indicating a similar level of modular organization. Numerous human rsfMRI studies have shown altered topological features of the global network (e.g., global clustering coefficient) in various neurological and psychiatric diseases (Bassett and Bullmore, 2009), implying that the architecture of the brain network might be sensitive to pathological disruptions. Given the profound impact of anesthesia on brain functions, it is striking that the anesthetized brain was able to maintain intact global organization. However, this result was consistent with a previous human EEG study, in which global scale-free organization was found to be preserved across consciousness, anesthesia, and recovery states (Lee et al., 2010). Therefore, this conclusion is very likely not limited to the specific spatial and temporal scales of the rsfMRI technique. An important implication of this finding is that, unlike disrupted global networks in pathological conditions, the brain is able to maintain intact topological structures under pharmacologically induced unconsciousness. This property might be related to the ability of the brain to quickly recover from the unconscious state to the conscious state once the anesthetic is discontinued. It may also suggest that the governing principles of intrinsic brain organization might be fundamental characteristics of the healthy brain.
Despite similar global network topology, local neural networks were considerably reorganized in the anesthetized rat brain. For instance, local clustering coefficients of the nucleus accumbens and septal nuclei were significantly reduced by anesthesia, suggesting those regions were less connected to their neighboring regions in the anesthetized condition. Interestingly, these two regions were reported to enhance anesthetic effects when they were pharmacologically inactivated (Ma et al., 2002; Ma and Leung, 2006). In addition, a rat study reported reduced glutamate and aspartate levels in the nucleus accumbens during sleep (Léna et al., 2005). These results and the findings of the present study collectively underscore the importance of the nucleus accumbens and septal nuclei in anesthetic-induced unconsciousness. Furthermore, several thalamic nuclei showed a significant reduction in betweenness centrality, indicating reduced information relay in the thalamus in the anesthetized rat brain. Consistent with the report by Boveroux et al. (2010), we also observed a preferential reduction in high-level thalamocortical connectivity relative to low-level thalamocortical connectivity under anesthesia (Fig. 7). Together, these findings well agree with the extensive literature regarding the role of thalamus in anesthesia and (un)consciousness (Nallasamy and Tsao, 2011). Moreover, detailed community structure considerably differed even at a similar global modularity (Q) value. Consistent with our previous study (Liang et al., 2011), modules in the awake brain were more likely to contain both cortical and subcortical regions, whereas modules in the anesthetized brain tend to include only cortical or only subcortical regions, implying compromised communications between the cortex and subcortex. Together, these results clearly suggested that although the global organizational principles were not changed at the anesthetized state, the brain networks are locally reorganized to support new patterns of information integration among neuronal groups.
It has been repeatedly reported that anesthesia can change FC strength between brain regions (Peltier et al., 2005; Boveroux et al., 2010; Martuzzi et al., 2010; Stamatakis et al., 2010). For instance, our previous study reported decreased anticorrelated FC between the infralimbic cortex and amygdala in anesthetized rodents (Liang et al., 2012). Additionally, Liu and colleagues (2011) found that FC decreased as the anesthetic depth increased. Consistent with these results, in the present study we found that the connectivity strength was, on average, weaker in the anesthetized condition. When individually comparing the corresponding functional connections between the awake and anesthetized states, most significantly changed connections were weaker in connectivity strength at the anesthetized condition, and these connections were spatially distributed throughout cortical and subcortical areas (Fig. 5). Therefore, our data indicated that the effect of anesthesia was widespread across the whole brain. However, it has to be noted that anesthesia did not uniformly affect all brain regions and functional connections. In fact, the basal ganglia area, including the striatum and pallidum, showed the largest decrease in FC strength. In contrast, a number of functional connections showed increased connectivity strength in the anesthetized state, particularly in hippocampus, hypothalamus, and amygdala. These brain regions and connections are relatively less studied regarding their roles in anesthesia. Interestingly, all these regions are part of the limbic system that generally subserves the functions of emotion, memory, and homeostatic regulation. Therefore, it can be hypothesized that anesthesia, or perhaps unconsciousness in a more general case, can lead to hypersynchrony in this part of the limbic system.
Another interesting aspect of connectional strength is its relation with the physical distance of the functional connection. It has been suggested that the disruption of long-distance functional connections, in particular frontoparietal connections, contributes to unconsciousness (Laureys and Schiff, 2012). However, in the present study, we observed that long-distance functional connections were not particularly diminished at the anesthetic-induced unconscious state; rather, the short-distance connections showed obvious reductions (Fig. 8). This result suggests that the disruption of long-distance connectivity is not necessarily a general mechanism of unconsciousness. However, it does not exclude the possibility that certain long-distance connections might play a key role in maintaining consciousness. Further studies are necessary to identify these potentially vital long-distance connections.
There are several methodological limitations in the present study. First, different levels of motion can affect network metrics as well as the connectional strength (Power et al., 2012; Satterthwaite et al., 2012; Van Dijk et al., 2012). This issue was particularly troublesome when the awake condition had higher motion level than the anesthetized condition. However, a stringent motion control was applied in our study to address this problem. Scans with head displacement >0.25 mm (i.e., half-voxel size) were discarded, all scans were motion-corrected, and motion parameters were regressed out. It should be noted that even with the rigorous control of motion, the influence of motion on FC may still persist (Power et al., 2012; Satterthwaite et al., 2012; Van Dijk et al., 2012). To further examine this issue, global network metrics were recalculated from a subset of data with the smallest motion at the awake condition (movement < 0.125 mm). The motion level in this sub-dataset did not significantly differ from the anesthetized condition (p > 0.1). Results were in excellent agreement with those calculated from the whole dataset. In addition, a very similar relationship between connectional strength and physical distance was obtained in this subset of data. Therefore, it is unlikely that different levels of motion can account for the changes between the two conditions observed in the present study. Second, the anesthetic agent used (i.e., isoflurane) is a vasodilator. The vasodilatory effect might have significant effects on the fMRI signal. However, Liu and colleagues (2011) reported a strong neurovascular coupling in isoflurane-anesthetized rats, suggesting resting-state FC measured by rsfMRI in isoflurane-anesthetized rats was mostly of neural origin. Third, only one type of anesthetic agent was used at one dosage in the present study. Whether these results can be generalized to other anesthetic agents and/or different dosages needs to be confirmed in future studies.
The explicit neural mechanism underlying anesthetic-induced unconsciousness is likely to be extremely complex and to manifest at various spatial and temporal scales. Here, our results show that the integrity of the whole-brain network can be conserved in a wide physiologic range from awake to anesthetized states while local neural networks can flexibly adapt in new conditions. They also illustrate that the governing principles of intrinsic brain organization might represent fundamental characteristics of the healthy brain. With the unique spatial and temporal scale provided by rsfMRI, this study has opened a new avenue for investigating the neural mechanism underlying anesthetic-induced unconsciousness. Considering that all unconscious states share many of the same endpoints in brain functions, such as amnesia, analgesia, immobility, and attenuation of autonomic responses to noxious stimulation (Barash et al., 2009), our results may help to decipher other unconscious states, such as coma.
Footnotes
This work was supported by the institutional fund of the University of Massachusetts Medical School and NIH Grant 5R01DA021846-02. We thank Meghan Heffernan and Suzanne Czerniak for their discussions.
References
- Alkire MT, Hudetz AG, Tononi G. Consciousness and anesthesia. Science. 2008;322:876–880. doi: 10.1126/science.1149213. [DOI] [PMC free article] [PubMed] [Google Scholar]
- Barash PG, Cullen BF, Stoelting RK, Cahalan M, Stock MC. Clinical anesthesia. 6 edition. Philadelphia: Lippincott Williams and Wilkins; 2009. [Google Scholar]
- Bassett DS, Bullmore ET. Human brain networks in health and disease. Curr Opin Neurol. 2009;22:340–347. doi: 10.1097/WCO.0b013e32832d93dd. [DOI] [PMC free article] [PubMed] [Google Scholar]
- Boly M, Tshibanda L, Vanhaudenhuyse A, Noirhomme Q, Schnakers C, Ledoux D, Boveroux P, Garweg C, Lambermont B, Phillips C, Luxen A, Moonen G, Bassetti C, Maquet P, Laureys S. Functional connectivity in the default network during resting state is preserved in a vegetative but not in a brain dead patient. Hum Brain Mapp. 2009;30:2393–2400. doi: 10.1002/hbm.20672. [DOI] [PMC free article] [PubMed] [Google Scholar]
- Boveroux P, Vanhaudenhuyse A, Bruno MA, Noirhomme Q, Lauwick S, Luxen A, Degueldre C, Plenevaux A, Schnakers C, Phillips C, Brichant JF, Bonhomme V, Maquet P, Greicius MD, Laureys S, Boly M. Breakdown of within- and between-network resting state functional magnetic resonance imaging connectivity during propofol-induced loss of consciousness. Anesthesiology. 2010;113:1038–1053. doi: 10.1097/ALN.0b013e3181f697f5. [DOI] [PubMed] [Google Scholar]
- Brown EN, Purdon PL, Van Dort CJ. General anesthesia and altered states of arousal: a systems neuroscience analysis. Annu Rev Neurosci. 2011;34:601–628. doi: 10.1146/annurev-neuro-060909-153200. [DOI] [PMC free article] [PubMed] [Google Scholar]
- Bullmore ET, Bassett DS. Brain graphs: graphical models of the human brain connectome. Annu Rev Clin Psychol. 2011;7:113–140. doi: 10.1146/annurev-clinpsy-040510-143934. [DOI] [PubMed] [Google Scholar]
- Cauda F, Micon BM, Sacco K, Duca S, D'Agata F, Geminiani G, Canavero S. Disrupted intrinsic functional connectivity in the vegetative state. J Neurol Neurosurg Psychiatry. 2009;80:429–431. doi: 10.1136/jnnp.2007.142349. [DOI] [PubMed] [Google Scholar]
- Deshpande G, Kerssens C, Sebel PS, Hu X. Altered local coherence in the default mode network due to sevoflurane anesthesia. Brain Res. 2010;1318:110–121. doi: 10.1016/j.brainres.2009.12.075. [DOI] [PMC free article] [PubMed] [Google Scholar]
- Good BH, de Montjoye YA, Clauset A. Performance of modularity maximization in practical contexts. Phys Rev E Stat Nonlin Soft Matter Phys. 2010;81 doi: 10.1103/PhysRevE.81.046106. 046106. [DOI] [PubMed] [Google Scholar]
- King JA, Garelick TS, Brevard ME, Chen W, Messenger TL, Duong TQ, Ferris CF. Procedure for minimizing stress for fMRI studies in conscious rats. J Neurosci Methods. 2005;148:154–160. doi: 10.1016/j.jneumeth.2005.04.011. [DOI] [PMC free article] [PubMed] [Google Scholar]
- Laureys S, Schiff ND. Coma and consciousness: paradigms (re)framed by neuroimaging. Neuroimage. 2012;61:478–491. doi: 10.1016/j.neuroimage.2011.12.041. [DOI] [PubMed] [Google Scholar]
- Lee U, Oh G, Kim S, Noh G, Choi B, Mashour GA. Brain networks maintain a scale-free organization across consciousness, anesthesia, and recovery: evidence for adaptive reconfiguration. Anesthesiology. 2010;113:1081–1091. doi: 10.1097/ALN.0b013e3181f229b5. [DOI] [PMC free article] [PubMed] [Google Scholar]
- Léna I, Parrot S, Deschaux O, Muffat-Joly S, Sauvinet V, Renaud B, Suaud-Chagny MF, Gottesmann C. Variations in extracellular levels of dopamine, noradrenaline, glutamate, and aspartate across the sleep–wake cycle in the medial prefrontal cortex and nucleus accumbens of freely moving rats. J Neurosci Res. 2005;81:891–899. doi: 10.1002/jnr.20602. [DOI] [PubMed] [Google Scholar]
- Liang Z, King J, Zhang N. Uncovering intrinsic connectional architecture of functional networks in awake rat brain. J Neurosci. 2011;31:3776–3783. doi: 10.1523/JNEUROSCI.4557-10.2011. [DOI] [PMC free article] [PubMed] [Google Scholar]
- Liang Z, King J, Zhang N. Anticorrelated resting-state functional connectivity in awake rat brain. Neuroimage. 2012;59:1190–1199. doi: 10.1016/j.neuroimage.2011.08.009. [DOI] [PMC free article] [PubMed] [Google Scholar]
- Liu X, Zhu XH, Zhang Y, Chen W. Neural origin of spontaneous hemodynamic fluctuations in rats under burst-suppression anesthesia condition. Cereb Cortex. 2011;21:374–384. doi: 10.1093/cercor/bhq105. [DOI] [PMC free article] [PubMed] [Google Scholar]
- Liu Y, Liang M, Zhou Y, He Y, Hao Y, Song M, Yu C, Liu H, Liu Z, Jiang T. Disrupted small-world networks in schizophrenia. Brain. 2008;131:945–961. doi: 10.1093/brain/awn018. [DOI] [PubMed] [Google Scholar]
- Ma J, Leung LS. Limbic system participates in mediating the effects of general anesthetics. Neuropsychopharmacology. 2006;31:1177–1192. doi: 10.1038/sj.npp.1300909. [DOI] [PubMed] [Google Scholar]
- Ma J, Shen B, Stewart LS, Herrick IA, Leung LS. The septohippocampal system participates in general anesthesia. J Neurosci. 2002;22:RC200. doi: 10.1523/JNEUROSCI.22-02-j0004.2002. [DOI] [PMC free article] [PubMed] [Google Scholar]
- Martuzzi R, Ramani R, Qiu M, Rajeevan N, Constable RT. Functional connectivity and alterations in baseline brain state in humans. Neuroimage. 2010;49:823–834. doi: 10.1016/j.neuroimage.2009.07.028. [DOI] [PMC free article] [PubMed] [Google Scholar]
- Moeller S, Nallasamy N, Tsao DY, Freiwald WA. Functional connectivity of the macaque brain across stimulus and arousal states. J Neurosci. 2009;29:5897–5909. doi: 10.1523/JNEUROSCI.0220-09.2009. [DOI] [PMC free article] [PubMed] [Google Scholar]
- Nallasamy N, Tsao DY. Functional connectivity in the brain: effects of anesthesia. Neuroscientist. 2011;17:94–106. doi: 10.1177/1073858410374126. [DOI] [PubMed] [Google Scholar]
- Newman ME. Modularity and community structure in networks. Proc Natl Acad Sci U S A. 2006;103:8577–8582. doi: 10.1073/pnas.0601602103. [DOI] [PMC free article] [PubMed] [Google Scholar]
- Nichols TE, Holmes AP. Nonparametric permutation tests for functional neuroimaging: a primer with examples. Hum Brain Mapp. 2002;15:1–25. doi: 10.1002/hbm.1058. [DOI] [PMC free article] [PubMed] [Google Scholar]
- Peltier SJ, Kerssens C, Hamann SB, Sebel PS, Byas-Smith M, Hu X. Functional connectivity changes with concentration of sevoflurane anesthesia. Neuroreport. 2005;16:285–288. doi: 10.1097/00001756-200502280-00017. [DOI] [PubMed] [Google Scholar]
- Power JD, Barnes KA, Snyder AZ, Schlaggar BL, Petersen SE. Spurious but systematic correlations in functional connectivity MRI networks arise from subject motion. Neuroimage. 2012;59:2142–2154. doi: 10.1016/j.neuroimage.2011.10.018. [DOI] [PMC free article] [PubMed] [Google Scholar]
- Rubinov M, Sporns O. Complex network measures of brain connectivity: uses and interpretations. Neuroimage. 2010;52:1059–1069. doi: 10.1016/j.neuroimage.2009.10.003. [DOI] [PubMed] [Google Scholar]
- Rubinov M, Sporns O. Weight-conserving characterization of complex functional brain networks. Neuroimage. 2011;56:2068–2079. doi: 10.1016/j.neuroimage.2011.03.069. [DOI] [PubMed] [Google Scholar]
- Satterthwaite TD, Wolf DH, Loughead J, Ruparel K, Elliott MA, Hakonarson H, Gur RC, Gur RE. Impact of in-scanner head motion on multiple measures of functional connectivity: relevance for studies of neurodevelopment in youth. Neuroimage. 2012;60:623–632. doi: 10.1016/j.neuroimage.2011.12.063. [DOI] [PMC free article] [PubMed] [Google Scholar]
- Stamatakis EA, Adapa RM, Absalom AR, Menon DK. Changes in resting neural connectivity during propofol sedation. PLoS One. 2010;5:e14224. doi: 10.1371/journal.pone.0014224. [DOI] [PMC free article] [PubMed] [Google Scholar]
- Supekar K, Menon V, Rubin D, Musen M, Greicius MD. Network analysis of intrinsic functional brain connectivity in Alzheimer's disease. PLoS Comput Biol. 2008;4:e1000100. doi: 10.1371/journal.pcbi.1000100. [DOI] [PMC free article] [PubMed] [Google Scholar]
- Swanson LW. Brain maps: structure of the rat brain. San Diego: Elsevier; 2004. [Google Scholar]
- Tononi G. Consciousness as integrated information: a provisional manifesto. Biol Bull. 2008;215:216–242. doi: 10.2307/25470707. [DOI] [PubMed] [Google Scholar]
- Van Dijk KR, Sabuncu MR, Buckner RL. The influence of head motion on intrinsic functional connectivity MRI. Neuroimage. 2012;59:431–438. doi: 10.1016/j.neuroimage.2011.07.044. [DOI] [PMC free article] [PubMed] [Google Scholar]
- Vanhaudenhuyse A, Noirhomme Q, Tshibanda LJ, Bruno MA, Boveroux P, Schnakers C, Soddu A, Perlbarg V, Ledoux D, Brichant JF, Moonen G, Maquet P, Greicius MD, Laureys S, Boly M. Default network connectivity reflects the level of consciousness in non-communicative brain-damaged patients. Brain. 2010;133:161–171. doi: 10.1093/brain/awp313. [DOI] [PMC free article] [PubMed] [Google Scholar]
- Vincent JL, Patel GH, Fox MD, Snyder AZ, Baker JT, Van Essen DC, Zempel JM, Snyder LH, Corbetta M, Raichle ME. Intrinsic functional architecture in the anaesthetized monkey brain. Nature. 2007;447:83–86. doi: 10.1038/nature05758. [DOI] [PubMed] [Google Scholar]
- Wang K, van Meer MP, van der Marel K, van der Toorn A, Xu L, Liu Y, Viergever MA, Jiang T, Dijkhuizen RM. Temporal scaling properties and spatial synchronization of spontaneous blood oxygenation level-dependent (BOLD) signal fluctuations in rat sensorimotor network at different levels of isoflurane anesthesia. NMR Biomed. 2011;24:61–67. doi: 10.1002/nbm.1556. [DOI] [PubMed] [Google Scholar]
- Watts DJ, Strogatz SH. Collective dynamics of ‘small-world’ networks. Nature. 1998;393:440–442. doi: 10.1038/30918. [DOI] [PubMed] [Google Scholar]
- Williams KA, Magnuson M, Majeed W, LaConte SM, Peltier SJ, Hu X, Keilholz SD. Comparison of alpha-chloralose, medetomidine and isoflurane anesthesia for functional connectivity mapping in the rat. Magn Reson Imaging. 2010;28:995–1003. doi: 10.1016/j.mri.2010.03.007. [DOI] [PMC free article] [PubMed] [Google Scholar]
- Zhang J, Wang J, Wu Q, Kuang W, Huang X, He Y, Gong Q. Disrupted brain connectivity networks in drug-naive, first-episode major depressive disorder. Biol Psychiatry. 2011;70:334–342. doi: 10.1016/j.biopsych.2011.05.018. [DOI] [PubMed] [Google Scholar]
- Zhang N, Rane P, Huang W, Liang Z, Kennedy D, Frazier JA, King J. Mapping resting-state brain networks in conscious animals. J Neurosci Methods. 2010;189:186–196. doi: 10.1016/j.jneumeth.2010.04.001. [DOI] [PMC free article] [PubMed] [Google Scholar]


