

Abstract
The exchange of water molecules between the inner-sphere of a paramagnetic chemical exchange saturation transfer (PARACEST) contrast agent and bulk water can shorten the bulk water T2 through the T2-exchange (T2ex) mechanism. The line-broadening T2ex effect is proportional to the agent concentration, the chemical shift of the exchanging water molecule, and is highly dependent on the water molecule exchange rate. A significant T2ex contribution to the bulk water linewidth can make the regions of agent uptake appear dark when imaging with conventional sequences like Gradient-Echo and Fast Spin-Echo. The minimum echo times for these sequences (1 to 10 msec) are not fast enough to capture signal from the regions of shortened T2. This makes “Off” (saturation at -Δω) minus “On” (saturation at +Δω) imaging of PARACEST agents difficult since the regions of uptake are dark in both images. It is shown here that the loss of bulk water signal due to T2ex can be reclaimed using the ultra-short TE times (<10 μsec) achieved with the Sweep Imaging With Fourier Transform (SWIFT) pulse sequence. Modification of the SWIFT sequence for PARACEST imaging is first discussed, followed by parameter optimization using in vitro experiments. In vivo PARACEST studies comparing Fast Spin-Echo to SWIFT were performed using EuDOTA-(gly)4- uptake in healthy mouse kidneys. The results show that the negative contrast caused by T2ex can be overcome using the ultra-short TE achieved with SWIFT, thereby enabling fast and sensitive in vivo PARACEST imaging.
Keywords: CEST, PARACEST, SWIFT, T2 contrast, T2 exchange, in vivo
Introcuction
Exogenous contrast agents are often administered intravenously during magnetic resonance imaging studies to highlight specific parts of the anatomy or to measure dynamic processes (1). Current contrast agents alter the water proton T1 or T2 relaxation rates, causing regions of tissue uptake to appear brighter or darker than the surrounding tissue. Chemical exchange saturation transfer (CEST) agents use a combination of proton spin saturation and chemical exchange to create negative contrast (i.e. darkening) in magnetic resonance images (2). Protons bound to a CEST agent are frequency shifted away from the bulk water frequency with the difference defined as Δω. Radiofrequency spin saturation at the exchanging proton frequency (Δω) can produce partial saturation of the bulk water protons through chemical exchange, provided that the rate of exchange between the bound and bulk proton pools is much slower than their frequency difference (i.e. kex ≪ Δω) (3). The magnitude of the bulk water signal reduction is a function of CEST agent concentration, radiofrequency saturation power and duration, and proton exchange rate. Diamagnetic CEST (DIACEST) agents exchange −NH and −OH bound protons with bulk water protons and have typical chemical shifts of around 1 to 5 ppm (4). Paramagnetic CEST (PARACEST) agents exchange either a water molecule bound to the inner sphere of a lanthanide ion (Ln3+ ≠ La, Gd, or Lu) with the bulk water, or −NH protons on the ligand with bulk water protons (5). The chemical shifts of water molecule protons bound to a PARACEST agent (e.g. 50 to -600 ppm) are much larger than the −NH or −OH protons of DIACEST agents, allowing for faster exchange rates as well as saturation of the bound proton pool without direct saturation of the bulk proton pool (6). One advantage CEST contrast agents have over Gd-based T1 agents is that the image contrast can be turned on or off by the radiofrequency saturation pulse that precedes the imaging pulse sequence. Also, the ability to have a wide range of bound proton frequencies means that multiple agents could, in principle, be injected and imaged independently. Such agents hold great potential to further extend the functional and molecular imaging capabilities of MR (7,8). Some examples include measuring tissue pH (9,10), beta-cell function (11,12), Zn2+ ion concentration (13), and the tissue distribution of glucose (14-16).
We have recently shown for Eu3+-based PARACEST agents that the same water molecule exchange that enables the CEST effect can also facilitate severe bulk water line-broadening via the T2-exchange (T2ex) mechanism (17). T2ex can significantly reduce the bulk water T2 (i.e. negative contrast) even in the absence of a CEST saturation pulse. This causes the PARACEST agent to behave like a susceptibility or T2 agent even though the origin of the T2 contrast is completely different. The magnitude of the line-broadening T2ex effect is determined by the PARACEST agent concentration, the chemical shift of the exchanging water molecule, and the rate of water exchange between the bound and bulk water pool. Early applications of T2ex with diamagnetic molecules containing exchangeable −NH or −OH protons focused on suppressing the strong water signal in high-resolution proton NMR spectroscopy (18-24). T2ex was first proposed as a method for MRI contrast using diamagnetic complexes (25) and has recently been studied in vitro using the −NH proton exchange of Iopamidol (26). A current challenge for in vivo imaging of PARACEST agents is that a significant T2ex contribution can make regions of tissue uptake appear dark in both the “Off” (saturation at -Δω) and “On” (saturation at +Δω) images when using conventional pulse sequences like Fast Spin-Echo and Gradient-Echo. Having the regions of uptake appear dark in both images makes “Off” minus “On” CEST imaging difficult, as the signal difference between the two is minimized. We first observed this phenomena in mouse kidneys (after intravenous injection) and in tumors grown from human cancer cell xenografts (after intra-tumoral injection) while imaging untargeted Eu3+-based PARACEST agents in vivo (27). T2ex has also recently been observed in mouse kidneys using a Tm3+-based PARACEST agent and the OPARACHEE (on-resonance paramagnetic agent chemical exchange effect) pulse sequence (28,29). These image-darkening effects were seen because the minimum TE for these sequences (1 to 10 ms) was not short enough to capture signal from the regions of reduced T2 caused by T2ex.
We hypothesized that the ultra-short TE times (< 10 μs) used in the Sweep Imaging with Fourier Transform (SWIFT) pulse sequence could reclaim the loss in signal due to T2ex and enable fast and sensitive in vivo PARACEST imaging. The SWIFT protocol uses swept radio frequency excitation interleaved with nearly simultaneous acquisition to obtain images with essentially zero TE times. The SWIFT technique is similar to the classic rapid scan correlation experiment used in spectroscopy (30,31) and was first published in detail in 2006 (32). Along with TE times that are two-orders of magnitude smaller than conventional Gradient-Echo 3D imaging, other advantages of SWIFT include insensitivity to motion and flow noise, insensitivity to Bo inhomogeneities from changes in susceptibility (e.g. air to tissue transitions in the lung), and fast and silent acquisition of true 3D data. In this article, we first describe how the SWIFT protocol was modified for fast and sensitive CEST imaging (SWIFT-CEST). Details of the SWIFT-CEST parameter optimization using in vitro samples of the EuDOTA-(gly)4- PARACEST agent are given. We then show that SWIFT-CEST can be used to overcome T2ex effects by performing simple “Off” minus “On” CEST imaging of EuDOTA-(gly)4- uptake in healthy mouse kidneys at 9.4 T. The SWIFT-CEST images are also compared to Fast Spin-Echo Multi-Slice images (FSEMS-CEST) under the same conditions.
Materials and Methods
Software and Hardware
The SWIFT Launch Kit from Steady State Imaging (Minneapolis, MN) was used in these experiments. The kit included the SWIFT software (beta version 580) for Agilent MRI systems (Santa Clara, CA) and a 33 mm diameter SWIFT-compatible surface coil made from non-hydrogen containing materials (e.g. Teflon). Both the in vitro and in vivo experiments were performed on an Agilent 9.4 T small animal imaging system running VnmrJ software (version 2.3 A). The optional SWIFT fat saturation (fatsat) pulse was modified for use as the frequency-selective CEST saturation pulse. Fat saturation in SWIFT is achieved by applying a brief saturation pulse, tuned to the adipose tissue methylene proton (CH2) resonance frequency at 1.3 ppm, followed by a certain number of SWIFT “views”, where each view is a single spoke in the spherical k-space spiral (33). The number of views acquired between saturation pulses (the “nturbo” value) typically ranges from 16 to 32. The fatsat and nturbo pattern is then repeated until the total number of requested SWIFT views is acquired. For example, 8192 total views with an nturbo of 16 gives 512 fatsat pulses used during acquisition. Details of the SWIFT pulse sequence are given in reference (32). The SWIFT fatsat pulse was modified in three ways for CEST imaging applications. First, the fatsat pulse width limit was increased to allow up to a 5 second long pulse. Second, in order to help build up the saturation before imaging, the fatsat pulses were included in the dummy scans. Third, to also help build up saturation before imaging, the option of placing a 5 second long saturation pulse before the dummy scans was enabled. A schematic of the SWIFT-CEST pulse sequence is shown in Fig. 1. The repeated pattern of saturation followed by partial k-space filling used in SWIFT-CEST is similar to that used for CEST imaging with the Fast Spin-Echo Multi-Slice sequence (FSEMS-CEST) (34).
FIG. 1.

A schematic of the SWIFT-CEST pulse sequence. The modified fat saturation (fatsat) pulses are included in both the dummy scans (512 views total) and the acquisition scans (8192 views total). An optional pre-phase encode loop saturation pulse (up to 5 seconds long) was added to insure steady-state saturation before the imaging pulses.
In Vitro Experiments
A 2 mL vial of EuDOTA-(gly)4- (75 mM) and a 2 mL vial of water (as a control) were used to experimentally determine the optimal SWIFT-CEST settings. The objective was to maximize CEST sensitivity while minimizing scan time. Both vials were placed together at the center of the 33 mm diameter SWIFT-compatible surface coil. The coil was then positioned at the gradient iso-center of the Agilent 9.4 T (400 MHz) small animal system. The ambient temperature inside the gradient was 18 °C during the scans. The global SWIFT-CEST settings used were TR = 1.23 msec, averages = 1, dummy scans = 512, points per view (np) = 128, total views = 8192, spirals = 1, field of view = 100 mm, sweep width = 125 kHz, gain = 10, and flip angle = 6 degrees. The effective TE (i.e. τa from reference (32)) for these settings was approximately 9 μsec. For each fatsat pulse-width used (fatsat_pw = 0.5, 1, 3, or 5 sec) the value of nturbo was arrayed (nturbo = 16, 32, 64, 128, 256, or 512), with each setting giving a different total acquisition time. For each fatsat_pw and nturbo setting, the mean pixel value of the EuDOTA-(gly)4- vial was first measured with saturation at the “Off” frequency (fatsat_tof = -22,400 Hz, or -56 ppm) and then again at the “On” frequency (fatsat_tof = +22,400 Hz, or 56 ppm). The percent drop in water signal in the EuDOTA-(gly)4- vial (i.e. (1-On/Off)×100) was used to determine the sensitivity of each fatsat_pw and nturbo setting, with sensitivity being proportional to signal drop. A fatsat B1 power (fatsat_pwr) of 20 μT was used for all in vitro experiments. These data were used to determine which fatsat_pw and nturbo settings provided fast and sensitive SWIFT-CEST images.
In Vivo Experiments
Imaging data were acquired on an Agilent 9.4 T (400 MHz) small animal MRI system using the 33 mm diameter SWIFT-compatible surface coil from Steady State Imaging. The mouse was placed through the center of the surface coil with the coil plane transecting the kidneys axially. The coil and mouse were then placed at the gradient iso-center. The core temperature of the healthy female Black-6 mouse (20 g mass) was monitored with a rectal thermocouple and maintained at 37 °C with heated air using the animal monitoring system from Small Animal Instruments (Stony Brook, NY). A 1.0 mmol/kg dose of EuDOTA-(gly)4- was administered in 200 μL via tail vein injection prior to imaging. The pH and the osmolarity of the sample were adjusted to 7.0 and 300 mOsm, respectively, before injection. The SWIFT-CEST “Off” and “On” images were acquired at 25 minutes post-injection while the FSEMS-CEST “Off” and “On” images were acquired at 35 minutes post-injection. The SWIFT-CEST settings were TR = 1.23 msec, effective TE (i.e. τa) ≈ 9 μsec, averages = 1, dummy scans = 512, points per view (np) = 128, total views = 8192, spirals = 4, field of view = 50 mm, sweep width = 125 kHz, gain = 20 dB, flip angle = 6 degrees, fatsat pulse-width = 0.5 sec, nturbo = 64, fatsat power = 20 μT, with an image scan time of 4 minutes 57 seconds and a pixel resolution of 0.391 mm. The FSEMS-CEST settings were TR = 5070 msec, TE = 8.41 msec, echo train = 8, averages = 4, dummy scans = 5, matrix = 128 × 128 × 1 pixels, field of view = 38 × 38 × 2 mm, saturation time = 5 sec, saturation power = 20 μT, with an image scan time of 5 minutes 35 seconds and an in-plane pixel resolution of 0.297 mm. An Off/On saturation frequency of -/+ 20,800 Hz (-/+ 52 ppm) was used for each image protocol. Respiration gating was not used for the in vivo images.
Results
In Vitro Results
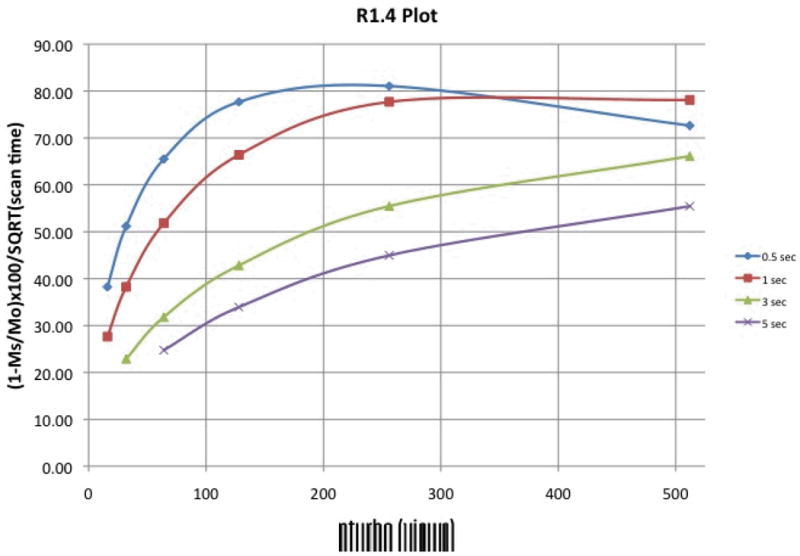
A plot of absolute CEST effect (defined here as the percent drop in signal between the “Off” and “On” images, i.e. (1-On/Off)×100 or (1-MS/MO)×100) versus nturbo is shown in Fig. 2a, where each line represents data for a different saturation pulse length (fatsat_pw). It can be seen that the CEST effect decreases as nturbo increases, and decreases more rapidly for shorter saturation pulse lengths. This is expected as larger nturbo values mean more views (and thus more time) between the saturation pulses, during which any built up saturation begins to disappear as the spins return to Boltzman levels. Fig. 2a illustrates that maximum CEST sensitivity is achieved using a long saturation time and small nturbo value. For example, a saturation pulse length of 3 seconds with an nturbo of 32 views gives an 85% CEST effect. Yet, it can also be seen that short saturation pulses with small nturbo values give similar CEST effects. For example, a saturation pulse-width of 0.5 seconds with an nturbo of 16 views gives an 83% CEST effect. The largest CEST effects seen in Fig. 2a are similar to those achieved by imaging the sample with Gradient-Echo (77% CEST effect) and Fast Spin-Echo (87% CEST effect) using a 5 second long, 20 μT saturation pulse.
FIG. 2.

(a) A plot of CEST effect versus SWIFT-CEST nturbo values for several different fatsat pulse lengths (shown at right). The CEST effect decreases as nturbo increases for each pulse length, with shorter pulse lengths decreasing more rapidly. (b) A plot of total scan time versus SWIFT-CEST nturbo values for several different fatsat pulse lengths. The total scan time increases as nturbo decreases for each pulse length.
A plot of total scan time versus nturbo is shown in Fig. 2b, where again each line represents data for a different saturation pulse length. Although long saturation times and small nturbo values give the highest CEST effects (Fig. 2a) they also give the longest scan times (Fig. 2b) with the highest CEST effects having scan times over 10 minutes long. We also see from Fig. 2b that shorter saturation times with small nturbo values, which have similar CEST effects as seen in Fig. 2a, have much shorter scan times. For example, when comparing a 3 second long saturation pulse with 32 views to a 0.5 long saturation pulse with 16 views, a 64% reduction in scan time (14 to 5 minutes) can be achieved with only a 4% drop in CEST sensitivity (85% to 82%).
Based on these in vitro data, a 0.5 second long saturation pulse with an nturbo of 64 views was used for in vivo imaging. Although the CEST effect for these parameters (75%) is 12% lower than the maximum seen in Fig. 2a, the approximately 1 minute scan time allows for improved SNR by acquiring four spherical k-space spirals in less than 5 minutes. It is important to note that the same saturation pulse lengths and nturbo values used during data acquisition were also used during the 512 dummy views. Also, it was observed that using a 5 second long saturation pulse before the dummy views yielded no increase in CEST effect. This suggests that including the saturation pulses in the dummy views is sufficient to build up the saturation to a steady-state. Therefore, the pre-dummy scan saturation pulse was omitted for the in vitro and in vivo data.
In Vivo Results
Fig. 3 shows an example of negative image contrast generated in vivo from a PARACEST agent with a strong T2ex contribution to the bulk water linewidth. The figure shows Fast Spin-Echo images of healthy mouse kidneys before (Fig. 3a) and 30 minutes after (Fig. 3b) a 0.5 mmol/kg intravenous dose of EuDOTA-(gly)4-. The same in vivo Fast Spin-Echo settings previously described in Methods were used, but without saturation (here TR = 2500 ms, and total scan time = 3 min). An injection volume of 200 μL was used for the 20 g mouse. A 60% drop in kidney signal due to T2ex was observed. The concentration of PARACEST agent within the kidneys is much higher than that of normal vascular space due to nephron filtration of the agent from the blood. This makes the kidneys an ideal location to observe T2ex, which is proportional to agent concentration. For an injection volume of 150 μL to 200 μL, the peak concentration of PARACEST agent within the mouse kidneys has been estimated to be 20% to 25% of the injected concentration (28). Therefore, the EuDOTA-(gly)4- concentration within the kidneys in Fig. 3b is approximately 10 mM.
FIG. 3.

(a) A 2 mm thick Fast Spin-Echo coronal slice of healthy mouse kidneys before injection of PARACEST agent. (b) The same slice 30 minutes after a 0.5 mmol/kg intravenous dose of EuDOTA-(gly)4-. A 60% drop in kidney signal is seen due to T2 shortening from T2ex.
Fig. 4 compares mouse kidney images taken with FSEMS-CEST to those taken with SWIFT-CEST. Each image was taken sequentially after a 1.0 mmol/kg intravenous dose of EuDOTA-(gly)4- and shows the same 2 mm thick coronal slice. For the FSEMS-CEST data (Fig. 4a-c) there is very little difference in kidney signal intensity between the “Off” (Fig. 4a) and the “On” (Fig. 4b) images. Therefore, no obvious kidney CEST signal is seen in the “Off” minus “On” image (Fig. 4c). The small amount of kidney signal seen in Fig. 4c has the same intensity as the motion noise in the phase encoding direction. The minimum TE for the FSEMS-CEST sequence (TE = 8.41 msec) is not short enough to capture adequate signal from the regions of reduced T2 inside the kidneys, leading to low SNR in the CEST image. Fig. 4d-f shows the results obtained with SWIFT-CEST, which are notably different. With SWIFT-CEST, the kidney images now appear bright in the “Off” image (Fig. 4d) and dark in the “On” image (Fig. 4e). This leads to a much larger signal difference and improved SNR for the CEST image (Fig. 4f). With SWIFT-CEST imaging, the uptake of the agent by the kidneys is obvious, with intensity differences between the renal cortex, medulla, and pelvis clearly seen. Quantitative analysis showed a 50% average reduction in signal intensity within the kidneys when comparing “Off” versus “On” SWIFT-CEST images.
FIG. 4.

(a-c) A CEST image sequence taken with FSEMS-CEST after a 1.0 mmol/kg intravenous dose of EuDOTA-(gly)4-. No obvious kidney signal was observed in the “Off” minus “On” difference image. (d-f) The same coronal slice as in (a-c) acquired using SWIFT-CEST. The uptake of the agent by the kidneys is now clearly seen in the CEST image.
Disscussion
It is known from previous PET/CT data collected after injection of EuDOTA-(gly)4- doped with a small amount of 64CuDOTA-(gly)4- that untargeted agents such as this are cleared from the vascular space by the kidneys and deposited into the bladder (27). A typical clinical dose of 0.1 mmol/kg showed a strong PET signal in both the kidneys and bladder, with signal remaining in the kidneys for over an hour. Imaging the agent within the bladder is easily achieved using Fast-Spin Echo or Gradient-Echo “Off” minus “On” CEST techniques and is similar to in vitro CEST imaging. This is primarily due to the largely aqueous content of the bladder, relatively low agent concentration, and lack of magnetization transfer (MT) effect (35). Yet, using these same protocols to image the kidney uptake is problematic, and is mainly due to the high concentration of agent within the kidneys leading to an increased T2ex effect and shortened bulk water T2. By using SWIFT-CEST, the kidney images were no longer dark in both the “Off” and “On” saturation images, but rather are dark in only the “On” image (Fig. 4). Therefore, imaging the agent in kidney tissue is now as simple and straightforward as imaging the agent in the bladder.
Although SWIFT-CEST can overcome T2ex, the MT effect is still present in tissues like the kidneys. The in vivo MT effect, which is caused by proton exchange with tissue macromolecules, spans from approximately 100 to -100 ppm and can mask the CEST effect by significantly reducing the difference between the “Off” and “On” images. In order to overcome the kidney tissue MT effect caused by the CEST saturation pulse, high concentrations of EuDOTA-(gly)4- (Δω = 50 ppm) were used. It has been estimated that for a 0.4 mmol/kg in 150 μL dose of PARACEST agent (50 mM) the concentration within the kidneys reaches a maximum of 10 mM within 10 to 25 minutes post injection (28). Although these concentrations might seem high for molecular imaging, they are necessary for the strong MT effect not to dominate the kidney CEST images. Yet, these high concentrations lead to a large T2ex effect and thus, complications from negative contrast. One potential method to overcome the MT effect and to improve CEST sensitivity is to use a lanthanide atom with an exchange frequency outside of the MT effect window, for example Tb3+ (Δω = -600 ppm) (36). Unfortunately, the increase in Δω will also lead to an increase in T2ex, especially for agents with intermediate water exchange rates (17). Also, unlike Eu3+, Tb3+ and other lanthanide ion complexes exhibit significant paramagnetism, which (like T2ex) will reduce the bulk water T2 in regions of agent uptake. Therefore, SWIFT-CEST will most likely also be needed to image PARACEST agents that have chemical exchange frequencies outside the MT window. Other potential applications for SWIFT-CEST include imaging polymeric PARACEST agents (which have multiple lanthanide atoms per molecule, and thus high intrinsic concentrations) (37) and imaging at higher fields (which also increases T2ex).
One drawback of the current hardware used for SWIFT-CEST imaging is that the 33 mm diameter surface coil has a large excitation volume when compared to the mouse kidney volume. If the SWIFT field of view is confined to just the kidneys (e.g. 25 mm diameter) then signal from the tissue outside the field of view is “folded back” on to the image, creating distortion and poor SNR. SWIFT imaging is greatly improved when the excitation volume is equal to the subject volume. This allows for better image quality through higher resolution and better SNR. In order to improve our future SWIFT-CEST imaging, a custom SWIFT-compatible volume coil with an excitation length of 25 mm is currently being constructed.
Conclusion
These data show that the ultra-short TE used in SWIFT-CEST (<10 μsec) is able to overcome T2ex contrast by capturing the signal from the regions of reduced T2 inside the kidneys, allowing for fast and sensitive CEST imaging using simple “Off” minus “On” techniques.
Acknowledgments
The authors would like to thank Dr. Robert Lenkinski and Dr. Elena Vinogradov at the Beth Israel Deaconess Medical Center (Boston, MA) for providing the EuDOTA-(gly)4- used in these experiments. This research was supported in part by grants from the National Institutes of Health (RR-02584, EB-004582, and CA-115531) and the Robert A. Welch Foundation (AT-584).
References
- 1.Caravan P, Ellison JJ, McMurry TJ, Lauffer RB. Gadolinium(III) chelates as MRI contrast agents: Structure, dynamics, and applications. Chem Rev. 1999;99(9):2293–2352. doi: 10.1021/cr980440x. [DOI] [PubMed] [Google Scholar]
- 2.Zhang S, Winter P, Wu K, Sherry AD. A novel europium(III)-based MRI contrast agent. J Am Chem Soc. 2001;123(7):1517–1518. doi: 10.1021/ja005820q. [DOI] [PubMed] [Google Scholar]
- 3.Ward KM, Aletras AH, Balaban RS. A new class of contrast agents for MRI based on proton chemical exchange dependent saturation transfer (CEST) J Magn Reson. 2000;143(1):79–87. doi: 10.1006/jmre.1999.1956. [DOI] [PubMed] [Google Scholar]
- 4.van Zijl PC, Yadav NN. Chemical exchange saturation transfer (CEST): what is in a name and what isn't? Magn Reson Med. 2011;65(4):927–948. doi: 10.1002/mrm.22761. [DOI] [PMC free article] [PubMed] [Google Scholar]
- 5.Viswanathan S, Kovacs Z, Green KN, Ratnakar SJ, Sherry AD. Alternatives to gadolinium-based metal chelates for magnetic resonance imaging. Chem Rev. 2010;110(5):2960–3018. doi: 10.1021/cr900284a. [DOI] [PMC free article] [PubMed] [Google Scholar]
- 6.Zhang SR, Sherry AD. Physical characteristics of lanthanide complexes that act as magnetization transfer (MT) contrast agents. J Solid State Chem. 2003;171(1-2):38–43. [Google Scholar]
- 7.Gore JC, Manning HC, Quarles CC, Waddell KW, Yankeelov TE. Magnetic resonance in the era of molecular imaging of cancer. Magn Reson Imaging. 2011;29(5):587–600. doi: 10.1016/j.mri.2011.02.003. [DOI] [PMC free article] [PubMed] [Google Scholar]
- 8.Weissleder R, Mahmood U. Molecular imaging. Radiology. 2001;219(2):316–333. doi: 10.1148/radiology.219.2.r01ma19316. [DOI] [PubMed] [Google Scholar]
- 9.Aime S, Barge A, Castelli DD, Fedeli F, Mortillaro A, Nielsen FU, Terreno E. Paramagnetic lanthanide(III) complexes as pH-sensitive chemical exchange saturation transfer (CEST) contrast agents for MRI applications. Magnet Reson Med. 2002;47(4):639–648. doi: 10.1002/mrm.10106. [DOI] [PubMed] [Google Scholar]
- 10.Aime S, Delli Castelli D, Terreno E. Novel pH-reporter MRI contrast agents. Angew Chem Int Edit. 2002;41(22):4334–4336. doi: 10.1002/1521-3773(20021115)41:22<4334::AID-ANIE4334>3.0.CO;2-1. [DOI] [PubMed] [Google Scholar]
- 11.Lin M, Lubag A, McGuire MJ, Seliounine SY, Tsyganov EN, Antich PP, Sherry AD, Brown KC, Sun XK. Advances in molecular imaging of pancreatic beta cells. Front Biosci. 2008;13:4558–4575. doi: 10.2741/3023. [DOI] [PMC free article] [PubMed] [Google Scholar]
- 12.Woods M, Zhang S, Sherry AD. Toward the Design of MR Agents for Imaging beta-Cell Function. Curr Med Chem Immunol Endocr Metab Agents. 2004;4(4):349–369. doi: 10.2174/1568013043357338. [DOI] [PMC free article] [PubMed] [Google Scholar]
- 13.Trokowski R, Ren J, Kalman FK, Sherry AD. Selective sensing of zinc ions with a PARACEST contrast agent. Angew Chem Int Ed Engl. 2005;44(42):6920–6923. doi: 10.1002/anie.200502173. [DOI] [PubMed] [Google Scholar]
- 14.Ren J, Trokowski R, Zhang S, Malloy CR, Sherry AD. Imaging the tissue distribution of glucose in livers using a PARACEST sensor. Magn Reson Med. 2008;60(5):1047–1055. doi: 10.1002/mrm.21722. [DOI] [PMC free article] [PubMed] [Google Scholar]
- 15.van Zijl PC, Jones CK, Ren J, Malloy CR, Sherry AD. MRI detection of glycogen in vivo by using chemical exchange saturation transfer imaging (glycoCEST) Proc Natl Acad Sci U S A. 2007;104(11):4359–4364. doi: 10.1073/pnas.0700281104. [DOI] [PMC free article] [PubMed] [Google Scholar]
- 16.Zhang S, Trokowski R, Sherry AD. A paramagnetic CEST agent for imaging glucose by MRI. J Am Chem Soc. 2003;125(50):15288–15289. doi: 10.1021/ja038345f. [DOI] [PubMed] [Google Scholar]
- 17.Soesbe TC, Merritt ME, Green KN, Rojas-Quijano FA, Sherry AD. T(2) exchange agents: A new class of paramagnetic MRI contrast agent that shortens water T(2) by chemical exchange rather than relaxation. Magn Reson Med. 2011 doi: 10.1002/mrm.22938. [DOI] [PMC free article] [PubMed] [Google Scholar]
- 18.Leigh JS. Relaxation Times in Systems with Chemical Exchange - Some Exact Solutions. J Magn Reson. 1971;4(3):308–311. [Google Scholar]
- 19.Granot J, Fiat D. Effect of Chemical Exchange on Transverse Relaxation Rate of Nuclei in Solution Containing Paramagnetic-Ions. J Magn Reson. 1974;15(3):540–548. [Google Scholar]
- 20.Bryant RG, Eads TM. Solvent Peak Suppression in High-Resolution Nmr. J Magn Reson. 1985;64(2):312–315. [Google Scholar]
- 21.Rabenstein DL, Fan S, Nakashima TT. Attenuation of the Water Resonance in Fourier-Transform H-1-Nmr Spectra of Aqueous-Solutions by Spin Spin Relaxation. J Magn Reson. 1985;64(3):541–546. [Google Scholar]
- 22.Eads TM, Kennedy SD, Bryant RG. Solvent Suppression in High-Resolution Proton Nuclear-Magnetic-Resonance Based on Control of Transverse Relaxation Rate. Anal Chem. 1986;58(8):1752–1756. doi: 10.1021/ac00121a034. [DOI] [PubMed] [Google Scholar]
- 23.Rabenstein DL, Fan S. Proton Nuclear-Magnetic-Resonance Spectroscopy of Aqueous-Solutions - Complete Elimination of the Water Resonance by Spin Spin Relaxation. Anal Chem. 1986;58(14):3178–3184. doi: 10.1021/ac00127a057. [DOI] [PubMed] [Google Scholar]
- 24.Connor S, Nicholson JK, Everett JR. Chemical-Exchange and Paramagnetic-T2 Relaxation Agents for Water Suppression in Spin-Echo Proton Nuclear-Magnetic-Resonance Spectroscopy of Biological-Fluids. Anal Chem. 1987;59(24):2885–2891. doi: 10.1021/ac00151a011. [DOI] [PubMed] [Google Scholar]
- 25.Aime S, Nano R, Grandi M. A New Class of Contrast Agents for Magnetic-Resonance Imaging Based on Selective Reduction of Water-T2 by Chemical-Exchange. Invest Radiol. 1988;23:S267–S270. doi: 10.1097/00004424-198809001-00058. [DOI] [PubMed] [Google Scholar]
- 26.Aime S, Calabi L, Biondi L, De Miranda M, Ghelli S, Paleari L, Rebaudengo C, Terreno E. Iopamidol: Exploring the potential use of a well-established X-ray contrast agent for MRI. Magnet Reson Med. 2005;53(4):830–834. doi: 10.1002/mrm.20441. [DOI] [PubMed] [Google Scholar]
- 27.Soesbe TC, Wu Y, Hao G, Sun X, Sherry AD. In vivo MR and PET imaging of a highly sensitive polymeric PARACEST contrast agent. ISMRM Annual Meeting; Honolulu, HI. 2009. [Google Scholar]
- 28.Jones CK, Li AX, Suchy M, Hudson RHE, Menon RS, Bartha R. In Vivo Detection of PARACEST Agents With Relaxation Correction. Magnet Reson Med. 2010;63(5):1184–1192. doi: 10.1002/mrm.22340. [DOI] [PMC free article] [PubMed] [Google Scholar]
- 29.Vinogradov E, Zhang SR, Lubag A, Balschi JA, Sherry AD, Lenkinski RE. On-resonance low B-1 pulses for imaging of the effects of PARACEST agents. J Magn Reson. 2005;176(1):54–63. doi: 10.1016/j.jmr.2005.05.016. [DOI] [PubMed] [Google Scholar]
- 30.Dadok J, Sprecher RF. Correlation Nmr-Spectroscopy. J Magn Reson. 1974;13(2):243–248. [Google Scholar]
- 31.Gupta RK, Ferretti JA, Becker ED. Rapid Scan Fourier-Transform Nmr-Spectroscopy. J Magn Reson. 1974;13(3):275–290. [Google Scholar]
- 32.Idiyatullin D, Corum C, Park JY, Garwood M. Fast and quiet MRI using a swept radiofrequency. J Magn Reson. 2006;181(2):342–349. doi: 10.1016/j.jmr.2006.05.014. [DOI] [PubMed] [Google Scholar]
- 33.Ellermann J, Idiyatullin D, Corum C, Moeller S, Ling W, Garwood M. The ultrasctucture of bone using selective saturation in SWIFT at 9.4 T. ISMRM Annual Meeting; Honolulu, HI. 2009. [Google Scholar]
- 34.Liu G, Ali MM, Yoo B, Griswold MA, Tkach JA, Pagel MD. PARACEST MRI with improved temporal resolution. Magn Reson Med. 2009;61(2):399–408. doi: 10.1002/mrm.21863. [DOI] [PMC free article] [PubMed] [Google Scholar]
- 35.Wolff SD, Balaban RS. Magnetization Transfer Contrast (Mtc) and Tissue Water Proton Relaxation Invivo. Magnet Reson Med. 1989;10(1):135–144. doi: 10.1002/mrm.1910100113. [DOI] [PubMed] [Google Scholar]
- 36.Soesbe TC, Rijas-Quijano FA, Sherry AD. A Terbium-based PARACEST MR contrast agent for in vivo imaging beyond the MT effect. ISMRM Annual Meeting; Stockholm, Sweeden. 2010. [Google Scholar]
- 37.Wu Y, Zhou Y, Ouari O, Woods M, Zhao P, Soesbe TC, Kiefer GE, Sherry AD. Polymeric PARACEST agents for enhancing MRI contrast sensitivity. J Am Chem Soc. 2008;130(42):13854–13855. doi: 10.1021/ja805775u. [DOI] [PMC free article] [PubMed] [Google Scholar]