

Abstract
This study investigated the requirements for restoring motor function after corticospinal (CS) system damage during early postnatal development. Activity-dependent competition between the CS tracts (CSTs) of the two hemispheres is imperative for normal development. Blocking primary motor cortex (M1) activity unilaterally during a critical period [postnatal week 5 (PW5) to PW7] produces permanent contralateral motor skill impairments, loss of M1 motor map, aberrant CS terminations, and decreases in CST presynaptic sites and spinal cholinergic interneuron numbers. To repair these motor systems impairments and restore function, we manipulated motor experience in three groups of cats after this CST injury produced by inactivation. One group wore a jacket restraining the limb ipsilateral to inactivation, forcing use of the contralateral, impaired limb, for the month after M1 inactivation (PW8–PW13; “restraint alone”). A second group wore the restraint during PW8–PW13 and was also trained for 1 h/d in a reaching task with the contralateral forelimb (“early training”). To test the efficacy of intervention during adolescence, a third group wore the restraint and received reach training during PW20–PW24 (“delayed training”). Early training restored CST connections and the M1 motor map, increased cholinergic spinal interneurons numbers on the contralateral, relative to ipsilateral, side, and abrogated limb control impairments. Delayed training restored CST connectivity and the M1 motor map but not contralateral spinal cholinergic cell counts or motor performance. Restraint alone only restored CST connectivity. Our findings stress the need to reestablish the integrated functions of the CS system at multiple hierarchical levels in restoring skilled motor function after developmental injury.
Introduction
The corticospinal (CS) system integrates motor systems information to regulate spinal motor circuits for skilled limb control (Lemon, 2008). CS system damage typically produces debilitating weakness or paralysis and, especially during development, maladaptive control (Volpe, 2009). How can we leverage knowledge of normal CST development to restore motor function after early postnatal injury? Two key determinants for establishing CST connections between motor cortex (M1) and spinal cord are CS system activity (Martin and Lee, 1999; Friel and Martin, 2007) and early motor experiences (Martin et al., 2004). By manipulating CST activity, we demonstrated the importance of activity-dependent competition between the developing CSTs from each hemisphere. Asymmetric levels of activity on the two sides during an early critical period leads to aberrant bilateral development of CST spinal terminations (Martin et al., 2009). This results in reduced efficacy of M1-to-contralateral spinal motor circuitry (Chakrabarty et al., 2009a; Chakrabarty and Martin, 2010) and skilled motor impairments (Friel et al., 2007). These circuit impairments are similar to those in hemiplegic cerebral palsy, a developmental motor disorder affecting 1–3 in 1000 births (Himmelmann et al., 2005).
The circuit and skill impairments produced by perinatal activity imbalance are permanent if left untreated. However, manipulating CS system activity after CST developmental impairment, by M1 inactivation or CST electrical stimulation, repairs aberrant CST spinal circuitry and abrogates movement errors (Friel and Martin, 2007; Salimi et al., 2008). The repair mechanism is activity-dependent competition. Electrical stimulation of the impaired CST gives it a competitive advantage to secure more connections. Inactivation of the unimpaired CST removes its competitive advantage.
The goal of this study was to harness activity-dependent competition to repair CST circuitry and restore function by altering behavioral experiences. We manipulated competition behaviorally at two treatment levels. By using constraint of the ipsilateral limb, we intended to reduce the competitive advantage of that limb and its associated control circuitry and to provide a competitive advantage to the impaired contralateral limb and its control circuits. By combined contralateral limb constraint plus impaired limb reach training, we augment the competitive advantage to the behaviorally impaired limb. We chose these two levels to help inform therapies for humans with developmental motor impairments, because many patients with developmental motor disorders can receive limb restraint but are too impaired to engage in skilled training. We applied these manipulations immediately after establishment of aberrant CST circuitry after M1 inactivation [8 postnatal weeks (PW) of age] and during adolescence (older than PW20). We examined performance of all animals in a visually guided locomotor task dependent on CST control and, in trained animals, reach accuracy. CST outcomes were spinal axon termination pattern, varicosities, and M1 representation. We also studied choline acetyltransferase (ChAT) expression in spinal interneurons, which we showed is under activity-dependent CST developmental regulation (Chakrabarty et al., 2009a).
Our findings stress the need to reestablish a normal CST spinal termination pattern and M1 motor map and to increase cholinergic spinal interneuron numbers on the contralateral, relative to ipsilateral, side to restore skilled motor function after developmental injury. This was only achieved by combined constraint of the unaffected limb and early training of the affected limb.
Materials and Methods
All experimental procedures were approved by and conducted in accordance with the Institutional Animal Care and Use Committees of Columbia University, the New York State Psychiatric Institute, and The City College of the City University of New York. Cats were purchased from an Association for Assessment and Accreditation of Laboratory Animal Care-accredited supplier. Kittens of either sex were delivered in litters of four to five, with a lactating mother, at PW4.
General surgical procedures.
For all surgical procedures, animals were given atropine (0.04 mg/kg, i.m.) to reduce oral secretions. Animals were anesthetized with a mixture of acepromazine (0.03 mg/kg, i.m.) and ketamine hydrochloride (30 mg/kg, i.m.). For osmotic minipump insertion and tracer injection procedures, animals were maintained in an areflexive state with 1–2% isoflurane. For intracortical microstimulation, anesthesia was maintained with ketamine hydrochloride as needed, typically 10 mg · kg−1 · h−1 intravenously.
Animals were given a broad-spectrum antibiotic (Cephazoline; 25 mg · kg−1 · d−1, i.m.) before surgery, immediately after surgery, and twice daily for 2 d after surgery. Likewise, an analgesic (Burprenorphine; 0.03 mg · kg−1 · d−1, i.m.) was given immediately after surgery and twice daily for 2 d after surgery. Animals were kept in a warming incubator until they recovered from anesthesia. Kittens were then returned to their home cage, with their mother and littermates. Cats typically resumed nursing within 4–6 h after surgery and were given supplemental milk (KMR feline milk replacement) as needed to ensure adequate weight gain.
M1 activity blockade.
To block M1 neural activity, the GABAA agonist muscimol (10 mm in sterile saline; Sigma) was continuously infused using an osmotic minipump (Alzet model 2002) (0.5 μl/h) into the center of the left M1 forelimb representation, located primarily in the lateral sigmoid gyrus (Chakrabarty and Martin, 2000), as in our previous studies (Martin et al., 1999; Friel and Martin, 2005; Friel et al., 2007). A 28 gauge hypodermic needle cannula (Alzet), beveled at the tip, was connected with vinyl tubing (size 4; Scientific Commodities) to the pump. The cannula was inserted 1.5 mm below the pial surface, to the approximate location of pyramidal cell bodies. The cannula was fixed to the skull with screws and dental acrylic cement. Neuronal activity was blocked in left M1 from PW5 to PW7. The osmotic pump delivered muscimol for 2 weeks.
We have shown using the metabolic marker cytochrome oxidase that this infusion maximally inhibits a 2.5–3 mm patch of cortex at the infusion site and less inhibition for an additional 4–5 mm (Martin et al., 1999). This inactivation also produces a reduction in the level of neuropil immunostaining of the calcium binding protein parvalbumin over approximately the same distance as observed for the cytochrome oxidase reduction (Friel et al., 2007) (for the location of maximal activity marker reductions in relation to the M1 motor representations, see Fig. 7A). In previous studies, we verified that the infusion did not produce a lesion by comparing, within the infused and non-infused cortex, cell body density, the distribution of neurofilament-F (SMI-32) immunoreactivity, and parvalbumin cell body staining (Martin et al., 1999; Friel et al., 2007).
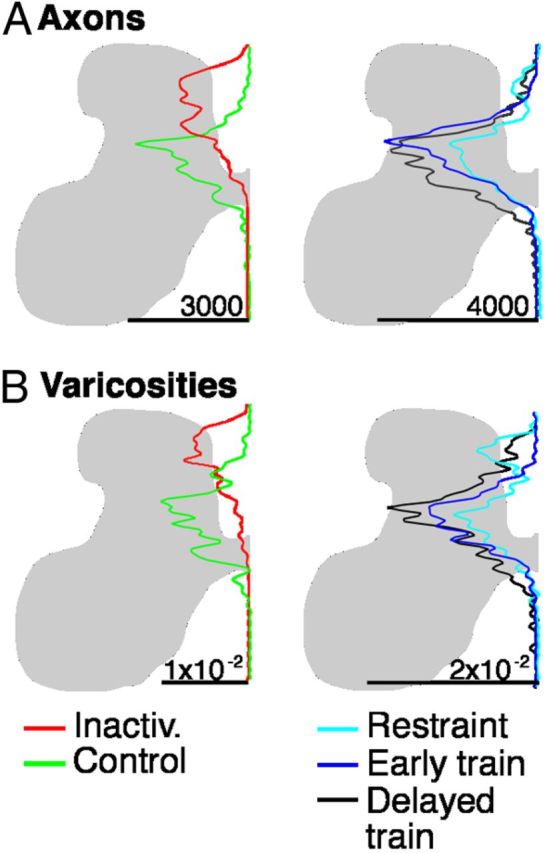
Figure 7.

CST labeling of axons that originate in the right (contralateral to inactivation) M1 and terminate ipsilaterally, in the right side of the spinal cord. A–C, Density maps of the distribution of axon terminations (top) and CST axon varicosities (bottom) in the lower cervical spinal cord. There were no group differences in the amount of ipsilateral terminations or the density of synaptic boutons on these terminations. The upper row (A1-C1) presents data for CST axons; the lower row (A2-C2), for CST axon varicosities.
Post-inactivation treatments.
The osmotic minipumps that delivered muscimol were removed at the end of PW7. The goal of this study was to determine the effects of different post-inactivation treatments on CS system anatomy, physiology, and function. After M1 inactivation, animals were assigned to one of three treatment groups: (1) restraint of unimpaired forelimb limb and training of impaired forelimb in the month immediately after the M1 inactivation (PW8–PW13) (“early training”); (2) restraint of unimpaired forelimb limb in the month immediately after the M1 inactivation (PW8–PW13) (“restraint only”); and (3) restraint of unimpaired forelimb limb and training of impaired forelimb 3 months after the M1 inactivation (PW20–PW24) (“delayed training”).
Jacket restraint.
Animals wore a soft mesh jacket to prevent use of the limb ipsilateral to inactivation (left). The jacket fit over the animal's head and fit snugly around the torso of the animal. The jacket had a mesh sleeve that was fitted over the animal's left forelimb (ipsilateral to the M1 inactivation). The distal end of the sleeve was secured to the torso of the jacket, thereby preventing any purposeful movements. The jacket had a hole near the animal's right shoulder through which the animal's right forelimb was placed. Thus, when the animal was wearing the jacket, it had unrestrained use of the forelimb contralateral to M1 inactivation and was not able to use the arm ipsilateral to M1 inactivation. Animals walked on three limbs. Within 1 d, animals exhibited acclimation to the jacket, ably mobilizing to eat, drink, and move about the cage. All animals wore a jacket for the prescribed period, which was 23 h/d for 4 weeks. The jacket was removed for 1 h each day. For animals in the trained groups, they performed a reach task during most of this period; the rest of the time was spent in the cage. For the restraint-only group, they were free to walk about in their cage during this hour. Performance on the horizontal ladder-walking task was tested two times each week during the treatment period, during the 1 h when the cats were not wearing the restraint.
Forelimb reaching task.
The animals in the early (PW8–PW13) and delayed (PW20–PW24) training groups were trained in a forelimb reaching task. Animals were not provided food in their home cage on the days of training. For the reaching task, animals were placed in a 36 × 36 × 50 cm box. Five sides of the box were made of mesh plastic; one side was open. A metal grid was affixed to the box so that the grid blocked the open side of the box from 10 cm above the box floor to the top of the box. This left a 10 cm opening between the metal grid and the box floor. A flat surface (“reaching surface”) was placed on a 5-cm-high platform outside the box and placed up against the opening in the box under the metal grid.
During training, cats were placed in the box. Before cats were placed in the box, the jacket was removed so the animal could use all four limbs for postural support. The reaching surface was placed up against the opening in the box under the metal grid. A 5 mm cube of food (beef or tuna) was placed on the reaching surface ∼13 cm from the metal grid. The clearance between the reaching platform and the bottom edge of the metal grid was sufficient for the cats to reach to the platform and retrieve the meat. Cats would retrieve the food cubes, one by one. After the cat retrieved one cube, the experimenter would place another cube on the reaching platform.
Cats were trained to reach with the contralateral, impaired forelimb (right; contralateral to the M1 inactivation). They were discouraged from reaching with their ipsilateral unimpaired limb by quickly removing the food as they began their reach, so they did not receive positive reinforcement. Cats were not exposed to the reaching task before or during the cortical inactivation, because even normally developing cats younger than 7 weeks of age are not capable of performing the task. Typically, early in training, cats would initiate each reach with their unimpaired (left) forelimb. If so, the experimenter would remove the food cube or block the path between the unimpaired forelimb and the food. Early in training, all attempted reaches with the impaired forelimb were rewarded by the experimenter placing the meat close to the cat's mouth. Within one to three sessions, cats learned that reaching with the impaired forelimb was necessary for reward and would successfully retrieve the meat with its impaired forelimb. Cats were trained for 30 min, two times per day, 5 d/week, for 4 weeks. All cats made ∼4000 total reaches during training (average ± SE, 3866 ± 105).
Horizontal ladder-walking task.
We examined animals' performance while walking on a horizontal ladder (88 cm long × 18.4 cm wide; 0.9 cm square rungs; 6 cm rung interval) (Friel et al., 2007). All animals in all treatment groups were tested on the ladder-walking task 2 d/week during the period of intervention (PW8–PW13 or PW20–PW24). Animals were not tested before or during the period of cortical inactivation because cats younger than 7 weeks of age are not capable of performing the task. Ladder walking was tested twice a week, on 2 consecutive days. Rung spacing was 6 cm. Cats were placed on a platform at one end of the ladder, and meat cubes were placed at the other end. Testing was videotaped. During testing, the cat walked across the ladder from the start platform to the food reward. After the cat traversed the ladder in one direction, the food reward for the next trial was placed on the other end of the ladder, requiring the cat to traverse the ladder in both directions. This ensured that both sides of the cat were captured on film. To prevent cats from memorizing rung position, we placed them at different positions on the platform for each trial, while keeping the distance between rungs constant. This resulted in their starting to step on the rungs with either forelimb. Moreover, the first ladder rung that was stepped on differed from trial-to-trial. We showed previously that control animals adjusted their step distance in accurate proportion to surprise changes in rung distance (Friel et al., 2007).
In each testing session, cats completed 20 passes across the ladder. In each pass, cats made an average of four steps, providing ∼80 steps per session for analysis. Testing took ∼10 min per session. For the restraint-only group, ladder testing was performed during the 1 h when the cat's jacket had been removed. For the reach training groups, ladder testing was done immediately after reach training, before the jacket was placed back on the animal. We showed previously that this testing frequency provided sufficient trials for analysis and did not result in a training effect. When animals were tested on the ladder-walking task for up to 4 months using this schedule, in the absence of any intervention, stepping accuracy did not improve; stepping errors were not significantly different at the end of testing compared with initial testing (Friel et al., 2007).
Analysis of reaching.
Videotapes of training sessions were imported into a video editing program (iMovie; for the Apple Macintosh computer). A 1 cm2 grid was superimposed on the video, using the software program Afloat. This made both the video and the grid simultaneously visible. The grid was aligned to the video so that the meat cube was in the center of the grid. For each reach, the video was paused each time the cat's paw touched the reaching platform. The grid square in which the paw tip (tip of D3) had landed was tallied. Two reaching sessions per week were analyzed.
After reach endpoint positions were tallied, percentage reaches landing in each grid square were calculated for each session. Percentages were imported into MATLAB (MathWorks) and converted to density maps, with blue representing lowest values and red representing highest values.
Analysis of ladder step movements.
Videotapes of testing sessions were imported into a video editing program (iMovie; for the Apple Macintosh computer). Images from the video files were analyzed at 30 Hz, pausing at the frame in which the paw made contact with the rung. We measured the distance that the tip of the cat's forepaw extended in front of the rung of the ladder (termed forward distance). The forward distance was measured on a flat computer screen. Distance measures from the computer screen were converted to centimeters by scaling according to a calibrated distance on each video file. We compiled a database of mean forward distance of animals after alternate inactivation. These data were compared with control data from a previous study (Friel et al., 2007): (1) age-matched non-inactivated animals; (2) M1 saline infusion; and (3) unilateral inactivation.
Tracer injections.
Biotinylated dextran amine (BDA; 5% in PBS; Invitrogen) and Lucifer yellow dextran (LY; 1% in PBS; Invitrogen) were pressure injected into M1 4 weeks before killing the animal. These anatomical tracers were used to examine the CS projection from neurons in the forelimb areas of each hemisphere. Injections were made ≥2 d after cessation of muscimol infusion. Previous experiments indicated that tracer injected at the time of an intracortical infusion failed to label CS terminals.
All injections were made under visual guidance within a band of cortex just lateral to the tip of the cruciate sulcus, as in our previous studies (Li and Martin, 2001; Friel and Martin, 2005). These injections were all within M1. Three injections of BDA, 300 nl each, were made in the left M1 of each cat, whereas three 300 nl injections of LY were injected into the right M1 of each cat. Injections were made 1.5 mm below the pial surface. Injections were separated by 1.5 mm and placed rostral, lateral, and posterior to the former cannula implantation site, which was just lateral to the tip of the cruciate sulcus. We ensured that differences in the distribution of CS axons in the spinal cord were not attributable to differences in the locations of injections sites. In all animal groups, the locations of injection sites, relative to the cruciate sulcus, were identical.
Histology and tracer histochemistry.
Four weeks after tracer injection, cats were deeply anesthetized with sodium pentobarbital (30 mg/kg, i.v.) and perfused transcardially with warm saline, followed by a solution of 4% paraformaldehyde, pH 7.4. Heparin was injected (200–500 U, i.v.) at the onset of perfusion. For perfusion, a peristaltic pump was used at a predetermined flow rate that depended on the animal's weight. The total perfusion time was 20–30 min. The brain and spinal cord were removed, postfixed in the same fixative at 4°C for 2–3 h, and then transferred to 20% sucrose in 0.1 m phosphate buffer overnight. Frozen transverse sections (40 μm) through the cervical spinal cord (C7–C8) were cut and processed for BDA histochemistry and LY immunohistochemistry to visualize the distribution of labeled CS terminals. Parasagittal sections through the cortex were cut, and alternate sections were processed for BDA or LY to determine the location of tracer injection sites. Parasagittal cortical sections were also Nissl stained for assessing cortical cytoarchitecture. In our extensive previous experience with BDA after M1 inactivation, we have found that 4 weeks is sufficient transport time in mature animals (Li and Martin, 2001; Friel et al., 2007).
For visualization of BDA, sections were incubated in PBS containing 1% avidin–biotin complex reagent (ABC kit; Vector Laboratories) and 0.2% Triton X-100 for 2 h at room temperature. After rinsing, sections were incubated with the chromogen diaminobenzidine (DAB; Sigma) for 6–30 min. After rinsing, sections were mounted on gelatin-coated slides, air dried overnight, dehydrated, and coverslipped. For visualization of LY, sections were incubated at 4°C overnight in PBS containing 0.01% rabbit anti-LY antibody (Invitrogen) in blocking buffer (3% goat serum in 1× PBS with 0.2% Tween 20, pH 7.4). After rinsing, sections were incubated for 2 h at room temperature in blocking buffer containing 0.2% anti-rabbit antibody conjugated to peroxidase, pH 7.4. After rinsing, sections were incubated with the chromogen DAB for 5–30 min. Sections were mounted on gelatin-coated slides, air dried overnight, dehydrated, and coverslipped.
To mark putative synapses between CST axons and spinal neurons, we triple labeled spinal sections for BDA, the presynaptic marker synaptophysin (SYN), and the postsynaptic marker postsynaptic density-95 (PSD-95). Nonspecific binding was blocked in sliced tissue with 3% donkey serum for 1 h at room temperature. To visualize BDA, sections were incubated with conjugated ExtrAvidin Cy3 (1:500 to 1:800; Sigma). For visualization of PSD-95, tissue was incubated with the primary antibody (1:500 polyclonal rabbit anti-PSD-95; Invitrogen) for 4 h at room temperature, washed with PBS, and incubated in the secondary antibody for 1 h at room temperature (1:500 goat anti-mouse IgG conjugated to FITC; Jackson ImmunoResearch). For visualization of SYN, tissue was then incubated with the primary antibody (1:1000 monoclonal mouse anti-SYN; Millipore Bioscience Research Reagents) overnight at 4°C. Sections were washed and incubated with the secondary antibody and incubated for 1 h at room temperature (1:500 ExtrAvidin Cy5; Sigma). Sections were washed, mounted on gelatin-coated slides, air dried, and coverslipped with Vectashield (Vector Laboratories).
For visualization of ChAT, we used a goat polyclonal anti-ChAT primary antibody (AB144P; Millipore; SwissProt number P28329; 748 aa; single band on Western blot, 68–70 kDa), as in our previous study (Chakrabarty et al., 2009a). Sections (40 μm) were incubated overnight at a 1:100 concentration at 4°C. After rinsing, sections were incubated with the chromogen DAB for 5–30 min. Sections were mounted on gelatin-coated slides, air dried overnight, dehydrated, and coverslipped.
Quantitative analysis of the topography of CS terminations.
We previously developed a quantitative method for determining the topographic distribution of label within the gray matter in the cervical enlargement (Friel and Martin, 2007; Salimi et al., 2008). Briefly, contralateral BDA-labeled axons within the gray matter were traced from transverse spinal sections at 200× magnification using Neurolucida (MicroBrightField), by moving the cursor along the length of the labeled axon. Boutons were defined as punctate axonal swellings (i.e., varicosities) with a diameter of ≥3 than the diameter of the adjoining nonvaricose axon. Bouton sites along axons were marked.
Tracings of axon label and boutons were separately exported and quantified using a suite of programs written in MATLAB (MathWorks). The gray matter was divided into 40 × 40 μm square regions of interest (ROIs). For each ROI, the mean density of traced axons or marked boutons was determined. A matrix of mean axon or bouton density was generated in MATLAB that preserved the mediolateral and dorsoventral dimensions of the distribution of label in the gray matter.
We quantified the regional axon and bouton density to generate maps of regional distribution of axonal label distribution and to quantify the amounts of label in different spinal laminae. Density is represented according to a color scale, from the lowest density (blue) to the highest (red). Red represents an axon density of 135 μm/mm2 and a bouton density of 3.5 boutons/mm2. Regional distribution maps were generated for individual animals and averaged for all animals within a particular treatment group. For group averages, we aligned the data from different animals according to the point of intersection between the gray matter above the central canal and the dorsal median septum.
To compare the locations of label across animals, we transformed the regional distribution maps (i.e., dorsoventral and mediolateral) to dorsoventral distributions only. This was done by summing all label present at a single depth. Because the size of the gray matter differs from animal to animal, we normalized dorsoventral distributions of labeling. For this analysis, we marked the dorsal and ventral gray matter borders and interpolated 100 rows between.
Quantitative analysis of ChAT distribution.
We used a stereologic method to assess the amount and distribution of ChAT-positive cells. ChAT-positive cells were marked in five randomly selected section image files of DAB-labeled ChAT cells using Stereoinvestigator (MicroBrightField) at 200×. A grid size of 150 μm and frame size of 200 μm were used. The gray matter borders and borders between dorsal, intermediate, and ventral laminae were drawn at 100×. Counting windows were randomly distributed among all laminae. Markers were placed in the center of the nucleus of the cell. Files containing markers were exported and quantified using a suite of programs in MATLAB.
We quantified the regional density of ChAT-positive cells to generate maps that show the regional distribution of label in different spinal laminae. Density is represented according to a color scale, from the lowest density (blue) to the highest (red). Regional distribution maps were generated for individual animals and averaged for all animals within a particular treatment group.
Statistical analyses.
Statistical analyses were done in Microsoft Excel and MATLAB (MathWorks). For comparisons of group means, the Student's t test or ANOVA was performed. ANOVAs were followed by Bonferroni's-corrected post hoc comparisons. For comparisons of distributions, χ2 tests were performed. Error bars in all figures represent SEM.
For the analysis of reaching endpoint, principal components analysis was done. x–y coordinates in space of endpoints for each animal by week were transformed into absolute coordinates in one coordinate system. Transformed coordinates were plotted, and best-fit ellipses were determined using MATLAB. Ellipse areas were calculated using MATLAB.
Results
All cats in this study were subjected to inactivation of the forelimb representation of left M1 between PW5 and PW7. The region inactivated encloses the forelimb motor representations (Friel et al., 2007). Within this region, transient reversible inactivation in the mature cat produces contralateral forelimb impairments (Martin and Ghez, 1993), demonstrating its importance in moment-to-moment limb control. Furthermore, the CST projection to the cervical spinal cord originates from this area in immature and mature cats (Martin, 1996; Li and Martin, 2001). Thus, we reversibly blocked activity of the M1 area responsible for CST control of the contralateral forelimb. Left untreated, this produces permanent forelimb control impairments (Martin et al., 2000), permanent M1 motor map defects (Chakrabarty et al., 2009b), and permanent reductions in neurotransmitter marker expression on the affected side of the spinal cord (Chakrabarty et al., 2009a). Beginning 1 week after cessation of inactivation, animals were assigned to one of three groups: (1) restraint only; (2) early training; or (3) delayed training. We present, in sequence, the effects of treatment on motor control (horizontal ladder walking; reaching), regional distribution of CST spinal terminations, ChAT interneurons, and M1 motor map.
Horizontal ladder walking
Starting at PW8, 1 week after cessation of M1 inactivation, cats were tested on a horizontal ladder-walking task. The task is quickly learned by the cats, typically requiring one to two sessions before the cats readily perform the task (Friel et al., 2007). Cats were tested two times per week during the intervention period. As we reported previously (Friel et al., 2007), this M1 inactivation produces impairments paw placements in this task. Animals overstep the ladder rungs with the contralateral limb; the ipsilateral limb performs as control cats. Overstepping resulted in limb instability, with the limb occasionally slipping off the ladder rung. In these circumstances, animals were able to correct and position their paw on the rung. Despite overstepping and occasional slips, animals walked across the ladder using a quadrupedal gait. Early during intervention, the distance the cat's impaired paw extended beyond the target ladder rung (termed forward distance) was significantly higher than the forward distance of historical age-matched controls (Friel et al., 2007) (t = 7.34, df = 11, p < 0.0001). There was no difference in the forward distance of the three treatment groups in week 1 of intervention; each was similarly impaired (F(2,10) = 0.21, p = 0.82).
Figure 1 compares scores between week 1 and week 4 of intervention, showing that forward distance decreased to normal for early training only. There was an overall effect of group on forward distance (F(2,10) = 4.33, p = 0.045). Forward distance of the early training group decreased significantly (t = 2.62, df = 3, p = 0.04) from week 1 to week 4, reaching normal levels by week 4. There was a significant difference in forward distance at week 4 among all groups (F(2,10) = 17.19, p < 0.0001). In contrast to the reduction in overstepping with early training, there was no change in forward distance from week 1 to week 4 for the restraint-alone (F(3,11) = 0.054, p = 0.97) or delayed training (F(3,7) = 0.08, p = 0.97) groups. These findings indicate that reach training combined with restraint is necessary to improve forepaw placement accuracy during visually guided stepping but only during an early period.
Figure 1.

Stepping on a horizontal ladder. The distance from the forward edge of the ladder rung and the tip of the cat's paw was measured (forward distance). All cats showed an overstep during the first week of intervention. By week 4, forward distance in the early training group had recovered to normal levels (p = 0.04). No improvement was found in the restraint-alone or delayed training groups.
Reaching
Cats were trained to reach for cubes of food with their affected forelimb for 60 min/d, 5 d/week, for 4 weeks. All cats in the early training and delayed training groups performed ∼4000 reaches over the period of intervention (mean ± SD, 3878 ± 273). Figure 2A shows drawings of the video frame in which the cat first contacted the surface for a typical reach during week 1 (left) and week 4 (right) from the early training group. Cats reached for the cube of food in the center of the field (black dot). Early in training (week 1), reaching accuracy was poor, with cats reaching beyond the cube of meat. As we described previously (Martin et al., 2000), when the animal's paw contacted the meat, grasping was not performed; rather, the arm was swept around the food and the meat was raked toward their mouth. This strategy was effective in retrieving the food. By the end of training (week 4), reaching accuracy was substantially improved in the early training group, with cats directing their affected forelimb to the meat without overreaching.
Figure 2.
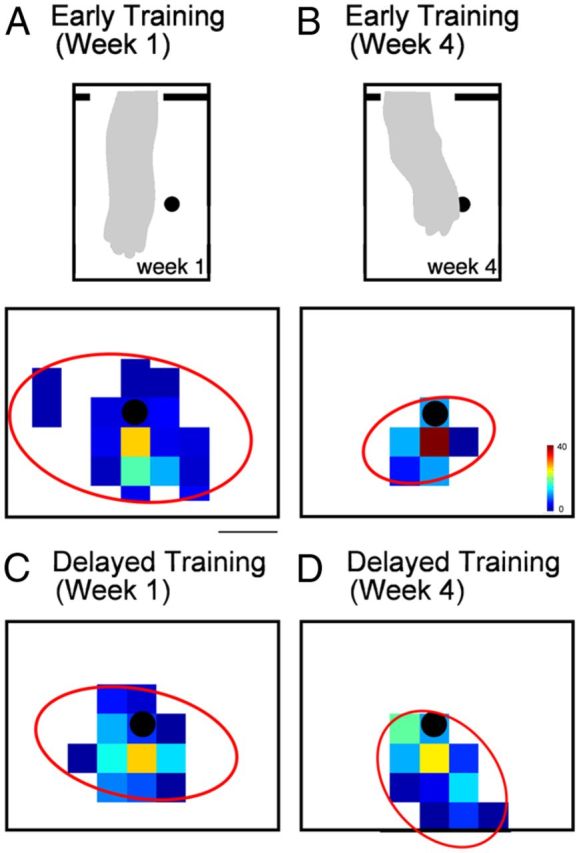
Reaching to a target. Cats in the early and delayed training groups were trained five times per week, 1 h/d for 4 weeks. A–D, Density maps of reach endpoint positions. The black dot in the center of each density map indicates the position of the food target. Scale bar, 2 cm. Both the early (A) and delayed (C) training groups showed a dispersion of reaching endpoints in the first week of training. By week 4, reaching accuracy of the early training (B) group had significantly improved, indicated by a narrower distribution of reaching endpoints near the target. Insets in A and B show a drawing from a still-frame video image of the position of the arm at point of first contact. Note greater over-reaching in A than B. Accuracy in the delayed training group (D) did not improve by week 4. In A–D, the red ellipses indicate the distribution of reaches, as determined by principal components analysis.
Figure 2, C and D, shows color-coded distributions of reach endpoints during week 1 and week 4, from all cats in the early training group. To further describe this dispersion, we used principle components analysis to compute the size of the ellipse that enclosed 90% of endpoints. The x–y coordinates of reaching endpoints were transformed to a normalized coordinate frame. An ellipse best fitting the dispersion of the endpoints for all cats in each group was fitted to the data (red ellipses). During week 1, endpoints showed a wide distribution, most often overshooting the target. During week 4, endpoints were more focused around the target. After early training (week 4), there were significantly more reaches within 1 cm of the target than early (week 1) (t = 8.64, df = 3, p = 0.003). In contract, delayed training did not improve reaching accuracy. Figure 2, C and D, shows reach endpoint distributions during week 1 and week 4 from all cats in the delayed training group. During week 1, endpoints showed a wide distribution, and the distribution did not change by week 4 of intervention. The percentage of reaches within 1 cm of the target did not change (t = 0.3, df = 2, p = 0.78). The apparent tighter distribution of endpoints in the delayed training group at week 1 compared with the early training group could reflect better skills in older kittens. However, there was no significant difference in the percentage of reaches within 1 cm of the target during week 1 between the early and delayed training groups (t = 2.62, df = 2, p = 0.12). These findings show that reach training combined with restraint only during an early postnatal period improves reach endpoint accuracy. This finding is similar to visually guided stepping.
Redistribution of CST connections
To help inform the repair mechanism underlying abrogation of stepping and reaching impairments, we examined four features of motor systems organization that animals studies, including our own using the cat inactivation cat model, have shown to be essential for normal forelimb motor skill: (1) CST axon terminal distribution in the contralateral cervical enlargement; (2) distribution and density of CST presynaptic sites; (3) segmental motor circuits, assayed using ChAT immunostaining; and (4) the M1 motor map. In addition, we examined the effects of the different treatments on the density of ipsilateral CST terminations, which we have shown previously is permanently increased after unilateral M1 inactivate between PW5 and PW7 (Martin et al., 1999).
Figure 3A–C shows color-coded density maps of the distribution of terminations (top row) of axons originating in the M1 that had been inactivated during PW5–PW7 and that terminate in the contralateral spinal cord. Density plots are shown for the three animal groups, and D shows control and inactivation-only distributions for comparison (replotted from Friel and Martin, 2007). Beginning with D, the normal distribution of CST terminations (D1) in the cervical enlargement are shown as the green region. These correspond to the areas enclosing 60% of the labeling (Friel and Martin, 2007). Labeling is mostly within the intermediate zone (i.e., Rexed's laminae VI–VII). In contrast, after unilateral M1 inactivation between PW5 and PW7, there is a dorsal shift, which is permanent unless treated further (Friel and Martin, 2007). Thus, without intervention, CST terminations are restricted to the upper part of the dorsal horn (red distribution). The goal of treatment is to return labeling to the green region. The color density maps (A–C, top rows) use red to indicate a higher axon density, whereas blue indicates lower axon density. Although there are subtle differences in local CST axon density, remarkably there are no systematic difference between groups. All label is centered within the deep dorsal horn and intermediate zone. Importantly, the densest labeling is within the normal distribution, as defined by the green field in D.
Figure 3.

A–C, Density maps of the distribution of axon terminations and synaptic boutons in the lower cervical spinal cord contralateral to the inactivated M1. Axons were traced from the inactivated M1. In all treatment groups, axon terminals and boutons were located in the lower part of the dorsal horn and the intermediate zone contralateral to the inactivated M1, their normal targets. D, Overlays of the distribution areas for untreated animals: inactivation alone, without intervention; control, no inactivation (from Friel and Martin, 2007). Although inactivation alone shifted axons and varicosities to the upper dorsal horn, all three interventions redirected axons and varicosities to the same region as controls. The upper row (A1-D1) presents data for CST axons; the lower row (A2-D2), for CST axon varicosities.
Figure 4A (left) plots the mean axon density value from the dorsal to ventral gray matter surfaces for controls (green) and inactivated-only (red) animals, replotted from Friel and Martin (2007). These plots quantify the distribution of axon terminations from the inactivated M1 to the contralateral spinal cord. The dorsal shift after inactivation can be seen. Data from the three treatment groups are plotted on the right. The three are overlapping, and each shows maximal labeling within the deep dorsal horn and intermediate zone, just like the normal pattern (Fig. 4A, green).
Figure 4.
Dorsoventral distribution of CST axon within the gray matter of the lower cervical spinal cord contralateral to the inactivated M1 (A) and CST axon varicosities (B). Line graphs plot density on a left to right scale.
To assay putative CST synaptic density, we examined axon varicosities. As in our previous studies, we quantified the distribution and density of axon varicosities, defined as three times the diameter of adjoining nonvaricose segments (based on DAB labeling). These CST axon varicosities colabel the presynaptic vesicle protein SYN (Meng et al., 2004). Importantly, they appose sites of PSD-95. Figure 5 shows two representative examples that CST axon varicosities mark putative synapses, based on presynaptic and postsynaptic immunostaining of SYN and PSD-95, respectively. The top two rows show a varicosity in a control animal. A is a low-magnification projection image (i.e., z-stack; 10 optical slices) of BDA (green), PSD-95 (red), and SYN (blue) labeling in the intermediate zone. Note that the red–green colocalization is colored yellow, blue–green is cyan, and red–blue is magenta. A1–A3 and A4–A6 are two adjacent optical slices that are part of the total z-stack. The slice in A1, which shows the varicosity morphology well, also colocalizes a large puncta of PSD-95 (yellow arrow). Although PSD is ubiquitous, there is colocalization within part of the varicosity. At this depth in the tissue, there is minimal SYN label (gray arrow). The slice in A2 grazes the varicosity and better shows a puncta of SYN colocalized to the varicosity than PSD-95. The insets in A1 and A4 are triple-label images of these single optical slices. Note the yellow (BDA–PSD) colocalization in the varicosity in A1 and cyan (BDA–PSD) colocalization in A4. B shows CST axons within five adjacent sections in the cervical enlargement of an early trained animal. The small red box is the location of axon in C (projection stacked image; 10 optical slices); this is at an axon branch point. The small yellow box in C is the focus of the single 1 μm optical slice in C1–C4. C1 shows colabeling of the CST axon, SYN, and PSD-95. Corresponding single-label images are shown (CST bouton alone, C2; SYN-labeled puncta, C3; PSD-95-labeled puncta, C4). As in A, there is colocalization of the presynaptic and postsynaptic proteins within the labeled CST axon. Thus, axon varicosities can be used to mark putative synapses between CST axons and spinal cord neurons.
Figure 5.

Confocal images of CST axon varicosity showing colocalization of BDA, PSD-95, and SYN. A, Axon terminal in the spinal intermediate zone from a control animal. A, Projection image (10 1-μm optical slices), triple labeled. A1–A3, One micrometer optical slice showing a BDA staining only (A1), PSD staining (A2), and SYN staining (A3). Yellow arrows point to labeling present; gray arrow point to the location in which optimal labeling for SYN (A3) and PSD (A5) is not present. A4–A6 are similar to A1–A3 but for the next optical slice. Insets in A1 and A4 show triple label for the single optical slices. B, Low-magnification view of location of CST label in the contralateral cervical spinal cord. Red box contains the axon used for analysis in C. C, Axon terminal in the spinal intermediate zone in a projection image; BDA staining only. The region outlined by the yellow square in C is shown in C1–C4, which are the same 1 μm optical slice but with different staining. The yellow arrow points to the same location in C1–C4. C1, Overlay of BDA, PSD-95, and SYN labels. C2, BDA only. C3, SYN only. The arrow points to a puncta of SYN. C4, PSD-95 only. The arrow points to a puncta of PSD-95. Scale bars, 10 μm.
Figure 3B shows the density and distribution of CST axon varicosities, marking putative synaptic sites (boutons). As with axon density, the normal distribution (green) is within the intermediate zone and, after M1 inactivation only, the upper dorsal horn. The three treatment groups all show return of CST varicosities within the intermediate zone. Figure 4B shows the dorsoventral distributions of CST varicosities. Again, the varicosities from each of the three treatment groups overlap and are located within the normal CST territory, the intermediate zone.
We confirmed these findings by quantifying the amounts of axonal label and boutons in the dorsal, intermediate, and ventral regions of the cervical enlargement for the three treatment groups. We plotted regional axon density by summing the amount of label in dorsal, intermediate, and ventral spinal laminae and calculating the percentage of the total label in each region (Fig. 6A). As in Figure 3, we compare these data from the different treatment groups with an inactivation/no-treatment and control/no-inactivation groups from a previous study (Friel and Martin, 2007). We compared the amounts of label in each region across the treatment groups. There was a significant effect of group on the distribution of axons (ANOVA, F(4,14) > 5.59, p < 0.007) and varicosities (F(4,11) > 6.59, p < 0.006) for dorsal and intermediate spinal regions. We next compared labeling in the treatment groups with that of control (no inactivation) and inactivation only (no treatment). The control and inactivation data were from a previous study (Friel and Martin, 2007). Mean percentage CST axons in control animals (no intervention) are represented by the dotted lines in Figure 6A; means for inactivation only (no intervention) are the dashed lines. Control and inactivation-only data are from a previous study (Friel and Martin, 2007). There was significantly more axon and varicosity label in the intermediate zone in all three treatment groups than inactivation/no-intervention animals (t > 3.36, p < 0.02) and significantly less label in the upper dorsal horn in all three treatment groups than inactivation/no-intervention animals (t > 3.81, p < 0.017). Importantly, the distribution of axon and varicosity label in the dorsal region (t < 0.80, p > 0.45) and intermediate regions (t < 0.60, p > 0.57) were not significantly different from control/no-inactivation animals. Sparse ventral horn labeling was also the same as controls. We then examined the density of putative synaptic boutons (i.e., CST axon varicosities; Fig. 6B). We measured varicosity density in the medial intermediate zone, which is the location of the highest density of CST terminations (box in Fig. 6, inset). Bouton density was not significantly different among the groups (F(2,8) = 0.98, p = 0.42). Thus, for both CST axons and putative CST synapses, each treatment group restored CST connections to the proper gray matter regions. Our findings indicate restitution of CST axon terminations within the normal intermediate zone territory for all three treatment groups.
Figure 6.

Quantification of axon label and synaptic bouton density. A, Percentage axon label in dorsal, intermediate, and ventral spinal regions. Dashed lines represent values from inactivation/no-intervention and control/no-inactivation groups. All three treatment groups resulted in axons distributions similar to control/no-inactivation animals, with the greatest amount of label residing in the intermediate spinal laminae. B, Density of synaptic boutons in axon terminals in the intermediate zone. There were no statistically significant differences among treatment groups.
Our previous studies in which CS system activity was directly manipulated with neural inactivation or electrical stimulation demonstrated yoked, reciprocal, bilateral changes: as contralateral CST connections prospered, ipsilateral connections receded. In the present study, we also identified the presence of aberrant ipsilateral CST terminations. As previous reports, they were located predominantly within the intermediate zone. For this analysis, we traced CST axons labeled with LY (restraint only, n = 3; early training, n = 4; delayed training, n = 3). Axons from the M1 contralateral to the inactivated M1 were traced. Axons typically terminated bilaterally in the lower cervical spinal cord. Here, we traced the ipsilateral terminations, that is, the axons that originate in the right M1 and terminate in the right side of the spinal cord. Figure 7 shows the distribution of ipsilateral CST labeling for the three animal groups. Whereas electrical stimulation and inactivation therapies result in consistent and significant reductions in aberrant ipsilateral CST terminations (Friel and Martin, 2007; Salimi et al., 2008), surprisingly we did not observe any consistent changes to ipsilateral CST terminations after the behavioral approaches in this study. Statistical analysis revealed no differences in the amount of ipsilateral axonal label (Kruskal–Wallis K = 0.64, p = 0.73) or varicosities (Kruskal–Wallis K = 1.80, p = 0.41) among the three groups.
Distribution of ChAT
Previously we showed that development of ChAT in spinal segmental interneurons was under activity-dependent regulation by the CST (Chakrabarty et al., 2009a). Here, we examined changes in the distribution of ChAT-positive interneurons produced by the three treatments. Figure 8A–C shows color density plots of ChAT-positive interneurons and motoneurons for the three groups. We quantified changes in the numbers of cells using stereological methods. We distinguished between putative motoneurons (i.e., large multipolar neurons in the motor pools) and ChAT-positive interneurons located elsewhere. Because we did not expect the treatments to influence motoneuron counts (Chakrabarty et al., 2009a), we used this measure to control for inter-animal/treatment immunohistochemical differences. We determined the ratio of the number of ChAT-positive neurons on the side contralateral to inactivation versus ipsilateral to inactivation (Fig. 8D). Previously, we found that inactivation of M1 on one side during PW5–PW7 resulted in a decrease in the ratio of ChAT-positive cells on the affected/contralateral sides (Chakrabarty et al., 2009a). In that study, the affected/contralateral ratio was 0.45. In the present study, we found that, within the dorsal and intermediate regions, which is the territory in which the CST terminates, early training not only increased the number of ChAT-positive cells to the level of the contralateral side but remarkably increased these numbers to 5.4 times the level of the contralateral side (Fig. 6). In the restraint-alone and delayed training groups, the levels of ChAT-positive cells also were elevated in the affected side relative to the contralateral side but to a much lesser extent (1.9 times). There were no differences in motoneurons on the two sides (Fig. 8D). The ratio of ChAT-positive cells on the affected to the contralateral sides was significantly higher in the early training group than the restraint-alone and delayed training groups (χ2 = 5.9, df = 2, p = 0.05). Although there were differences in the ratios of ChAT-positive cells among treatment groups, there were no significant differences in the number of ChAT-positive cells in dorsal/intermediate or ventral laminae (Kruskal–Wallis K < 1.83, p > 0.40). These findings show an unsuspected strong effect of early reach training on neurotransmitter phenotype.
Figure 8.

Distribution of ChAT-positive cells in the lower cervical spinal cord. A–C, Density maps of ChAT-positive cells in the cervical enlargement. The large dense clusters of cells in the ventral horn correspond predominantly to motoneurons. Note, the color scale is the same for all panels (red = 1.25 × 10⁻⁵ cells/square μm). Scale bar, 1 mm. D, Ratios of ChAT label on the affected (left side of spinal cord in figures) to the contralateral (right) sides of the spinal cord. Note that in the early training group, there was a much greater ratio of ChAT-positive cells in the intermediate zone (laminae I-VII) on the affected/trained side than the untrained side. The ratio of ChAT label in motor nuclei in all groups was symmetrical on the two sides.
Changes in motor maps
To determine physiological changes in M1 in response to training, we used intracortical microstimulation to map motor cortex in the three animal groups. Representative examples of motor maps from individual animals are shown in Figure 9A. The dashed circles correspond to the region of maximal inhibition, as reported from other studies (see Materials and Methods). The more extended regions of reduced activity suppression is not shown. There was a striking difference between the two trained animals and the untrained (restraint-alone) animal; the untrained animals had few effective sites (average number of effective sites per animal − early training = 17.7, delayed training = 17.3, restraint alone = 3). Furthermore, and quantified below, the maps of early and delayed training animals look much like controls, and the map of the restraint-only animal looked like inactivation-only animals (Chakrabarty et al., 2009).
Figure 9.

Intracortical microstimulation. A, Representative motor maps from one animal in each treatment group. The dotted circle represents the approximate extent of the muscimol inactivation (Martin et al., 1999; Friel et al., 2007). The line midway between the columns of stimulation sites in each animal represents the cruciate sulcus. Site markers of multiple colors represent multijoint movements. Elbow and shoulder sites were combined and labeled proximal. No effect sites were tested up to 100 μA. The size of each site marker is proportional to the stimulus intensity needed to evoke a movement at that site. Scale bar, 1 mm. B, Percentage responsive sites in all groups. The percentage distal and multijoint sites were decreased in the inactivation, no-intervention, and restraint-alone groups, whereas the early and delayed training groups had similar amounts of distal and multijoint sites as control/no-inactivation animals. The inactivation, no-intervention, and restraint-alone groups had significantly more proximal sites than the no-inactivation, early, and delayed training groups. C, The thresholds at which movements could be evoked were statistically higher in the restraint-alone group than the early training, delayed training, and no-inactivation groups (*p < 0.05).
We quantified the difference in the motor maps by examining the proportion of difference response types. Motor responses were categorized as distal (digit, wrist), proximal (elbow, shoulder), or multijoint (combined movement of two different joints within 1.1× the threshold of the lowest-threshold response). Importantly, both early and late training restored the M1 map to its normal proportions of distal, proximal, and multijoint sites. In contrast, restraint alone was no different from untreated animals (i.e., inactivation alone). Specifically, there was a significantly greater percentage of distal sites in the early training group than in the no-intervention or restraint-alone groups (χ2 = 42.9, df = 4, p < 0.0001). The percentage distal sites was not statistically different among the early training, delayed training, and no-inactivation groups (χ2 = 1.69, df = 2, p = 0.43). There was a significantly lower percentage of proximal sites in the early training group than in the no-intervention or restraint-alone groups (χ2 = 64.69, df = 4, p < 0.0001). The percentage of proximal sites was not statistically different among the early training, delayed training, and no-inactivation groups (χ2 = 0.83, df = 2, p = 0.66). There was a significantly higher percentage of multijoint sites in the early training group than in the no-intervention or restraint-alone groups (χ2 = 197.2, df = 4, p < 0.0001). The percentage of multijoint sites was not statistically different among the early training, delayed training, and no-inactivation groups (χ2 = 0.11, df = 2, p = 0.66).
The threshold at which a visually discernible response could be evoked was compared among the three treatment groups (Fig. 9C). There was a significant effect of group on threshold (ANOVA, F(2,7) = 24.33, p < 0.001). The threshold for the restraint-alone group (79 μA) was significantly higher than the early training (59.4 μA, t = 5.2, p = 0.035) and the delayed training groups (52.1 μA, t = 6.7, p = 0.022). The thresholds for the early training and delayed training groups were not statistically different from one another (t = 1.961, p = 0.3) and not significantly different from controls (i.e., no inactivation; 37.7 μA, t = 1.48, p = 0.2). Our findings are in agreement with others that the M1 motor map retains its representational plasticity into maturity. Furthermore, we show that it was necessary for the animal to engage in reach training to restore the M1 motor map; it was not sufficient simply to increase limb use.
Discussion
We show that a behavioral approach during an early critical period repairs a hierarchically ordered set of CS system circuit elements, and this is associated with restoring restore-effective targeting of skilled limb movement after CS system developmental injury. The normal organization of the M1 motor map and the distribution of CST terminations in the spinal cord, rather than a new organization, was necessary but not sufficient for motor recovery. It was the capacity of combined restraint, training, and early intervention to substantially increase the numbers of ChAT-expressing interneurons on the affected side of the spinal cord, relative to the opposite side, that was associated with recovery. We cannot say whether reestablishment of the motor map, CST spinal connectivity, and strong segmental ChAT expression reinstates normal limb control or, now with a more effective CS system, the animals are better able to implement new strategies for normal performance. Nevertheless, using combined limb restraint and training to achieve normally directed limb movement is significant. Our findings stress the need to reestablish the integrated functions of the CS system in bringing back skilled motor function, a consideration that is often lacking in repair studies in which emphasis is on promoting new connections.
Repairing the regional distribution of CST spinal terminations
Constraint of the unimpaired limb alone, which creates an asymmetrical pattern of limb use and presumably CST activity, is sufficient to repair CST terminations after inactivation of M1 during a critical period. Remarkably, constraint alone produced contralateral CST rewiring comparable with direct manipulation of the activity of the CST: either stimulation of the affected contralateral tract (Salimi et al., 2008) or inactivation of the ipsilateral M1 (Friel and Martin, 2007). On the basis of similarity between the effects of constraint of the unimpaired limb, inactivation of contralateral CST, and stimulation of the impaired CST, we conclude that each approach recruits a similar competition-based mechanism for restoring CST connectivity. However, we noted that restraint, alone or with training, failed to abrogate consistently the density of aberrant ipsilateral CST terminations from ipsilateral M1, whereas activity manipulations resulted in consistent reductions (Friel and Martin, 2007; Salimi et al., 2008). That behavioral manipulations failed to minimize consistently the aberrant ipsilateral connections from the unaffected side suggests a dose–response effect (i.e., behavioral intervention is more modest than activity manipulations). This further raises the question of whether aberrant dense ipsilateral terminations from the unimpaired side are adaptive and if functional recovery uses a bilateral CST repair strategy. Previously, we presented evidence favoring an adaptive role for ipsilateral CST terminations (Martin et al., 2000). Similarly, adult rat and monkey CST lesion studies show consistent association between recovery and ipsilateral CST outgrowth (Maier et al., 2008; Carmel et al., 2010; Rosenzweig et al., 2010). However, in normal monkey, there is no effective ipsilateral monosynaptic CST connection with motoneurons, again calling into question the functional role of the ipsilateral CST (Soteropoulos et al., 2011). Until it is possible to selectively inactivate ipsilateral CST axons, this question will not be resolved.
That restraint in adolescent cats was as effective as in younger cats suggests that either there is no critical period for local CST outgrowth or that it is highly protracted, more like a sensitive than critical period. Constraint of the unimpaired limb after pyramidal lesion in adult rats promoted outgrowth of the spared ipsilateral CST (Maier et al., 2008). Also in adult rats, augmentation of spared CST axons occurs with electrical stimulation (Brus-Ramer et al., 2007; Carmel et al., 2010). Mature CST neurons are incapable of axon regeneration after axotomy unless their growth state is manipulated (Liu et al., 2010) or the environment is made conducive for growth (Schnell and Schwab, 1990; Grimpe and Silver, 2004). Importantly, extensive CST sprouting within the gray matter after injury appears to be robust at all ages but only when their activity is augmented or the activity of the opposite side is reduced.
Repairing the M1 motor representation
With training at either age came restoration of the topography and efficacy of the M1 forelimb motor map. These findings parallel work in the primate stroke model, showing that forced use of the affected limb is not sufficient to recover the motor map; skilled training is required (Friel et al., 2000). Thus, there may little or no critical period for M1 motor map plasticity or CST local outgrowth. This is consistent with the large literature showing M1 motor map plasticity in mature animals (Monfils et al., 2005). Although the M1 motor map is often used as a proxy for CS system motor function, we find that restoring normal map parameters is not sufficient to restore function. The M1 motor map may encode motor recovery potential.
The M1 represents contralateral muscles and joints and, as the principal origin of the CST, provides functional somatotopic access for diverse M1 inputs to spinal motor circuits. With developmental injury/impairment there is never a period when the M1 motor representation is present. A period of map development may be necessary during recovery, such as the period of map formation that normally occurs between PW7/8 and PW13 (Chakrabarty and Martin, 2000). We propose that, during training, the motor systems learn to take advantage of the newly repaired spinal circuitry in much the same way as occurs during normal M1 motor map development.
Response of spinal cholinergic circuits to CST injury
Although there may by other neurotransmitter phenotypic changes after CST injury and treatment, we focused on cholinergic mechanisms because they are apt to be important for limb control and cholinergic interneuron development is under CST regulation. Cholinergic interneurons are an abundant class in the spinal cord (Barber et al., 1984; Huang et al., 2000). Many are movement related because they are active during fictive locomotion (Huang et al., 2000), and the Pitx2 group (Zagoraiou et al., 2009; Enjin et al., 2010) makes the M2-type muscarinic C-bouton on motoneurons (Miles et al., 2007) that may provide task-dependent regulation of motoneuronal excitability (Zagoraiou et al., 2009). Cholinergic agonists are potent modulators of spinal locomotor circuits (Dai et al., 2009; Dai and Jordan, 2010). Development of a cholinergic phenotype in most spinal interneurons occurs postnatally (Phelps et al., 1984; Chakrabarty et al., 2009a). We have shown that postnatal maturation of ChAT phenotype is CST dependent: blocking CST activity between PW5 and PW7 prevented normal ChAT expression throughout the deep laminae of the dorsal horn and intermediate zone (Chakrabarty et al., 2009a), key termination regions of the CST.
A critical period effect could explain why early but not late training differentially increased ChAT expression. Why is training required to upregulate ChAT? A cholinergic phenotype appears to be dependent on the constitutive level of neural activity, similar to neurotransmitter switching in other systems (Borodinsky et al., 2004). Whereas it may depend on particular spatiotemporal firing patterns associated with skilled task performance, we suspect that it is a dose–response effect. Electrical stimulation of the affected CST leads to behavioral improvements (Salimi et al., 2008). Plausibly, this direct activity manipulation powerfully drives spinal circuits more than asymmetric limb use associated with restraint, and, in consequence, might also lead to upregulation of contralateral segmental ChAT expression. Intriguingly, inactivation of the unaffected ipsilateral CS system also leads to behavioral recovery (Friel and Martin, 2007), but this would not be expected to drive the affected contralateral segmental motor circuits. If motor recovery after reducing the unaffected CS system also is accompanied by increased ChAT expression, it implies a complex bilateral regulation and would help inform why it is that upregulation of ChAT expression in the affected, relative to opposite, side is associated with motor recovery. One should keep in mind the dominant reciprocal bilateral organization of spinal circuits, whereby there is a phasic locomotor drive to one side of the spinal cord, there is reciprocal inhibition on the other, and this inhibition is mediated by segmental commissural circuits.
Combinatorial hierarchical recovery code
Constraint alone creates asymmetric limb use. We propose that segmental circuitry can amplify this imbalance through commissural inhibition, normally recruited to inhibit contralateral central pattern generator circuitry during locomotion. The more active side of the cord could effectively inhibit contralateral circuits, and this, in turn, would lead to disinhibition of the more active side. These spinal excitability changes could create an environment permissive for greater CST outgrowth. Perhaps because there is expression of guidance cues, because the animals are not fully mature, targeting of outgrowth is appropriate.
Reach training could amplify this process through greater activation of the affected side, greater inhibition of the opposite side, and more disinhibition. Importantly, given CS control of reaching and visually guided locomotion, this activity boost would more selectively affect the spinal follower circuits of CST. Thus, we propose that functional recovery of visually guided control can be achieved by either direct activity manipulations of the CST or preferentially recruiting the CST during particular tasks. In the context of this hypothesis, combined training and direct activity manipulations are apt to yield the strongest effect. The normal topography of the M1 motor map likely reflects the efferent organization of the CST, which even after restraint alone is well directed. What is lacking in the late-trained group is a critical function of segmental circuitry.
Footnotes
This work was supported by National Institutes of Health (NIH) Grants R01 NS36835 (J.H.M.) K01 NS062116 (K.M.F.) and NIH Clinical and Translational Science Awards KL2 RR024157, UL1 RR024156, and TL1 RR024158) (K.M.F.). We thank Xiuli Wu for immunohistochemistry and histology and Danna Zeiger for confocal microscopy.
References
- Barber RP, Phelps PE, Houser CR, Crawford GD, Salvaterra PM, Vaughn JE. The morphology and distribution of neurons containing choline acetyltransferase in the adult rat spinal cord: an immunocytochemical study. J Comp Neurol. 1984;229:329–346. doi: 10.1002/cne.902290305. [DOI] [PubMed] [Google Scholar]
- Borodinsky LN, Root CM, Cronin JA, Sann SB, Gu X, Spitzer NC. Activity-dependent homeostatic specification of transmitter expression in embryonic neurons. Nature. 2004;429:523–530. doi: 10.1038/nature02518. [DOI] [PubMed] [Google Scholar]
- Brus-Ramer M, Carmel JB, Chakrabarty S, Martin JH. Electrical stimulation of spared corticospinal axons augments connections with ipsilateral spinal motor circuits after injury. J Neurosci. 2007;27:13793–13801. doi: 10.1523/JNEUROSCI.3489-07.2007. [DOI] [PMC free article] [PubMed] [Google Scholar]
- Carmel JB, Berrol LJ, Brus-Ramer M, Martin JH. Chronic electrical stimulation of the intact corticospinal system after unilateral injury restores skilled locomotor control and promotes spinal axon outgrowth. J Neurosci. 2010;30:10918–10926. doi: 10.1523/JNEUROSCI.1435-10.2010. [DOI] [PMC free article] [PubMed] [Google Scholar]
- Chakrabarty S, Martin JH. Postnatal development of the motor representation in primary motor cortex. J Neurophysiol. 2000;84:2582–2594. doi: 10.1152/jn.2000.84.5.2582. [DOI] [PubMed] [Google Scholar]
- Chakrabarty S, Martin JH. Postnatal development of a segmental switch enables corticospinal tract transmission to spinal forelimb motor circuits. J Neurosci. 2010;30:2277–2288. doi: 10.1523/JNEUROSCI.5286-09.2010. [DOI] [PMC free article] [PubMed] [Google Scholar]
- Chakrabarty S, Shulman B, Martin JH. Activity-dependent codevelopment of the corticospinal system and target interneurons in the cervical spinal cord. J Neurosci. 2009a;29:8816–8827. doi: 10.1523/JNEUROSCI.0735-09.2009. [DOI] [PMC free article] [PubMed] [Google Scholar]
- Chakrabarty S, Friel KM, Martin JH. Activity-dependent plasticity improves M1 motor representation and corticospinal tract connectivity. J Neurophysiol. 2009b;101:1283–1293. doi: 10.1152/jn.91026.2008. [DOI] [PMC free article] [PubMed] [Google Scholar]
- Dai Y, Jordan LM. Multiple effects of serotonin and acetylcholine on hyperpolarization-activated inward current in locomotor activity-related neurons in cfos-EGFP mice. J Neurophysiol. 2010;104:366–381. doi: 10.1152/jn.01110.2009. [DOI] [PubMed] [Google Scholar]
- Dai Y, Carlin KP, Li Z, McMahon DG, Brownstone RM, Jordan LM. Electrophysiological and pharmacological properties of locomotor activity-related neurons in cfos-EGFP mice. J Neurophysiol. 2009;102:3365–3383. doi: 10.1152/jn.00265.2009. [DOI] [PMC free article] [PubMed] [Google Scholar]
- Enjin A, Rabe N, Nakanishi ST, Vallstedt A, Gezelius H, Memic F, Lind M, Hjalt T, Tourtellotte WG, Bruder C, Eichele G, Whelan PJ, Kullander K. Identification of novel spinal cholinergic genetic subtypes disclose Chodl and Pitx2 as markers for fast motor neurons and partition cells. J Comp Neurol. 2010;518:2284–2304. doi: 10.1002/cne.22332. [DOI] [PubMed] [Google Scholar]
- Friel KM, Martin JH. Role of sensory-motor cortex activity in postnatal development of corticospinal axon terminals in the cat. J Comp Neurol. 2005;485:43–56. doi: 10.1002/cne.20483. [DOI] [PubMed] [Google Scholar]
- Friel KM, Martin JH. Bilateral activity-dependent interactions in the developing corticospinal system. J Neurosci. 2007;27:11083–11090. doi: 10.1523/JNEUROSCI.2814-07.2007. [DOI] [PMC free article] [PubMed] [Google Scholar]
- Friel KM, Heddings AA, Nudo RJ. Effects of postlesion experience on behavioral recovery and neurophysiologic reorganization after cortical injury in primates. Neurorehabil Neural Repair. 2000;14:187–198. doi: 10.1177/154596830001400304. [DOI] [PubMed] [Google Scholar]
- Friel KM, Drew T, Martin JH. Differential activity-dependent development of corticospinal control of movement and final limb position during visually-guided locomotion. J Neurophysiol. 2007;97:3396–3406. doi: 10.1152/jn.00750.2006. [DOI] [PMC free article] [PubMed] [Google Scholar]
- Grimpe B, Silver J. A novel DNA enzyme reduces glycosaminoglycan chains in the glial scar and allows microtransplanted dorsal root ganglia axons to regenerate beyond lesions in the spinal cord. J Neurosci. 2004;24:1393–1397. doi: 10.1523/JNEUROSCI.4986-03.2004. [DOI] [PMC free article] [PubMed] [Google Scholar]
- Himmelmann K, Hagberg G, Beckung E, Hagberg B, Uvebrant P. The changing panorama of cerebral palsy in Sweden. IX. Prevalence and origin in the birth-year period 1995–1998. Acta Paediatrica. 2005;94:287–294. doi: 10.1111/j.1651-2227.2005.tb03071.x. [DOI] [PubMed] [Google Scholar]
- Huang A, Noga BR, Carr PA, Fedirchuk B, Jordan LM. Spinal cholinergic neurons activated during locomotion: localization and electrophysiological characterization. J Neurophysiol. 2000;83:3537–3547. doi: 10.1152/jn.2000.83.6.3537. [DOI] [PubMed] [Google Scholar]
- Lemon RN. Descending pathways in motor control. Annu Rev Neurosci. 2008;31:195–218. doi: 10.1146/annurev.neuro.31.060407.125547. [DOI] [PubMed] [Google Scholar]
- Li Q, Martin JH. Postnatal development of corticospinal axon terminal morphology in the cat. J Comp Neurol. 2001;435:127–141. doi: 10.1002/cne.1197. [DOI] [PubMed] [Google Scholar]
- Liu K, Lu Y, Lee JK, Samara R, Willenberg R, Sears-Kraxberger I, Tedeschi A, Park KK, Jin D, Cai B, Xu B, Connolly L, Steward O, Zheng B, He Z. PTEN deletion enhances the regenerative ability of adult corticospinal neurons. Nat Neurosci. 2010;13:1075–1081. doi: 10.1038/nn.2603. [DOI] [PMC free article] [PubMed] [Google Scholar]
- Maier IC, Baumann K, Thallmair M, Weinmann O, Scholl J, Schwab ME. Constraint-induced movement therapy in the adult rat after unilateral corticospinal tract injury. J Neurosci. 2008;28:9386–9403. doi: 10.1523/JNEUROSCI.1697-08.2008. [DOI] [PMC free article] [PubMed] [Google Scholar]
- Martin JH. Differential spinal projections from the forelimb areas of the rostral and caudal subregions of primary motor cortex in the cat. Exp Brain Res. 1996;108:191–205. doi: 10.1007/BF00228094. [DOI] [PubMed] [Google Scholar]
- Martin JH, Ghez C. Differential impairments in reaching and grasping produced by local inactivation within the forelimb representation of the motor cortex in the cat. Exp Brain Res. 1993;94:429–443. doi: 10.1007/BF00230201. [DOI] [PubMed] [Google Scholar]
- Martin JH, Lee SJ. Activity-dependent competition between developing corticospinal terminations. Neuroreport. 1999;10:2277–2282. doi: 10.1097/00001756-199908020-00010. [DOI] [PubMed] [Google Scholar]
- Martin JH, Kably B, Hacking A. Activity-dependent development of cortical axon terminations in the spinal cord and brain stem. Exp Brain Res. 1999;125:184–199. doi: 10.1007/s002210050673. [DOI] [PubMed] [Google Scholar]
- Martin JH, Donarummo L, Hacking A. Impairments in prehension produced by early postnatal sensorimotor cortex activity blockade. J Neurophysiol. 2000;83:895–906. doi: 10.1152/jn.2000.83.2.895. [DOI] [PubMed] [Google Scholar]
- Martin JH, Choy M, Pullman S, Meng Z. Corticospinal development depends on experience. J Neurosci. 2004;24:2122–2132. doi: 10.1523/JNEUROSCI.4616-03.2004. [DOI] [PMC free article] [PubMed] [Google Scholar]
- Martin J, Friel K, Salimi I, Chakrabarty S. Corticospinal development. In: Squire L, editor. Encyclopedia of neuroscience. Oxford: Academic; 2009. pp. 302–214. [Google Scholar]
- Meng Z, Li Q, Martin JH. The transition from development to motor control function in the corticospinal system. J Neurosci. 2004;24:605–614. doi: 10.1523/JNEUROSCI.4313-03.2004. [DOI] [PMC free article] [PubMed] [Google Scholar]
- Miles GB, Hartley R, Todd AJ, Brownstone RM. Spinal cholinergic interneurons regulate the excitability of motoneurons during locomotion. Proc Natl Acad Sci U S A. 2007;104:2448–2453. doi: 10.1073/pnas.0611134104. [DOI] [PMC free article] [PubMed] [Google Scholar]
- Monfils MH, Plautz EJ, Kleim JA. In search of the motor engram: motor map plasticity as a mechanism for encoding motor experience. Neuroscientist. 2005;11:471–483. doi: 10.1177/1073858405278015. [DOI] [PubMed] [Google Scholar]
- Phelps PE, Barber RP, Houser CR, Crawford GD, Salvaterra PM, Vaughn JE. Postnatal development of neurons containing choline acetyltransferase in rat spinal cord: an immunocytochemical study. J Comp Neurol. 1984;229:347–361. doi: 10.1002/cne.902290306. [DOI] [PubMed] [Google Scholar]
- Rosenzweig ES, Courtine G, Jindrich DL, Brock JH, Ferguson AR, Strand SC, Nout YS, Roy RR, Miller DM, Beattie MS, Havton LA, Bresnahan JC, Edgerton VR, Tuszynski MH. Extensive spontaneous plasticity of corticospinal projections after primate spinal cord injury. Nat Neurosci. 2010;13:1505–1510. doi: 10.1038/nn.2691. [DOI] [PMC free article] [PubMed] [Google Scholar]
- Salimi I, Friel KM, Martin JH. Pyramidal tract stimulation restores normal corticospinal tract connections and visuomotor skill after early postnatal motor cortex activity blockade. J Neurosci. 2008;28:7426–7434. doi: 10.1523/JNEUROSCI.1078-08.2008. [DOI] [PMC free article] [PubMed] [Google Scholar]
- Schnell L, Schwab ME. Axonal regeneration in the rat spinal cord produced by an antibody against myelin-associated neurite growth inhibitors. Nature. 1990;343:269–272. doi: 10.1038/343269a0. [DOI] [PubMed] [Google Scholar]
- Soteropoulos DS, Edgley SA, Baker SN. Lack of evidence for direct corticospinal contributions to control of the ipsilateral forelimb in monkey. J Neurosci. 2011;31:11208–11219. doi: 10.1523/JNEUROSCI.0257-11.2011. [DOI] [PMC free article] [PubMed] [Google Scholar]
- Volpe JJ. Brain injury in premature infants: a complex amalgam of destructive and developmental disturbances. Lancet Neurol. 2009;8:110–124. doi: 10.1016/S1474-4422(08)70294-1. [DOI] [PMC free article] [PubMed] [Google Scholar]
- Zagoraiou L, Akay T, Martin JF, Brownstone RM, Jessell TM, Miles GB. A cluster of cholinergic premotor interneurons modulates mouse locomotor activity. Neuron. 2009;64:645–662. doi: 10.1016/j.neuron.2009.10.017. [DOI] [PMC free article] [PubMed] [Google Scholar]