Abstract
We analyze a closed loop neuromechanical model of locomotor rhythm generation. The model is composed of a spinal central pattern generator (CPG) and a single-joint limb, with CPG outputs projecting via motoneurons to muscles that control the limb and afferent signals from the muscles feeding back to the CPG. In a preceding companion paper, we analyzed how the model generates oscillations in the presence or absence of feedback, identified curves in a phase plane associated with the limb that signify where feedback levels induce phase transitions within the CPG, and explained how increasing feedback strength restores oscillations in a model representation of spinal cord injury; from these steps, we derived insights about features of locomotor rhythms in several scenarios and made predictions about rhythm responses to various perturbations. In this paper, we exploit our analytical observations to construct a reduced model that retains important characteristics from the original system. We prove the existence of an oscillatory solution to the reduced model using a novel version of a Melnikov function, adapted for discontinuous systems and also comment on the uniqueness and stability of this solution. Our analysis yields a deeper understanding of how the model must be tuned to generate oscillations and how the details of the limb dynamics shape overall model behavior. In particular, we explain how, due to the feedback signals in the model, changes in the strength of a tonic supra-spinal drive to the CPG yield asymmetric alterations in the durations of different locomotor phases, despite symmetry within the CPG itself.
1. Introduction
Animals’ interactions with the environment include various repetitive movements, such as breathing, walking, swimming, and many others, that are produced by the coordinated rhythmic activities of neuronal networks called central pattern generators (CPGs). Brown’s bipartite, or half-center, model of the spinal locomotor CPG [1, 2], refined by Lundberg [3, 4], provided an important conceptual basis for the neural control of locomotion. According to this concept, a rhythmic pattern of alternating flexor and extensor activity is produced by two excitatory neural populations that drive flexor and extensor motoneurons, respectively, and inhibit each other via inhibitory interneurons. Experimental studies of fictive locomotion using decerbrate, immobilized cat preparations [5, 6] and recent investigations of deletions, or spontaneous errors, during fictive locomotion [5, 7, 8, 9] have provided evidence for a symmetrical, half-center organization of the spinal locomotor CPG. The intrinsic neural mechanisms involved in the generation of locomotor oscillations remain unknown, however.
A recent neuromechanical locomotor model developed by Markin et al. [10] includes a relatively simple, symmetric two-level spinal central pattern generator that drives the activity of a single-joint limb. Given a sufficiently strong, constant drive, the CPG oscillates and controls two antagonistic muscles, whose anti-phase contractions control the limb and provide excitatory feedback to the CPG. This closed-loop system exhibits several important features of mammalian locomotion, including the ability to change oscillation frequency with changes in drive. Importantly, the resulting speed increase occurs through a decrease in the duration of the stance phase, when the limb is in contact with the ground, and is independent of the swing phase, when the limb moves without ground contact [11, 12]. This asymmetric response contrasts with fictive locomotion results, which can involve either a dominance of the flexor or extensor phase or neither [6], and indeed, the speed of model oscillations when feedback is removed changes symmetrically, with equal changes in extensor and flexor components with changes in drive [10, 7, 13]. A major goal of this paper is to analyze how the feedback components of the closed-loop neuromechanical model lead to an asymmetric frequency response.
In the companion article to this one, we investigated the mechanisms underlying oscillatory behavior within the model CPG both in the presence and in the absence of feedback [13]. Without feedback, a slow-fast decomposition analysis revealed that the intrinsic structure of a set of rhythm generator (RG) neurons within the CPG allows oscillations to occur through RG escape for a sufficiently large supra-spinal drive. When feedback is present, however, oscillations occur through a different mechanism, namely the escape of CPG inhibitory interneurons (In) from the silent phase, which happens when feedback drives In voltage above a certain threshold. We showed that this threshold condition is met when a particular relationship between limb angle and velocity, which is independent of drive, is realized, and this observation allowed us to identify transition curves in limb phase space that indicate where switches between the extensor and flexor activities produced by the CPG will occur. In addition, we explained how oscillations fail in a simulation of spinal cord injury (SCI) achieved by removal of supra-spinal drive and how increasing the feedback strength restores oscillations.
Equipped with insights from this analysis, in this paper we propose a reduced model that maintains key model features and study conditions for the existence of stable periodic orbits in the reduced model setting (Sections 2, 3). To complete our existence argument, we use a novel version of the Melnikov function, adapted for discontinuous systems. Our analytical steps highlight the mechanism by which the oscillation can be lost if drive is reduced too far and also reveal the presence of a strong contraction in the phase space associated with the limb segment, which occurs during a particular phase of each locomotor oscillation. We go on to explain how this contraction plays a key role in the asymmetric response to drive in the closed-loop system and why other phases do not significantly contribute to this response (Section 4).
2. Reduced model preserves phase asymmetry and exhibits a (unique) periodic solution
2.1. Overview of original model features
In the neuromechanical locomotion model proposed by Markin et al. [10], given sufficient supra-spinal drive, a collection of neurons (collectively termed the central pattern generator, or CPG) coordinate their activity to send alternating signals to corresponding antagonistic muscles, which control a single-joint limb and provide afferent feedback signals to the CPG. In this CPG, flexor and extensor rhythm generator neurons RG - F and RG - E indirectly inhibit one another by exciting partner interneurons In - F and In - E, respectively. The alternating outputs from the rhythm generator are shaped by pattern formation neurons PF - F and PF - E, which project to a set of motoneurons Mn - F and Mn - E. The motoneurons activate flexor and extensor muscles, controlling the limb activity. These neurons are modeled either by a two dimensional simplified conductance-based system of differential equations in Vi and hi, where Vi denotes the voltage drop across the membrane (voltage) and hi represents the slow inactivation of the persistent sodium current of neuron i, or by a one dimensional conductance-based differential equation in Vi alone. Inputs to each neuron are synaptic, consisting of inhibitory and excitatory interactions between neurons, a constant excitatory supra-spinal drive d that projects to the RGs and PFs, and continuously time-varying excitatory muscle feedback signals to the RGs, Ins, and PFs. We use the notation FBk to refer to the time-dependent total summed feedback to neuron k. For each neuron, we transform the voltage V into an output between 0 and 1, using the nonlinear transformation
where we use V1/2 = −30, mV, k = 3 mV for Mn and k = 8 mV for all other neurons, and Vth = −50 mV. See [13] for additional function and parameter value specifications.
The limb motion can be described by a second order ordinary differential equation or equivalently by a system of two first order equations
| (1) |
where q is the angle the limb makes with the horizontal and v is its angular velocity. The forces driving the limb depend on gravity, muscle length and velocity, ground contact, and the output of flexor and extensor motoneurons Mn - F and Mn - E. To model the interaction with the ground, MGR(q) = MGRmaxcos(q) is applied only during the stance phase, when the limb is swinging counterclockwise (v > 0), and is set to zero during the swing phase, when the limb swings in the clockwise direction (v < 0).
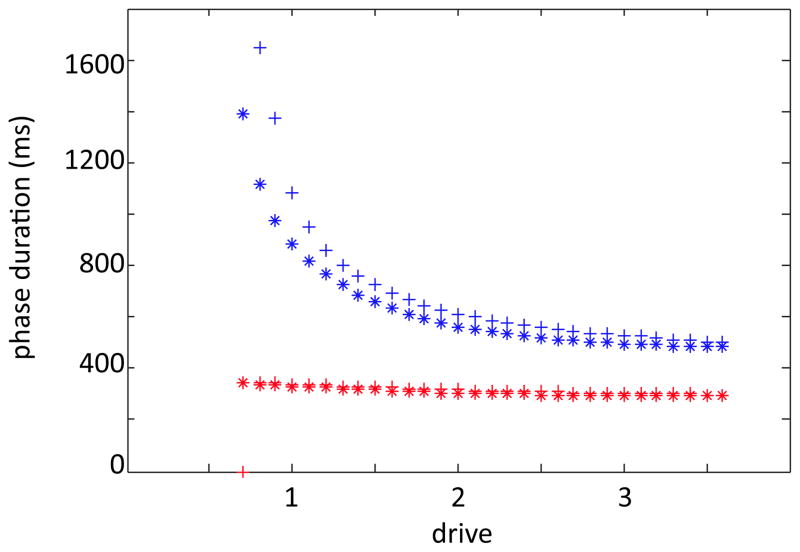
Length- and force-dependent feedback from the muscles modify the CPG output to reproduce the experimental result that an increase in locomotor speed occurs through a decrease in stance duration, at a relatively constant swing phase duration (see [13], Figure 3). The companion paper to this one [13] provides a thorough description of the model.
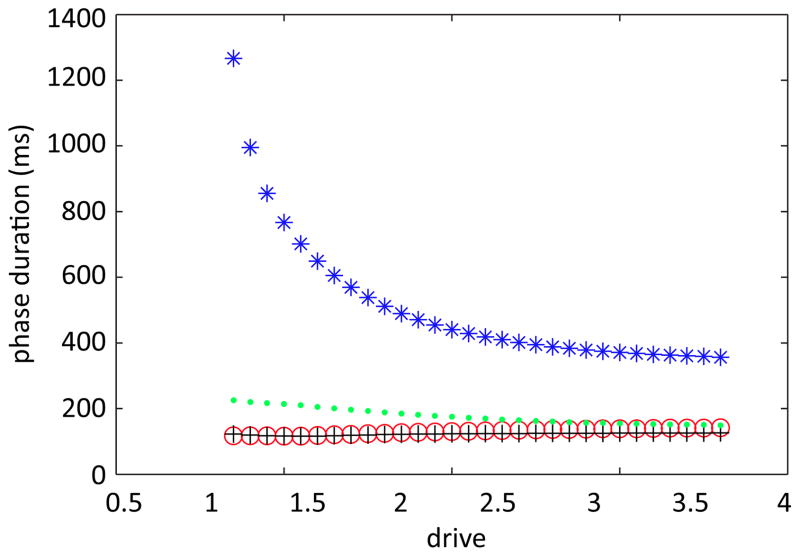
Figure 3.
Reduced model preserves phase asymmetry as drive is increased. Stance and swing phase durations for the original model are shown in blue and red stars, respectively. Stance and swing phase durations for the reduced model are plotted in analogous colors with plus signs.
As we showed previously [13], depending on whether or not feedback is present, the model CPG can exhibit half-center oscillations through different escape mechanisms that can be understood in terms of a separation of timescales and the consideration of nullclines for components of the CPG. We would now like to characterize the conditions under which stable periodic oscillations can occur in the presence of feedback as well as the dynamic mechanisms that shape these oscillations, which will be critical in understanding the asymmetric response to drive.
2.2. Rapid transitions can be used to define four locomotor phases
We can visualize behavior of the model limb, governed by equation (1), in a phase space where limb velocity is plotted against angle. A locomotor cycle corresponds to a trajectory moving clockwise in (q, q̇ = v) phase space. Positive velocity, leading to an increase in q, corresponds to periods when the ground contact force is present, which is denoted as the stance phase. A rapid change in which side of the CPG is dominant, and hence in Mn activity, translates to a rapid change in the right hand side of equation (1), based on the force terms that depend on the motoneuron outputs. Eventually, such a change can cause the velocity of the limb to change sign, and in the model the ground reaction force instantaneously activates/deactivates when this happens, to simulate the onset/offset of ground contact.
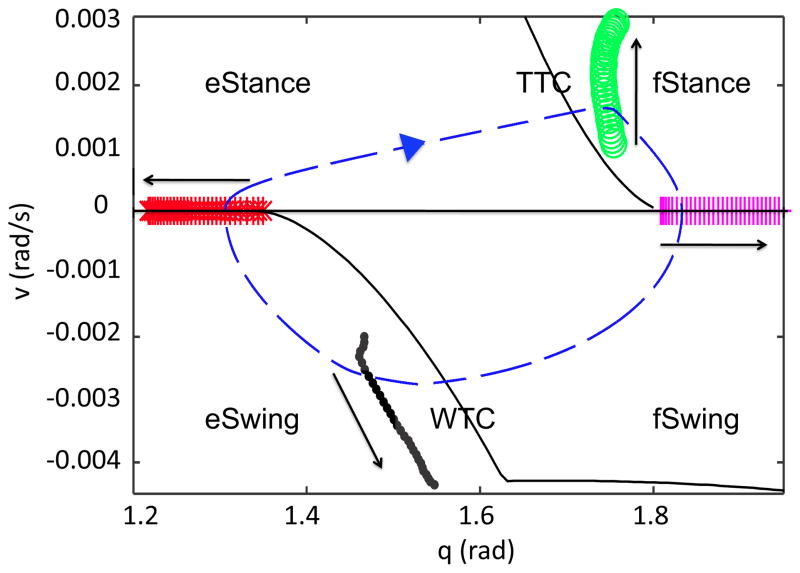
Changes in CPG dominance and in ground reaction force partition limb motion into four distinct phases, such that within each phase, the limb behaves in a continuous manner, and at each transition, the limb acceleration is discontinuous. We denote each of the four phases by their dominant muscle (flexor or extensor), and the presence/absence of the ground reaction force (stance/swing) to obtain the notation eStance, fStance, fSwing, and eSwing. The eStance phase is characterized by an active Mn - E and positive limb velocity, hence the additional force from ground contact is present. This phase begins when the limb trajectory crosses from below to above the q-axis and is terminated when RG - F turns on. As described in [13], Section 3.3, we can define a curve in the limb phase plane such that when the limb trajectory hits this curve, the extensor component of the CPG becomes inactive and the flexor component activates. This definition can be made because the transition within the CPG occurs through an escape of In - F from its silent phase, causing it to shut down RG - E and In - E and hence allowing RG - F to activate. This escape occurs when the feedback to In - F reaches a critical value FBcrit. Because the feedback signals to In - F while it is silent depend only on the (q, v) coordinates of the limb, the equation FBIn–F = FBcrit defines a transition curve, which we call the TTC for sTance Transition Curve, in the (q, v) phase plane. Thus, the duration of the eStance phase depends on how quickly the feedback to In - F reaches FBcrit, or how quickly the TTC is reached. The fStance phase is characterized by an active Mn - F and positive limb velocity, so again, the ground reaction force is present here. This phase begins when RG - F becomes active at the TTC and ends when the limb trajectory crosses the q-axis from above to below. The fSwing phase is characterized by an active Mn - F and negative limb velocity, so the ground reaction force is absent. This phase begins when the limb trajectory crosses from above to below the q-axis and ends when RG - E turns on. This transition occurs at another curve in the (q, v) plane, the sWing Transition Curve or WTC, which is defined analogously to the TTC, using the feedback to In - E. Thus, the duration of fSwing depends simply on how long it takes the feedback to In - E to reach FBcrit. The final phase, eSwing, is characterized by an active Mn - E and negative limb velocity, again with no ground strike force present. This phase begins when RG - E becomes active at the WTC and ends when the trajectory crosses from below to above the q-axis.
In Figure 1, we vary the drive and mark the onset of each of the phases in (q, v) space. Green circles mark the onset of fStance, magenta plus signs the onset of fSwing, black dots the onset of eSwing, and red stars the onset of eStance. The onset of fStance and eSwing are slightly delayed relative to the transition curves, as explained in the Appendix of the previous paper [13]. Note that the amplitude of the orbit increases as drive is increased, despite the fact that the step duration decreases.
Figure 1.
Transitions between phases are marked over a range of drives. The solid arrows indicate the direction of increasing drive. Green circles denote the onset of fStance, magenta plus signs the onset of fSwing, black dots the onset of eSwing, and red stars the onset of eStance. The right hand side of the limb equation (1) changes in a discontinuous manner at each of these transitions. A sample trajectory (for drive=1.4), which evolves in the clockwise direction as time advances, is plotted with a blue dashed line for reference, and the transition curves are plotted in black. Notice that the CPG transitions lie close to the TTC and WTC, respectively, though they are shifted due to the brief transient the model exhibits between phases (see [13], Appendix).
2.3. Reduced model
Now that we have described the phases involved in each oscillation cycle, we would like to establish conditions under which such oscillations occur and are stable. Indeed, model simulations suggest that the limb quickly settles to a pattern that appears stable under perturbations. We next undertake a mathematical analysis of the existence of this solution, with additional comments on its uniqueness and stability. Constructing a mathematical proof of the existence of the solution, while somewhat technically involved, can provide a practical understanding of what dynamic features contribute to the emergence of the rhythm, while considering the uniqueness and stability of the solution gives information about whether other rhythms might co-exist with expected locomotor oscillations and how the oscillation will respond to perturbations, including variations in drive strength. In fact, the complicated dynamics present in the full model equation (1) prohibits us from using dynamical systems techniques to analytically establish such results about this system, so we first implement certain simplifications to the model based on our earlier observations in [13]. We are able to construct an existence argument, which is mostly analytical but also relies on a few numerical observations, for a periodic oscillatory solution of the resulting reduced model. This argument is itself of mathematical interest, in that it requires the adaptation of Melnikov theory for a discontinuous system.
First, we replace all inhibitory output terms in the model with a multiple of a Heaviside step function,
| (2) |
The factor 0.3944 was determined numerically from the original system by computing the time-average of the f(V) values over all inhibitory neurons and using the obtained value for f(V) in the equations for inhibitory synaptic currents. Second, we include sensory feedback only to In. Under these changes, the input to RG is completely determined; drive, as always, is a constant, and each RG neuron either receives inhibition or does not, depending on the state of the opposing In. Thus, unlike the full model in which the time-dependent inputs move the nullclines of each RG around in its two-dimensional phase space, the nullclines for each RG are now fixed in phase space except for abrupt jumps that occur when inhibition turns on or off. Maintaining the feedback to the In preserves the escape transition mechanism discussed in [13], provided that the parameter that scales the drive to PF is slightly reduced (to prevent these neurons from becoming active independently from RG for large drives). Finally, we alter the outputs of the motoneurons so that for a fixed drive, they are of a constant value, namely the time-averaged motoneuron output from the full model oscillation, within each phase. We denote these constant values by meSt, mfSt, mfSw, and meSw, respectively. Although we do not explicitly include it in our notation, these values increase with drive strength, reflecting the fact that in the full model, RG activation increases with drive, leading to a larger motoneuron output.
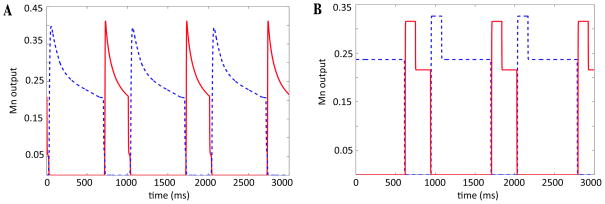
By fixing the motoneuron outputs, the right hand side of equation (1) is completely determined, and thus, from an initial condition, the position of the limb can be obtained at any time. Figure 2 shows a comparison of motoneuron output for the original and reduced models for drive strength d = 1.4.
Figure 2.
Motoneuron output generated by the original model (A) and reduced model (B) for drive strength d = 14. Red solid curves correspond to Mn - F, blue dashed to Mn - E. In the reduced model, motoneuron output is fixed at a different value in each phase, for each drive.
We call the model that results from these alterations the reduced model and note that it preserves the important phase asymmetry feature seen in the original model (Figure 3). For each fixed drive, the limb dynamics of the reduced model is governed by four continuous subsystems, one per phase,
| (3) |
where we recall that MGRmax denotes the amplitude of the moment of the ground reaction force, MGR(q).
We now introduce notation to encode the discontinuities in system (3). Define
| (4) |
| (5) |
and
| (6) |
With these definitions, we will use the shorthand
| (7) |
to denote the drive-dependent system of equations in (3). The brackets indicate that the function/constant within takes a value that depends on the limb’s location in phase space. When we work within a certain phase, however, we will specify those terms explicitly for clarity.
A significant amount of notation has now been introduced, and to help minimize confusion, we conclude this section by providing a summary of terms that are used in this paper, in Table 1.
Table 1.
Key Notation
| Term | Description | |
|---|---|---|
|
| ||
| d | constant supraspinal drive fed to CPG neurons | |
| q | limb angle with the horizontal | |
| v | limb angular velocity | |
| Ia-F, II - F | feedback terms to the flexor side | |
| Ia - E, Ib - E | feedback terms to the extensor side | |
| FBk | total summed feedback to neuron k | |
| FBcrit | feedback required to excite an inactive In above threshold; independent of drive | |
| TTC | Stance Transition Curve; location in limb phase space where flexor activates | |
| WTC | Swing Transition Curve; location in limb phase space where extensor activates | |
| eStance | portion of the locomotor phase where Mn - E is active and ground reaction is present | |
| fStance | portion of the locomotor phase where Mn - F is active and ground reaction is present | |
| eSwing | portion of the locomotor phase where Mn - E is active and ground reaction is absent | |
| fSwing | portion of the locomotor phase where Mn - F is active and ground reaction is absent | |
| I | moment of inertia of limb with respect to suspension point | |
| K | coefficient of gravitational moment | |
| b | angular viscosity in the hinge joint | |
| MGRmax | amplitude of moment of ground reaction force | |
| ME, MF, MGR | moment applied to limb from flexor, extensor, or ground reaction | |
| f | function that calculates the output activity of each neuron | |
| H | heaviside function that calculates inhibitory output in the reduced model | |
| mphase | fixed, drive-dependent motoneuron output during phase; obtained from time average of original model | |
| {} | notation indicating that the constant within is piecewise (phasewise) defined | |
| xε; = (qε, vε) | saddle point of system ẋ = f(x) + ε;g(x) for ε ∈ [0, 1] | |
| Wu(xε), Ws(xε) | unstable, stable manifold from xε | |
| W̃s(xε) | trajectory governed by the eSwing vector field that converges to xε as v ↑ 0 | |
| γ0 | homoclinic orbit emanating from x0 | |
| Σ | transversal to the flow | |
|
|
Melnikov function; sign indicates how the homoclinic perturbs with increasing ε | |
|
|
fixed muscle moment during phase; obtained to produce negative Melnikov sign | |
|
|
intersection of the stable and unstable manifolds with Σ; k ∈ {u, s} | |
3. Oscillations in the reduced model
3.1. Oscillations in the CPG component
In our previous paper, we showed that in the absence of feedback, switching between flexor and extensor activation within the CPG occurs through the escape of the suppressed RG. In contrast, when feedback is present, each dominance switch is initiated when excitatory feedback sufficiently increases the voltage of the silent In so that it can activate by escape and shut down the active RG on the opposite side of the CPG [13]. For our reduced model to be consistent with the assumptions made in defining it, it is important that the transitions still occur through In escape, so we next verify that this is the case. Given that the system is in a state with one side active and the other suppressed, we first determine whether or not the silent RG could escape and initiate a phase transition. We can apply the approach used without feedback in [13], Section 3.2; however, in the reduced model, inhibition from the active In takes the same value regardless of drive. Thus, in this case, there exists a unique drive value that causes the V and h-nullclines for the inhibited RG to intersect precisely at the left knee of the V -nullcline. For drive values smaller than this value, the intersection point lies on the left branch, and an escape transition initiated by the RG is not possible. Therefore, if we restrict our drive set to drives below this level, the transitions for the reduced system cannot occur through an RG mechanism, and are guaranteed to occur via In escape. As we did in [13], we find an explicit equation hc(V, d) for the RG V -nullcline inhibited with the strength indicated in equation (2), and we solve hc(V, d) = h∞(V) to find a drive-dependent expression for the voltage of the silent critical point, Vip(d). Separately, we calculate the drive-dependent voltage of the left knee, which satisfies , where ′ denotes differentiation with respect to V. We will denote this voltage as Vlk(d). Then, the drive that satisfies Vip(d) = Vlk(d) is the unique value where the left knee intersects the sigmoid. This value exceeds the largest drive value considered for the original model, which is the range of drives that we also use for our reduced model.
Next, it is easy to see that the transition cannot occur via RG release, in which the active RG reaches the right knee of its V-nullcline. Indeed, in the reduced model, the active RG receives no inhibition or feedback, and these conditions cause it to have a stable critical point on the right branch of its V-nullcline, preventing release. In theory, the active In could release the silent neurons and cause a transition, but this mechanism was never observed in the full model, and the input from RG to In and feedback strength are similar in the reduced model, again preventing this mechanism from arising. Thus, in the reduced model, the CPG switch always occurs through the In escape mechanism.
3.2. Existence and stability of a periodic solution for the reduced model
In this subsection, we give a dynamical systems argument to explain the mechanisms through which the existence of a periodic solution comes about in the reduced model, if the supra-spinal drive is sufficiently large. We will consider what happens for smaller drives in Section 4. From a mathematical point of view, rigorously establishing existence and stability of physically observed solutions is an important check of the validity of a model and may contribute to an understanding of the constraints on model parameters needed to maintain this validity. Moreover, as discussed earlier, these steps will allow us to better understand how oscillations may be altered or even lost under perturbations such as changes in drive strength and will also yield insights that will help us to explain the asymmetric phase response to changes in drive, as presented in Section 4.
Our existence argument is based on finding certain constant moments of the muscle forces for which the reduced model equation supports a certain special closed orbit, then perturbing the muscle moments away from these values, back toward their time courses in the true reduced model (7), and showing that the closed orbit breaks in a way that generates a periodic solution. The latter step uses a dynamical systems technique known as Melnikov theory. We must adapt this theory in a novel way, however, to handle the discontinuity present in model system (7). The use of Melnikov theory requires that certain assumptions hold. We will first review these assumptions and then show that system (7) can be molded to fit them.
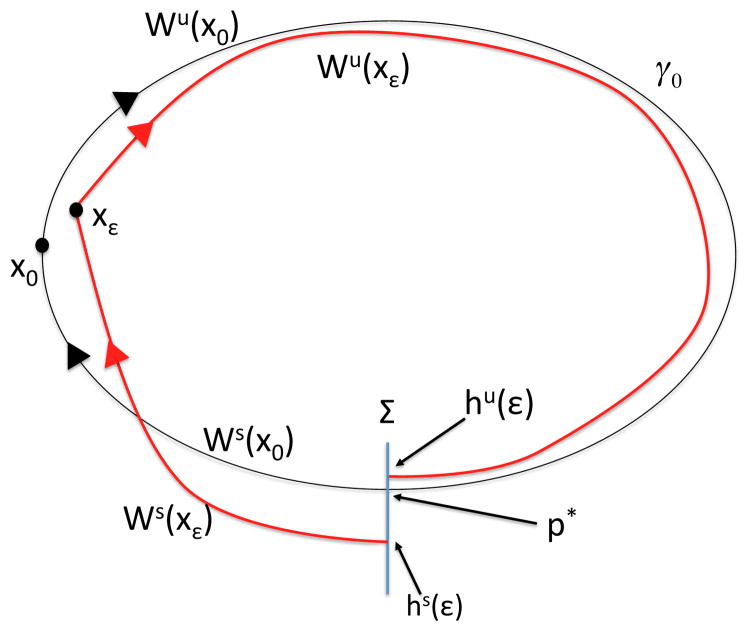
Let us assume that x = (q, v) satisfies a system of equations of the form ẋ = f(x) + εg(x, t), where f, g are continuous functions and g is θ-periodic, such that when ε = 0, a homoclinic orbit γ0 of this system originates from a saddle point x0 = (q0, v0). Denote the unstable manifold of x0 as Wu(x0) = {p ∈ D| limt⃗ −∞ p·t = x0} and the stable manifold as Ws(x0) = {p ∈ D| limt⃗ +∞ p·t = x0}, where D = {(q, v)|q ≥ q0}. By this choice of D, we select the manifold branches that lie in a particular half-plane relative to the critical point (later, it will become clear that this half-plane is the domain we care about for our system). Assume that γ0 = Wu(x0) ∩ Ws(x0). Fix a point p* ∈ γ0 and consider a transversal Σ to the q-equation that passes through this point, at time t0. Suppose that x0 perturbs to a saddle point xε for ε sufficiently small, and let hu(ε) = Wu(xε) ∩ Σ and hs(ε) = Ws(xε) ∩ Σ, where xε denotes the critical point of the system for a fixed value of ε. Although hu(0) = hs(0) = p*, we do not expect this intersection to persist as ε is increased. See Figure 4 for an illustration.
Figure 4.
A general schematic of the set-up for the existence argument. We wish to show that as ε is increased from 0, the homoclinic perturbs as shown, so that trajectories are trapped in forward time within the region bounded by the unstable and stable manifolds of xε. Arrows indicate flow in the forward direction.
The Melnikov function
| (8) |
provides an expression that indicates how hu(ε) and hs(ε) perturb for ε sufficiently small; traditionally, T = ∞, but we will discuss T for our model below. If this expression is negative, then as ε is increased from 0, the homoclinic orbit splits such that Wu(xε) lies on the inside of Ws(xε), as shown in Figure 4. If the expression is positive, then the opposite holds. Ultimately, we would like to prove that the flow for our reduced system (7) from an appropriate set of initial conditions is trapped in a compact region in phase space in forward time and hence, with some additional arguments, yields a periodic orbit. We intend to verify this by showing that an appropriate Melnikov function (8) is negative, but first, we need to cast our reduced system in the form described above and adapt some of the definitions involved to apply to our discontinuous system.
We introduce the new system
| (9) |
where {A}, {M}, and {m} were previously defined when we introduced the reduced system (7), and
| (10) |
is another piecewise constant function that is chosen to approximate {M}(q, v, {m}) in each of the four phases. System (10) is equivalent to system (7) for ε = 1. The following arguments will require drive d to be sufficiently large, as we shall discuss. For associated numerical illustrations, we chose the {m} values corresponding to d=1.4.
System (9) is of the form ẋ = f(x) + εg(x), where f(x) = [v, {A} cos(q) + {M*} − bv/I] and g(x) = [0, {M}(q, v, {m}) − {M*}]. While the reduced system is recovered when ε = 1, for ε = 0, we have a system where the entire muscle moment is replaced by a fixed value in each phase. However, the functions f and g in system (9) are not continuous, whereas the Melnikov function is defined for continuous systems. Fortunately, the construction and interpretation of the Melnikov function generalize immediately to the piecewise continuous system (8) that we consider, once we adapt the definition of the Melnikov function accordingly, as we now explain.
Let x0 be the saddle critical point where the v-nullcline corresponding to the eStance phase intersects the q-nullcline (q-axis) in the ε = 0 system. Note that x0 is not a critical point for the other phases. By choosing an appropriate {M*}, we can construct a closed orbit of system (9) that begins with the unstable manifold Wu(x0), which is of interest because the limb trajectory of the full model is in close proximity to this manifold in the eStance phase for small drives (see Section 4).
Once we choose , and , the value of is fully determined as the unique value that returns the orbit to x0. Interestingly, because x0 is not a critical point of system (9) in the eSwing phase, the orbit that we are following reaches x0 in finite time, at a time that we denote by T. We will assume that values of {M*} can be found such that this closed loop orbit exists, and this is the major assumption of our argument. In practice, this value can be found if drive is not too small. The violation of this assumption for smaller drive is discussed in Section 4.
Denote the orbit formed from this choice of {M*} as γ0 and choose a vertical segment near the WTC, which we call Σ, to which the flow of (9) is transverse (i.e., a local transversal). In this case, since our argument will depend on very small changes in the right hand side of equation (9), we do not ignore the transient between the time the trajectory hits the WTC and the time when the eSwing phase actually begins, in contrast to [13]. We account for this transient by marking the place on γ0 where the eSwing phase begins and using the vertical line through this point as our transversal Σ. For ε = 0, we can refer to the segment of γ0 from Σ to x0 as W̃s(x0), although it does not fit the definition of a stable manifold.
To establish results for system (7), which is recovered for ε = 1, we next wish to check how γ0 perturbs as ε is increased from 0. First, we verify that for each ε ∈ (0, 1], system (9) has a critical point xε = (qε, 0) that is a saddle, converging to x0 as ε → 0+, in the eStance phase. We provide the details of this verification in the Appendix.
Now, fix ε > 0 small. Since xε is a saddle point, it has an unstable manifold, defined with respect to the eStance component of the flow of (9). Since the v-component of xε is zero, we can define W̃s(xε) as the trajectory of the eSwing component of (9), taken in backwards time, connecting from xε to Σ. We aim to show that Wu(xε) perturbs to the inside of W̃s (xε)when ε is increased from zero, similarly to what is shown for Wu(xε) and Ws(xε) in the schematic illustration in Figure 4. If we denote the intersections of Wu(xε), W̃s(xε) with the transversal Σ by
, then this means that we require
, since Σ is vertical. In our notation, this relationship occurs if the function
 (t0) in (8) is negative, where T − t0 denotes the time of passage of W˜s(xε) from Σ to xε.
For system (9),
. This expression splits into four integrals, and since the limb trajectory γ0 actually reaches x0 at a finite forward time T due to the discontinuous nature of the system, only the eStance integral is evaluated over an infinite time interval. Until this point, we have assumed that we have chosen {M*} such that a closed orbit γ0 exists with ε = 0. We now place an additional constraint on our choice of {M*}: we wish to choose {M*} such that the integrand in each of these integrals is strictly negative. The existence of such a choice is a sufficient, although not necessary, condition for the splitting to occur as desired. In the Appendix, we show that we can select values of
, and
that achieves this condition, such that
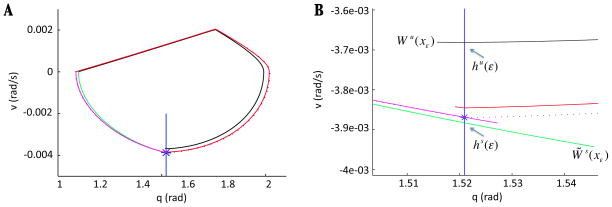
 (t0) < 0 indeed holds. Figure 5 shows the homoclinic for the ε = 0 case along with Wu(xε) and W̃s(xε) for ε = 0.01.
Figure 5.
Key structures for the Melnikov argument for ε = 0.01 and 0.1 with . (A) The closed orbit γ0 for system (9) with ε = 0 is plotted with a blue dotted line, along with the manifolds Wu(xε) {red, black} and W̃s(xε) {pink, green} for system (9) with ε ∈ {0.01, 0.1}. The transversal Σ is chosen as a vertical line (blue) through the point where eSwing begins on γ0 (indicated with a blue star). (B) Zoomed view of (A) near the intersection of γ0 and invariant manifolds with Σ, showing that Wu(xε) perturbs to the inside of W̃s (xε) in both cases. For ε sufficiently close to 0, W̃s(xε) remains close to γ0, and it perturbs below γ0 as ε increases. In (B), labeled manifolds and points indicate the ε = 0.1 case.
While this alignment of manifolds holds for small ε, recall that our reduced model is equivalent to system (9) with ε=1. As ε grows, higher order terms not accounted for in the Melnikov function could become significant. Thus, we use an alternative comparison approach to consider the effect of increasing ε and show that the direction of splitting is maintained for all ε up to 1. To do so, we show that the distance between and monotonically increases with ε; see the Appendix.
The results of this analysis show that for the reduced model, namely system (9) with ε = 1, there exists a compact region in phase space in which limb trajectories emerging from initial conditions at the onset of the eStance phase will be trapped in forward time. Indeed, the eStance critical point x1 = (q1, 0) of the reduced system has an unstable manifold Wu(x1), which evolves away from x1 in forward time, crosses through the q-axis from the positive v half-plane to the negative v half-plane, and then returns to the q-axis again, say at xu = (qu, 0). From the analysis above, we know that drive can be chosen such that γ0 exists, and we have q1 < qu for such drive. Let R denote the compact region bounded by the segment of the q-axis with q values between q1 and qu, x1 itself, and Wu(x1). Any trajectory starting from an eStance initial condition between x1 and xu in eStance is trapped in the interior of R for all time. There are no true critical points in the interior of R, nor could the flow of any of the continuous subsystems in the reduced model (3) reach any critical points inside R without first causing a phase transition that causes the point to become nonsingular. Thus, a stable periodic orbit must exist in R by a generalization of the Poincaré-Benixson Theorem applied to discontinuous systems [14, 15].
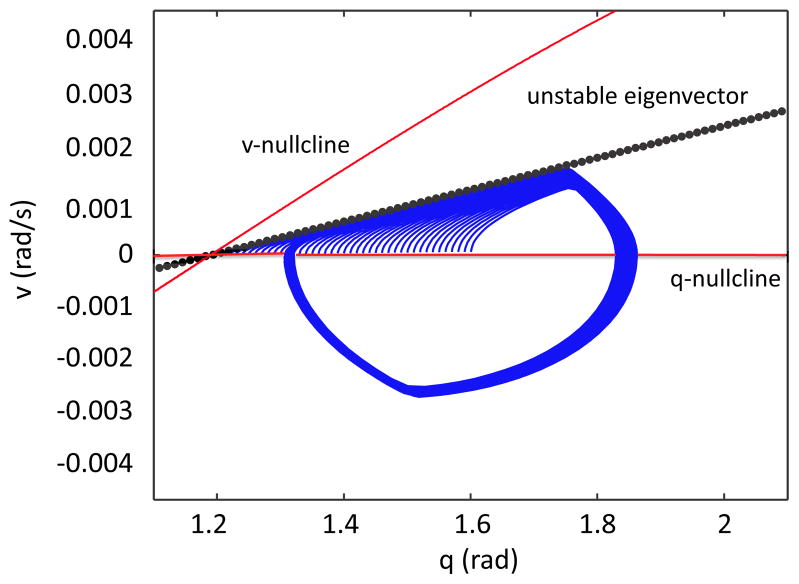
While this argument establishes that there exists at least one stable periodic orbit in region R, it does not prove uniqueness. In theory, other solutions could co-exist with the periodic one that we have analyzed, which could either compromise the relevance of the model or point to some unexpected locomotor phenomenon. A strong contraction exhibited in the eStance phase, however, indicates numerically that this periodic orbit is unique. Figure 6 shows that trajectories starting from a range of initial conditions on the q-axis are quickly attracted to the unstable manifold of the eStance saddle point, which is tangent to the unstable eigenvector of the eStance critical point x1 on the q-axis. In Section 4, we will see that the locations of this manifold and eStance v-nullcline are centrally important to the step phase asymmetry.
Figure 6.
Strong contraction to the unstable manifold of the eStance critical point suggests that the periodic orbit resulting from the Melnikov calculation is unique. The eStance limb nullclines are shown in red and the unstable eigenvector with a black dotted line. A set of eStance initial conditions on the q-axis quickly converge toward the unstable eigenvector of the critical point located where the v-nullcline intersects the q-axis.
3.3. Duration of eStance but not of other phases depends on initial condition and motoneuron strength in reduced model
Unlike the full model, the durations of the reduced model limb trajectories in each phase can be precisely determined because the motoneuron output to the limb in each phase is fixed. Given an initial condition located on a starting manifold for a phase (either the TTC, the WTC, or a segment on the q-axis), system (7) can be integrated up to the time when the solution reaches that phase’s ending manifold. For instance, the duration of the eSwing trajectory for a fixed drive can be found by setting the output of Mn - E equal to meSw and forward integrating from an initial condition lying on the WTC up until the time when the solution hits the q-axis.
This approach allows us to easily vary the initial entrance conditions to each phase, to see how phase duration is affected by strength of motoneuron output and position in phase space. We choose a wide range of initial conditions on the starting manifold for each phase in a neighborhood of where we see these transitions occurring in the original model (see Figure 1). Then, we increase the drive strength (in our reduced model, this means we update the value of {m}) and record the duration that a trajectory with given initial condition took from beginning to end of that phase. The difference in duration over the range of initial conditions and input strengths in fStance, fSwing, and eSwing is relatively small, with durations ranging over at most a few hundreds of milliseconds, compared to the eStance durations, which varied from roughly 200 ms to 2200 ms.
In particular, the eStance trajectories with the longest durations occurred for small drive values, where the initial conditions chosen lie close to the eStance critical point. In some cases, trajectories starting from certain initial conditions failed to enter the region of positive velocity entirely. The results of these simulations show that eStance phase duration depends strongly on drive. In the next section, we will return to the full model to analyze the source of this asymmetric dependence of phase duration on drive.
4. Fast transitions in segment dynamics reveal source of phase asymmetry
4.1. Limb nullclines are oriented differently in each phase
As noted in subsection 2.2, four important transitions occur in each step cycle that drastically change the limb dynamics. The mathematical analysis in the previous section adds to the evidence from [13] that the onset of eStance plays a particularly critical role in shaping the locomotor oscillations in the model. Building on this observation, we can now characterize the source of the phase asymmetry, which the reduced model indicates occurs in the eStance phase.
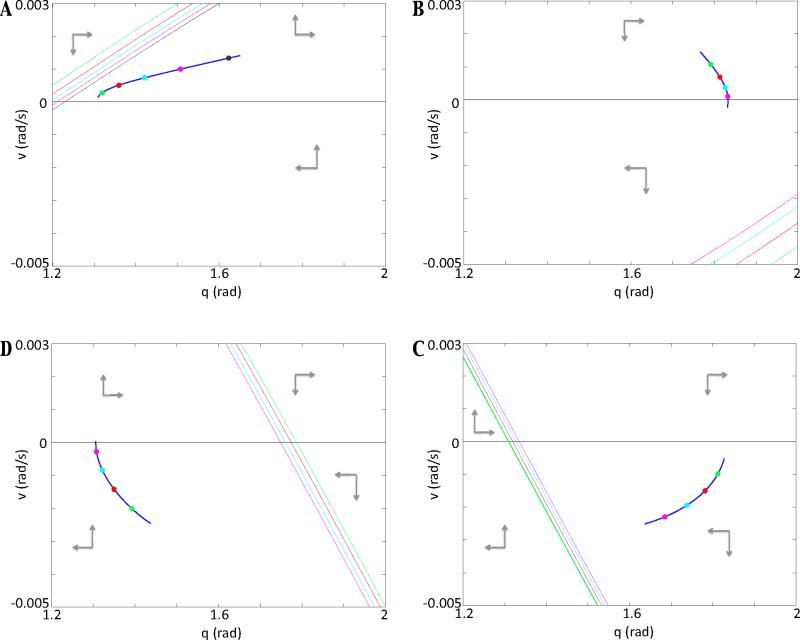
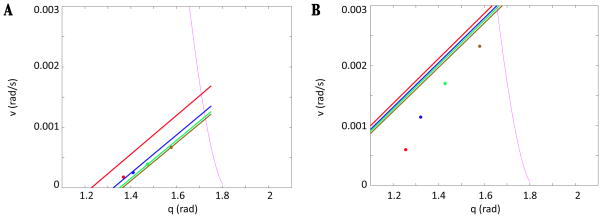
Consider the location of the q-nullcline, defined by the set of all (q, v) such that q̇ = v = 0, and the v-nullcline, the set of all (q, v) satisfying v̇ = 0, of equation (1), in the (q, v) plane. Figure 7 shows a segment of the limb trajectory selected within each of the four phases. In each phase, sample points on the trajectory are chosen and the corresponding v-nullclines at the associated timepoints are plotted, with colors used to indicate which points and nullclines go together. The eStance phase, illustrated in Figure 7A, features positively sloped v-nullclines, such that the trajectory is in close proximity to the nullcline at the onset of this phase. After the CPG changes dominance from E to F, the segment trajectory enters fStance (Figure 7B). Notice that the position of the v-nullcline is significantly altered due to the drastic change in motoneuron outputs, and hence in the right hand side of equation (7) at the transition from eStance to fStance. When the trajectory crosses the q-axis, the velocity of the segment changes sign and the segment enters the swing phase. The ground reaction force terminates at this transition, and the nullcline position in fSwing (Figure 7C) reflects this loss of force; the slope of the v-nullcline switches from positive to negative between these two phases. The final plot in Figure 7D exhibits the trajectory and nullclines in the eSwing phase. When the CPG changes dominance between these phases, the extensor motoneuron force term is activated (and the flexor motoneuron force term is deactivated), which is reflected in the altered nullcline position. In the following sections, we discuss in further detail the different dynamics in each phase and use these observations to explain how limb feedback creates the phase asymmetry evident in [13], Figure 3.
Figure 7.
The alignment of the limb trajectory relative to the v-nullcline depends on phase. (A), (B), (C), and (D) display structures in (q, v) phase space in the eStance, fStance, fSwing, and eSwing phase, respectively, with panel ordering selected to reflect the order in which the phases occur, progressing clockwise. In each, the q-nullcline, which is the q-axis, is shown in black. A portion of the trajectory is plotted in blue, with different colored time points highlighted, and the same color is used for each corresponding v-nullcline, since the v-nullcline changes position over time as the output of the active motoneuron changes. Note that the v-nullcline positions differ drastically between phases, due to dominance switching in the CPG and the influence of ground contact.
4.2. eStance Dynamics
At the start of eStance, the ground reaction force initiates, which causes the v-nullcline to assume the orientation seen in Figure 7A. This configuration has a crucial effect on the activity of the system. We note that increased drive corresponds to larger Mn - E output, which raises the v-nullcline. For smaller drives, and hence smaller Mn - E output, the v-nullcline is lower, and the critical point it forms with the q-nullcline lies extremely close to where the trajectory enters this phase. What is more, initially v̇ > 0 and the v-nullcline moves down because Mn - E output decreases over the course of eStance.
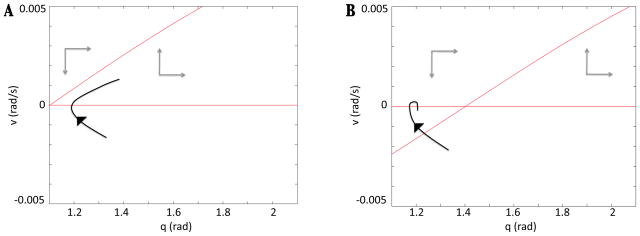
This relationship is important for three reasons. The first involves the ability of the model to produce oscillations. If a trajectory enters the eStance phase to the left of the v-nullcline, the dynamics in that region will prevent it from completing the eStance phase. Indeed, to the left of the v-nullcline, the eStance direction field points down towards the q-axis, and the eSwing direction field points up towards it. Thus, the limb remains pinned at the q-axis, which interrupts oscillations. This effect is the reason why both the original and reduced models fail to produce oscillations for small drives. If we track a limb trajectory generated by the full model with sufficiently small drive and corresponding small Mn - E output, from an initial condition on the q-axis to the right of the v-nullcline at the start of eStance, the trajectory will progress through eStance, fStance, fSwing and eSwing and then will leave eSwing and return to eStance to the left of the v-nullcline. In terms of the calculations in the previous section, the Melnikov function would be positive for such drive values. A schematic illustration of this oscillation failure mechanism is shown in Figure 8.
Figure 8.
Schematic illustration of the possible relationships the eStance v-nullcline can have with the limb trajectory at the onset of eStance. (A) The limb trajectory moves up and to the right through phase space when it enters eStance to the right of the eStance v-nullcline. (B) To the left of the v-nullcline, the vector field points down and to the right. Thus, the limb cannot proceed if it tries to enter eStance to the left of the eStance v-nullcline.
The second reason that this positioning is important is that it is the key feature in establishing the phase asymmetry. The time of passage for a trajectory to exit the neighborhood of a saddle point from an initial condition within that neighborhood becomes arbitrarily large as the initial condition approaches the saddle point. Furthermore, the position of the v-nullcline bounds the growth in v even when the trajectory moves away from the critical point, slowing the rate at which the limb can access higher velocities, reach the TTC, and exit the eStance phase. As drive is increased, however, the nullcline is lifted away from the location of eStance onset, and thus the influence it has on the timing of this phase will be minimal. Therefore, the duration of eStance can vary significantly with changes in drive. This crucial relationship of the orientations of the trajectory and the v-nullcline does not exist in the other phases (Figure 7B-D). The presence of ground reaction force creates a unique trajectory/nullcline alignment that opposes an increase of acceleration, which is essential to the asymmetric phase response to changes in drive. We note that changing the strength of the feedback in the model, particularly the Ib - E feedback term, can also scale the extent of the asymmetry in phase durations, again by altering the trajectory/nullcline alignment as discussed in [13].
The third role played by the configuration of the trajectory relative to the v-nullcline at the onset of the eStance phase is that this configuration yields the strong contraction of trajectories from different initial conditions on the q-axis observed in eStance in Section 3.2; see Figure 6. This contraction results because near eStance onset, but away from the v-nullcline, dv/dq = v̇/q̇ = v̇/v is very large, since v is near 0 and v̇ is not. Thus, trajectories entering eStance away from the eStance critical point are all funneled strongly upward, toward the v-nullcline, until v̇ and v become closer in size.
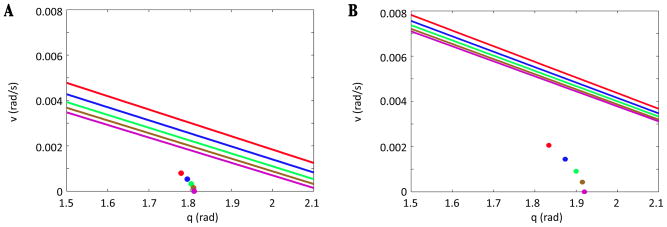
One final observation, which we exhibited for the reduced system in Section 3.2, involves the presence of an unstable manifold that lies in the eStance domain. Linearizing around the critical point of system 1 at fixed values of Mn - E indicates that the critical point in eStance is a saddle. The unstable eigenvector has a positive slope and lies between the q-axis and the v-nullcline, and near the critical point, it lies tangent to the unstable manifold. For simplicity, and because we saw how the unstable eigenvector remains a good approximation of the manifold throughout the eStance phase in the reduced case, we use the unstable eigenvector, rather than the actual unstable manifold, in the following figures. As Mn - E changes, the v-nullcline and critical point shift, and hence, so does the location of the unstable eigenvector. Figure 9 exhibits a family of eigenvector and limb trajectory locations in (q, v) space with corresponding colors for various timepoints throughout this phase. For small drives, since the trajectory enters the eStance phase close to the critical point, the trajectory quickly converges to the unstable eigenvector, as discussed above. For larger drives, the eigenvector, like the nullcline, is lifted away from the trajectory at eStance onset. The trajectory flows toward this manifold as it travels through eStance, until it crosses the TTC at higher velocities than were reached in the small drive case. Thus the location of intersection between the unstable eigenvector and the TTC plays a role in where the limb will begin the fStance phase. We will see in the next subsection that this entry location plays a important role in phase completion.
Figure 9.
The location of the unstable eStance eigenvector determines the position where the limb trajectory crosses the TTC. Colored stars on the limb trajectory are plotted at various time points with their corresponding unstable eigenvector. The TTC is shown in magenta. (A) For a small drive value, hence, small Mn - E output, the unstable eigenvector lies at low velocities, and the trajectory lies very close to these eigenvectors until it crosses through the TTC. (B) For a large drive value, hence, large Mn - E output, the unstable eigenvector is far from the initial position the trajectory takes in eStance. The trajectory is pulled upwards toward the eigenvector and thus crosses the TTC at a higher velocity than in the small drive case.
4.3. fStance Dynamics
As in the eStance phase, critical points computed at specific time points in fStance are saddle points. In fStance, however, the critical point is on the exit manifold (the q-axis) of the phase, not the entrance manifold (the TTC), and thus there is no risk that the trajectory will be delayed at the onset of the fStance phase. The stable eigenvector corresponding to the fStance saddle point for each Mn - F output slices through the fStance region of (q, v) phase space. Figure 10 shows a collection of these eigenvectors, signifying their movement over time as changing Mn - F output alters the position of the critical point and v-nullcline. If a trajectory entered fStance above the stable manifold, it would continue to travel above and along the manifold toward the q-axis. Before it could reach the axis, however, it would have to cross the fStance v-nullcline, and v̇ would change from negative to positive. Thus, the trajectory would move in a direction of increasing v and increasing q, remaining forever bounded away from the q-axis and hence unable to complete a transition to the fSwing phase. In addition, if the trajectory entered the fStance below, but sufficiently close to the stable manifold, that trajectory could still complete the fStance phase, but be significantly slowed before reaching the q-axis, yielding a very long fStance duration.
Figure 10.
The positions of the stable eigenvectors and the limb trajectory change with drive strength. (A) Small drive leads to small Mn - F output and stable eigenvectors that lie in a region of small positive velocity, but the limb trajectory enters this phase far below them. (B) Large drive, with large Mn - F output, yields stable eigenvectors shifted farther upward than in (A), such that trajectories with larger initial fStance velocities still lie below them. Time points on the limb trajectory are shown with stars, while the color-coordinated lines are the corresponding stable eigenvectors.
However, as discussed in the previous subsection, the limb trajectory travels throughout the eStance phase tracking close to, but below, the unstable manifold, which lies well below the fStance stable manifold. Indeed, although the eStance unstable eigenvector crosses the TTC with larger v for larger drives, the stable eigenvectors in fStance in the large drive case (Figure 10B) are also shifted farther upward than the eigenvectors in the small drive case (Figure 10A), allowing completion of the fStance phase despite larger initial velocities. Thus, the limb is bounded away from the fStance stable manifold, and hence is able to complete the fStance phase with timing that is not influenced by the saddle point.
In subsection 4.6, we shall verify numerically that the fStance initial conditions, influenced by the contraction in the eStance phase, keeps the fStance phase durations relatively independent of drive strength despite these possible complications.
4.4. fSwing Dynamics
Unlike the stance phases, the critical point for the fSwing vector field is a stable spiral. In this case, v-nullcline proximity to the trajectory does not greatly impact the trajectory of the limb. Indeed, if Mn - F output is sufficiently weak, the trajectory could cross through the v-nullcline, which would change the dynamics from decreasing to increasing velocity. Even with such a change, however, the trajectory would continue to approach the WTC and make the transition to the eSwing phase, and oscillatory activity would not be compromised.
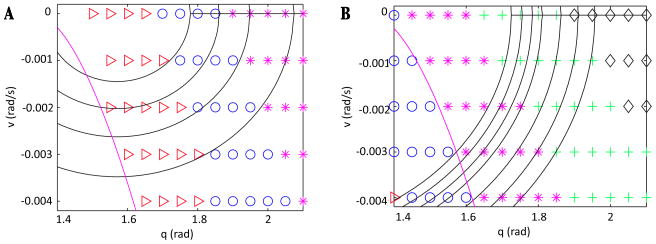
To investigate why the duration of the fSwing phase remains independent of drive changes, we evaluated v̇ over a range of q and v values for two choices of Mn - F, shown in Figure 11. Figure 1 exhibits the range of initial conditions for this phase obtained by model simulations as drive is increased, which lie on the q-axis between 1.8 and 1.95. As exhibited in that figure, we have argued that as drive increases, the oscillation trajectory enters fSwing at a larger q, and thus larger Mn - F corresponds to oscillations with larger amplitudes than those resulting from small drive simulations. Thus, the trajectory must travel a farther distance to the WTC than would a smaller drive trajectory. But, since the larger drive trajectory initial condition has a larger q-component and hence yields a larger value of K cos(q), as well as a larger Mn - F, |v̇| becomes larger as drive is increased, and the necessary distance in q can be covered more quickly. On the other hand, the velocity that a large drive trajectory can achieve cannot become extremely large relative to the velocity of a small drive trajectory. Suppose that the muscle force is relatively constant, say with a value M̂, and consider the function L̂ = v2/2 − K/I sin(q) − M̂/Iq. The level curves of this function (L̂ = constant) are curves in phase space that have a curvature that is similar to the shape of the trajectories in this phase (see Figure 11). As this constant decreases, the level curves lie closer to the q-axis. Notice that the function L has a time derivative dL̂/dt = vv̇ − K/I cos(q)q̇ − M̂q̇ = −bv2/I. Since dL̂/dt is negative, solutions to system (1) travel in the direction of lower L̂, i.e. toward the q-axis. Thus, the level curve on which a trajectory begins the fSwing phase provides a lower bound for the path of that trajectory in phase space, under the assumption that MF remains relatively constant during fStance, which holds as long as the right branch of the Mn - F voltage nullcline is not strongly sloped. Even for a very negative M̂, corresponding to a large drive and Mn - F output, the trajectory enters fSwing on a level set that crosses the WTC with velocity larger than −0.005, and thus is bounded away from very negative velocities (Figure 11). Hence, large drive trajectories cannot move significantly faster than slowly driven trajectories.
Figure 11.
v̇ values at sample (q, v) points and level sets of L in the fSwing phase for small Mn - F (A) and large Mn - F (B). In both plots, black diamonds, green plus signs, magenta stars, blue circles, and red arrows correspond to v̇ values within (+/−) 5e-6 of −5e-5, −4e-5, −3e-5, −2e-5, and −1e-5, respectively. Level curves of L̂ are plotted in black, with smaller L̂ values closer to the q-axis, and the WTC is plotted in magenta. Initial conditions for this phase lie on the q-axis with varying angle. For the drive shown in (A), the oscillation trajectory would begin fStance closer to the WTC but travel more slowly than in (B), where the trajectory would enter fStance at a larger angle but travel faster. For constant Mn - F output, trajectories move in the direction of decreasing L̂.
4.5. eSwing Dynamics
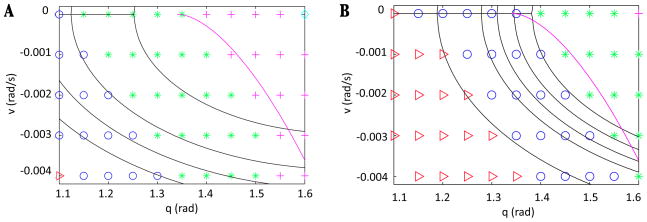
As in fSwing, the critical point in the eSwing system is a stable spiral. We did a similar investigation of the strength of v̇ over the eSwing domain. Figure 1 exhibits the initial entrance conditions to this phase, which are shifted slightly from the WTC. The vector field varies very little as Mn - E is increased, and again, the larger amplitude oscillations that occur for larger drives need to travel a larger distance to complete the phase (from a more negative v up to v = 0) but do so faster because they travel through regions with larger v̇; see Figure 12. Recall that the relationship between where the trajectory exits eSwing and the location of the eStance critical point is crucial for the allowing limb motion to continue. There are two factors that ensure that these points maintain the necessary relationship for oscillatory behavior to be continued as drive is increased. The first is that for larger drives, the motoneuron output is larger, and thus the eStance v-nullcline is higher, with a critical point whose angle is much smaller. In addition, for larger drives, the eSwing trajectory travels on level sets of a function that have a steeper slope than in the small drive case. Again, if the muscle force is relatively constant, corresponding to little change in Mn - E output while it is active, say with a value M̄, then the function L̄= v2/2 − K/I sin(q) − M̄/Iq, has time derivative dL̄/dt = −bv2/I. So limb trajectories travel in the direction of lower L̄, which occurs closer to the q-axis. For larger M̄, the slope of these levels sets is much steeper, so although trajectories start farther from the q-axis (and hence, could travel to very low q values since q̇ = v), they are constrained by steeper level sets of L̄, which ensures that trajectories exit the eSwing phase to the right of the eStance critical point.
Figure 12.
v̇ values for a sample of (q, v) points and level curves in the eSwing phase for small Mn - E (A) and large Mn - E (B). Magenta plus signs, green stars, blue circles, and red diamonds correspond to v̇ values within (+/−) 5e-6 of 1e-5, 2e-5, 3e-5, 4e-5, and 5e-5, respectively. Level curves of L̄ are plotted in black and the WTC is plotted in magenta. Ignoring the transient, trajectories enter this phase on the WTC. In (A), trajectories begin closer to the q-axis but travel more slowly than in (B), where trajectories begin farther from the q axis, but travel faster. The slope of the level curves becomes steeper as drive increases; thus, there is a bound on how small the q values reached by large drive trajectories can be.
4.6. eStance is the sole contributor to the phase asymmetry, due to the presence of ground reaction force
Now that we have fully described the dynamics in each phase, we verify that the asymmetry is almost completely confined to the eStance phase, not to the stance phase in its entirety, as shown numerically in Figure 13.
Figure 13.
Durations of each of the four subphases are plotted against drive strength. The duration of eStance is shown in blue, fStance in black, fSwing in green, and eSwing in red. The phase asymmetry shown in [13] Figure 3 is almost entirely restricted to the eStance phase, due to the unique nullcline/trajectory alignment that occurs for small drive values.
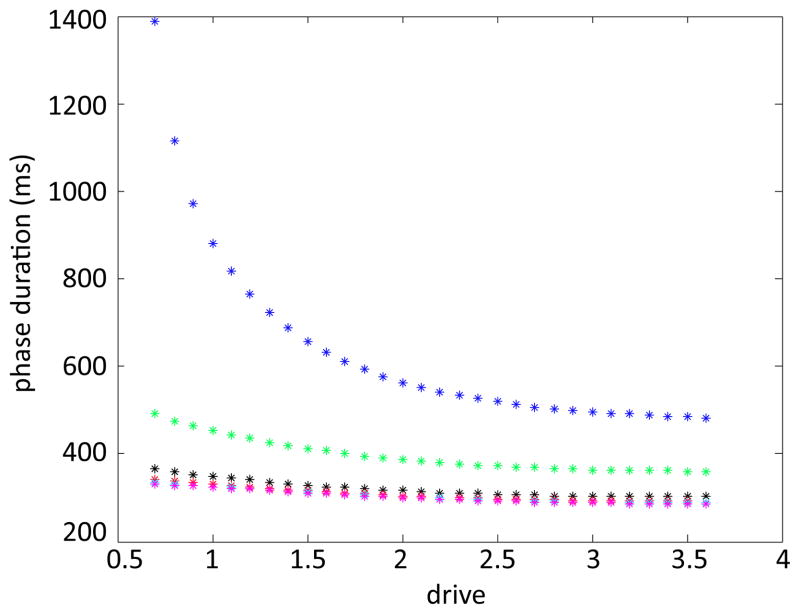
In Figure 14 we investigate the influence of ground force magnitude to further emphasize the role that the ground strike force plays in the asymmetric response to drive variation. We simulated the dynamics of the system with full, half, and no ground reaction force over a range of drives and recorded the durations of the swing and stance phases. As the magnitude of the ground reaction force term is decreased, the v-nullcline in the eStance phase loses its positive slope and becomes oriented similarly to the eSwing v-nullcline. Thus by reducing the size of the ground reaction force, we eliminate the nullcline-trajectory alignment at the start of eStance. This alteration removes the drive-dependence of the stance duration, with no effect on swing, and verifies our claim that the presence of ground reaction force opposes an increase in acceleration at the onset of stance, and is essential to set up conditions under which the presence of feedback can generate the asymmetric phase response to changes in drive. The results of this simulation match up well with data from experimental studies where human locomotion with reduced weight was investigated using body unloading. The duty cycle, that is, the ratio of stance duration to cycle duration, decreased as body weight support was increased [16, 17], and in air stepping, when the body was 100% supported, the stance duration did not change significantly with increases in speed [16].
Figure 14.
Stance and swing durations for various ground reaction force magnitudes (MGRmax) are plotted against drive. The stance durations for full, half, and no GRF are plotted in blue, green, and black, respectively. The swing durations are plotted in red, cyan, and magenta and the resulting curves lie on top of each other. By reducing the impact of the ground strike force, the dependence of stance duration on drive (upper curves) is lost. The swing durations (lower curves) remain unaffected by this change.
5. Discussion
The main goal of this work was to explain the details underlying the asymmetric response of oscillatory solutions of a neuromechanical model of locomotion [10] to changes in drive strength, which agrees with biological observations [11, 12]. The mathematical analysis of the existence of these solutions served as a very useful step in achieving this aim. The relatively complicated nature of the model led us to reduce the model into a qualitatively consistent form more amenable to dynamical systems analysis (2), which required us to determine which model features could be simplified, and in what way, without compromising model dynamics (see also [13]). Given the reduced model, the construction of an existence proof required a detailed exploration of how various model components affect its dynamics. In particular, this investigation led us to an appreciation of the central importance of the limb phase plane, and especially of the differences in nullcline structure within this phase plane across different locomotor phases, for understanding solution behavior. More generally, mathematical analysis of existence, stability, and uniqueness for a biologically observed solution helps verify the relevance of the model that generates this solution, establish the constraints on parameters under which the model is valid, and identify other solutions or changes in solution features that may be expected under certain conditions. Our particular existence and stability argument relied on Melnikov’s method and the Poincaré-Bendixson theorem, adapted for the discontinuities occurring at phase transitions in the model, combined with a few numerical calculations.
Our existence result required the assumption that a certain closed orbit could be constructed when the motoneuron output function was assumed to be piecewise constant, with values satisfying certain constraints that are discussed in detail within the paper, and we observed that this assumption holds as long as the supra-spinal drive in the model is not too small. We also found a strong contraction among trajectories within the eStance phase, which appears to yield uniqueness of the periodic solution. In Section 4, we elucidate the crucial role of the limb dynamics in generating the phase asymmetry exhibited by the full model and used an array of arguments to explain why only the eStance phase of the step cycle has a duration that depends on the value of the supra-spinal drive to the CPG. More specifically, we find that the inclusion of the ground reaction force in the model is essential for allowing the phase asymmetry to develop, while the strength of the feedback (particularly the Ib - E feedback term) in the model scales the intensity of this asymmetry (see also [13]). Interestingly, the same mechanisms that yield contraction in the eStance phase were identified as being responsible for the sensitivity of the phase duration to the drive strength there.
Many other theoretical works have considered coupled CPG and mechanical limb components in the context of locomotion, including the roles of feedforward CPG outputs and movement-related feedback to the CPG (see e.g. [18] and references therein). Several studies have analyzed resonance and entrainment in relatively simple models, considering the CPG and limb as having intrinsic frequencies (associated with damped oscillations to rest in the latter case) and investigating how the two interact to set a frequency for oscillations in the full network [19, 20, 21, 22]. Our analysis breaks the network oscillation into four phases. Within stance or swing, transitions between extensor and flexor control occur at the CPG level, depending on the time course of afferent feedback. These CPG transitions cause jumps in the vector field for the limb dynamics, which in turn enable limb velocity to switch sign and lead to transitions between stance and swing phases, with associated alterations in feedback signals. Thus, we see that control of each phase transition is directly impacted by one particular component of the model, the CPG or the muscle-driven limb, yet that component is influenced by the activity of the other. This analysis provides a more nuanced view that emphasizes phase transitions, perhaps somewhat reminiscent of Cruse’s behavioral rules for limb coordination [23], and yields insights into why oscillations exist in the model, how they can be lost as parameters vary, and how phase durations are determined.
Our results are consistent with past work in which a genetic algorithm was applied to evolve a set of model CPG networks, each composed of three, four, or five recurrently-connected neurons, controlling the activity of a simulated leg of an insect-like body [24, 25, 26]. The passage of a solution trajectory close to a fold of a steady state input-output curve was found to elongate the duration of the stance phase, resembling the dynamics exhibited at the onset of the eStance phase in our model. Interestingly, the model correspondingly exhibited a high sensitivity to perturbations near this region [25], similar to the dynamics exhibited at the onset of the eStance phase in our model. Indeed, the dynamic mechanisms that we have uncovered also predict such a sensitivity, along with several other expected outcomes relating to step failure and responses to disturbances, especially at relatively low drive levels. Specifically, a kick that slightly decreased limb angle late in the eSwing phase, when the limb speed is small, could terminate oscillations if it caused the trajectory to enter the eStance phase to the left of the eStance critical point. Similarly, a perturbation in the direction of larger limb velocity arriving in the fStance phase might push the trajectory above the stable manifold of the fStance critical point, which would prevent it from completing that phase, or might lead to very long fStance durations, if it pushed the trajectory very close to the stable manifold. Swing phase durations should be less sensitive to perturbations, on the other hand. These ideas are also related to past numerical simulations of a qualitatively similar but more simplified model, which showed that combined feedforward and feedback signaling yields an overall improved robustness to unexpected disturbances and imperfect sensory information, relative to pure feedback or feedforward control, although differences across phases were not emphasized there [27].
The analysis that we have done stands apart from past mathematical work on related models in that the model that we consider was generated to reproduce a variety of qualitative and quantitative experimental observations, and as such was not tailored to provide ease in analysis. Indeed, we saw that despite the relative simplicity of the model, its dynamic inhibition, excitation, and nonlinear feedback components presented challenges that complicated our analysis, and these features also prevented the application of additional analytical techniques, such as phase response curves (e.g., [28]). However, we were able to utilize variations of many familiar arguments from the realm of dynamical systems, in spite of this complexity. In addition, this analysis provides the first explanation at the level of dynamic mechanisms of how the presence of a biologically constrained feedback can alter the output of a symmetric CPG to create an asymmetric variation in step phase durations as the value of supra-spinal drive, and hence locomotor speed, is increased [12, 10].
Many past works support the hypothesis that the spinal locomotor CPG features a symmetric organization [5, 6, 7, 29, 9], such that the asymmetric response would require other sources such as feedback asymmetries. However, other authors argue that the CPG itself is a source of asymmetry [30]. Asymmetry within a model CPG emerged from a numerical optimization procedure tuned to fit parameters to the asymmetric phase response data [12, 31], and asymmetries allowed a model CPG to fit disordered limb coordination data from Parkinson’s disease patient [32], but these results were inevitable, since the models involved did not include possible sources of asymmetry outside of the CPG, such as feedback [32, 31]. An interesting future direction would be to repeat these studies in a neuromechanical model, such that the relative capabilities of different possible asymmetry sources could be compared. Biologically, sources of locomotor asymmetry may vary across species or even across behavioral or environmental contexts, and in fact there may be multiple asymmetries within a single locomotor network. Interestingly, the ground reaction force, which is present during stance but not during swing, imposes an intrinsic asymmetry on the mechanical component of the system, which we find to be crucial in constraining the range of drives over which oscillations can occur and in eliciting the phase response asymmetry. Additional work on locomotion with afferent feedback intact, but without a ground reaction force, could help tease apart relevant mechanical effects, and treadmill walking, in which the system’s response to an imposed frequency is assessed, should also be considered.
Acknowledgments
The authors received grant support from NSF awards DMS0716936, DMS1021701, and EMSW21-RTG0739261 and NIH awards EB012855, HD32571, and NS048844. We thank Amit Bose and Sergiy Yakovenko for some interesting discussions that occurred while this work was in its final stages.
6. Appendix
In this Appendix, we provide details of certain steps in our proof of the existence of periodic solutions to system (9) for ε ∈ (0, 1], and hence to our reduced system (7), corresponding to the case of ε = 1. The values of certain parameters are relevant in our arguments, namely K=441.45, b=18000, MGRmax=585, and I=9000000.
6.1. Existence of saddle points
First, we check that for each ε ∈ (0, 1], system (7) has a critical point xε = (qε, 0) that is a saddle, converging to x0 as ε → 0+. For each ε, such a critical point exists if there is a solution q to
| (11) |
Since the critical point x0 = (q0, 0) exists with ε = 0, we can write . Substituting this expression back into equation (11) and dividing on top and bottom by (K − MGRmax), we obtain
| (12) |
for N(q) = ME(q, 0, meSt)/(K − MGRmax). The quantity in the denominator of (12) is positive for ε = 0 and q = q0, but N (q0) is itself negative, since K − MGRmax is negative while ME is positive. If we increase q from q0, which lies between 0 and π/2, then the numerator of (12) grows from 0 while ME(q) is observed numerically to grow as well. Hence, the denominator of the right side of equation (12) becomes less positive, and eventually it crosses through 0 for some q < π/2. Thus, the right hand side expression blows up to ∞ and in particular it increases past 1, which implies that there is a solution qε to equation (11) for each ε ∈ (0, 1], as desired.
Next, we check that xε = (qε, 0) is a saddle point for all ε ∈ (0, 1]. For a two dimensional system of ordinary differential equations, a critical point is a saddle provided that the determinant of the linearization at that point is negative. Linearizing system (9) yields a matrix with determinant . The coefficient of the sine term is always negative and, as we just used to establish the existence of the critical points, numerical results show that is positive for q ≤ π/2. Thus, the critical points xε are indeed saddle points.
6.2. Constant muscle force moments to ensure that the Melnikov function satisfies
 (t0) < 0
The Melnikov function that we consider is defined in equation (8). To guarantee that the invariant manifolds of xε have the alignment that implies the existence of solutions for ε > 0 small, we aim to establish that
 (t0) < 0. As we described above, a sufficient condition is to choose {M*} so that the integrand of
 is negative in each phase. During the stance phase, v is positive, so we wish to choose
larger than ME(q, v, meSt) in eStance and
larger than MF(q, v, mfSt) in fStance. During eSwing and fSwing, we would like to make the opposite choice, setting
smaller than ME(q, v, meSw) in eSwing and
smaller than MF(q, v, mfSw) in fSwing, since v is negative during these phases.
To determine whether making such a choice is possible, we require knowledge of the values that MF and ME take in phase space. Specifically, we need to find the maximum of ME in eStance and MF in fStance, and the minimum of MF in fSwing and ME in eSwing. We could run into a circular argument here, because the values of ME and MF for ε ∈ (0, 1) depend on the system trajectory, which depends on {M*}. However, by differentiating the relevant equations, one can show directly that dME/dv ≤ 0 in eStance and eSwing, and dMF/dv ≤ 0 in fStance and fSwing. Thus, the maximum value of ME in eStance and MF in fStance, and the minimum value of MF in fSwing and ME in eSwing, all occur when v = 0.
Therefore, to obtain bounds on their possible values, we only need to evaluate ME and MF over q values between 0 and π, which are constraints built into the model, with v = 0. The maximum of ME for the eStance vector field occurs near π/2 and is equal to 58.11. The maximum of MF for fStance occurs at the upper boundary at π and is equal to 0. The minimum of MF for fSwing occurs near π/2 and is equal to −101.67. The minimum of ME for eSwing occurs at 0 and is equal to 0.
In light of these results, we choose and , and we restrict our possible range of to consist of negative values. The bound in fStance is poor since MF needs to be sufficiently negative in order for the trajectory to reach the q-axis to complete the fStance phase. That is, while would be needed to satisfy , this choice would prevent us from constructing the homoclinic we desire in system (9) with ε = 0. We show in our analysis that any trajectory that completes the fStance phase and intersects the q-axis must remain at angles below the angle associated with the critical point of system (9) during its passage through fStance. Thus, we would like to use the angle of the fStance critical point for system 9 to provide a better bound for MF. Note, however, that the fStance critical point satisfies
| (13) |
a relationship that depends on the choice of .
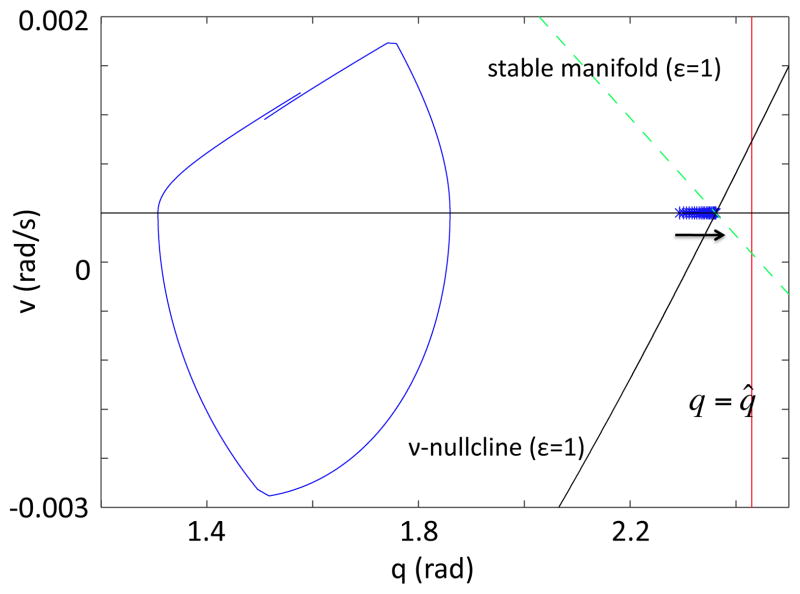
To avoid circularity, we proceed in the following way. We fix an angle q̂ and determine MF (q̂, 0, mfSt). We choose this value, call it M̂F, and use it in place of in the fStance form of system (9) to compute the q-value of the fStance critical point as ε varies between 0 and 1. We check that the angle associated with each of these critical points is less than q̂, and thus we conclude that the trajectories of (9) with maintain q < q̂ throughout fStance. Since MF (q, v) attains its maximum at v = 0 for each fixed q, and since MF (q, 0) is a increasing function of q, we can use M̂F as an upper bound for MF (q, q̇, mfSt) in system (9) for all ε. The particular q̂ we chose satisfied MF (q̂, 0, mfSt) = −94.7, which allows us to choose any See Figure 15 for an illustration of these relationships.
Figure 15.
Relationship between the critical points for system (9) and the angle upper bound, q̂. The critical points are plotted as blue asterisks on {v = 0} with an arrow indicating the trend in their location as ε increases, and the line {q = q̂} is indicated in red. The q and v-nullclines are plotted as black solid lines, and the stable manifold is a green dashed line for the ε = 1 system; these intersect in the rightmost critical point. For reference, the limit cycle for the ε = 1 system is plotted. In order to transition to the fSwing phase, the q-values on the limit cycle in fStance must be bounded above by the q-coordinates of the fStance critical point. q̂ was chosen as an upper bound of these bounds, so that M̂F is an upper bound of MF (q, v, mfSt).
6.3. Splitting of manifolds persists up to ε = 1
The Melnikov analysis in Section 3 establishes that for ε > 0 sufficiently small, the unstable manifold Wu(xε) is trapped inside of the invariant curve W̃s(xε), as desired. This alignment corresponds to the inequality , which refers to the relative positions of the intersections of these manifolds with the transversal Σ. We would like to show that this alignment is preserved as ε ↑ 1. A sufficient condition for this result is that that for ε1 ≤ ε2, and both hold, so we now try to establish these inequalities.
We have already established that the q-coordinates of the critical points xε2 and xε1 satisfy qε2 > qε1 for ε2 > ε1, so that Wu(xε2) lies to the right of Wu(xε1) in a neighborhood of xε1 and xε2 for ε2 > ε1. Moreover, we can see that this orientation is preserved for the duration of the eStance phase. Indeed, if the two manifolds were ever to touch, as would have to occur to allow qε2(t) < qε1(t) to result, then q̇2 = q̇1, and then 0 ≤ v̇2 ≤ v̇1, since . Because we have chosen to exceed the largest possible value that ME(q, v, meSt) could take along a relevant trajectory of system (9) in eStance, we know that this expression is negative. Thus, v̇2 < v̇1 at the intersection point, and Wu(xε2) remains on the inside of Wu(xε1).
Assuming that the trajectories do not cross during the brief transient between the crossing of the TTC and the switch to the fStance phase, then Wu(xε1) is above Wu(xε2) at the onset of fStance. This initial alignment in fact ensures that the manifolds do not cross in the fStance phase. Again, if they were ever to touch, then q̇2 = q̇1, and thus v̇2 ≤ v̇1 ≤ 0, since . Therefore, Wu(xε1) lies to the right of Wu(xε2) at the end of fStance and, equivalently, at the start of the fSwing phase. Now, if the manifolds were ever to touch in this phase, then 0 ≥ v̇2 ≥ v̇1 since . Thus, Wu(xε1) remains outside of Wu(xε2) i.e. , and we have obtained the first condition that we seek.
We next consider the backward flow in eSwing. W̃s(xε1) lies to the left of W̃s(xε2) in a neighborhood of xε1 and xε2 for ε1, ε2. sufficiently close to each other with ε2 > ε1. If W̃s(xε2) and W̃s(xε1) intersect, then q̇1 = q̇2 and , which is less than 0 since ε1 − ε2 is negative and is positive by construction. Thus, they move through each other and cannot cross each other again, and therefore , as desired.
If they do not cross, then they still must traverse an interval of common q values to reach Σ. For each fixed q obtained by both W̃s(xε2) and W̃s(xε1), in the absence of a crossing, 0 > v2 > v1. For system (9),
| (14) |
which is the sum of three negative terms over the range of q values traversed in eSwing and hence is negative. Moreover, the only v-dependence in the right hand side of equation (14) occurs in the denominators of the first and third terms and in MeSw. Thus, if we compare the right hand side of equation (14) at (q, v2) with ε = ε2 versus a baseline of (q, v1) with ε = ε1, we see that the first term becomes more negative, the second term does not change, and the third term also becomes more negative (using a calculation based on the form of MeSw given in the Appendix of [13], for which we omit details). Thus, while W̃s(xε2) lies above W̃s(xε1), the distance between these curves shrinks over the entire range of q values that both traverse, since the former exhibits a larger decrease in v for each such q.
In summary, for any ε1, ε2 ∈ (0, 1] with ε2 > ε1, we have . If ε1 is sufficiently small, then , by our Melnikov calculation. Thus, we have shown analytically that stays above for some range of small ε. We have also shown rigorously that for any ε1, ε2 ∈ (0, 1] with ε2 > ε1, if W̃s(ε2) and W̃(ε1) cross during the backwards flow of eSwing. Finally, we have an argument indicating why ends up being small, even if no crossing occurs. While we do not have a rigorous bound on , these arguments explain why the ordering of and is preserved as ε increases up to 1, as desired.
References
- 1.Brown TG. The intrinsic factors in the act of progression in the mammal. Proceedings of the Royal Society of London. Series B, Containing Papers of a Biological Character. 1911;84(572):308–319. [Google Scholar]
- 2.Brown TG. On the nature of the fundamental activity of the nervous centres; together with an analysis of the conditioning of rhythmic activity in progression, and a theory of the evolution of function in the nervous system. J Physiol. 1914;48(1):18. doi: 10.1113/jphysiol.1914.sp001646. [DOI] [PMC free article] [PubMed] [Google Scholar]
- 3.Jankowska E, Jukes MGM, Lund S, Lundberg A. The effect of dopa on the spinal cord 6. half-centre organization of interneurones transmitting effects from the flexor reflex afferents. Acta Physiol Scand. 1967;70(3–4):389–402. doi: 10.1111/j.1748-1716.1967.tb03637.x. [DOI] [PubMed] [Google Scholar]
- 4.Lundberg JANM, ”Anggård A, Fahrenkrug Jan. Complementary role of vasoactive intestinal polypeptide (vip) and acetylcholine for cat submandibular gland blood flow and secretion i. vip release. Acta Physiol Scand. 1981;113(3):317–327. doi: 10.1111/j.1748-1716.1981.tb06902.x. [DOI] [PubMed] [Google Scholar]
- 5.Lafreniere-Roula M, McCrea DA. Deletions of rhythmic motoneuron activity during fictive locomotion and scratch provide clues to the organization of the mammalian central pattern generator. J Neurophysiol. 2005;94(2):1120. doi: 10.1152/jn.00216.2005. [DOI] [PubMed] [Google Scholar]
- 6.Yakovenko S, McCrea DA, Stecina K, Prochazka A. Control of locomotor cycle durations. J Neurophysiol. 2005;94(2):1057. doi: 10.1152/jn.00991.2004. [DOI] [PubMed] [Google Scholar]
- 7.Rybak IA, Stecina K, Shevtsova NA, McCrea DA. Modelling spinal circuitry involved in locomotor pattern generation: insights from the effects of afferent stimulation. J Physiol. 2006;577(2):641. doi: 10.1113/jphysiol.2006.118711. [DOI] [PMC free article] [PubMed] [Google Scholar]
- 8.Rybak IA, Shevtsova NA, Lafreniere-Roula M, McCrea DA. Modelling spinal circuitry involved in locomotor pattern generation: insights from deletions during fictive locomotion. J Physiol. 2006;577(2):617–639. doi: 10.1113/jphysiol.2006.118703. [DOI] [PMC free article] [PubMed] [Google Scholar]
- 9.McCrea DA, Rybak IA. Modeling the mammalian locomotor cpg: insights from mistakes and perturbations. Prog Brain Res. 2007;165:235–253. doi: 10.1016/S0079-6123(06)65015-2. [DOI] [PMC free article] [PubMed] [Google Scholar]
- 10.Markin SN, Klishko AN, Shevtsova NA, Lemay MA, Prilutsky BI, Rybak IA. Afferent control of locomotor cpg: insights from a simple neuromechanical model. Ann NY Acad Sci. 2010;1198(1):21–34. doi: 10.1111/j.1749-6632.2010.05435.x. [DOI] [PMC free article] [PubMed] [Google Scholar]
- 11.Goslow GE, Jr, Reinking RM, Stuart DG. The cat step cycle: hind limb joint angles and muscle lengths during unrestrained locomotion. J Morphol. 1973;141(1):1–41. doi: 10.1002/jmor.1051410102. [DOI] [PubMed] [Google Scholar]
- 12.Halbertsma JM. The stride cycle of the cat: the modelling of locomotion by computerized analysis of automatic recordings. Acta Physiol Scand Suppl. 1983;521:1. [PubMed] [Google Scholar]
- 13.Spardy LE, Markin SN, Shevtsova NA, Prilutsky BI, Rybak IA, Rubin JE. A dynamical systems analysis of afferent control in a neuromechanical model of locomotion. I. Rhythm generation. 2011 doi: 10.1088/1741-2560/8/6/065003. submitted. [DOI] [PMC free article] [PubMed] [Google Scholar]
- 14.Simic SN, Johansson KH, Lygeros J, Sastry S. Hybrid limit cycles and hybrid Poincaré-Bendixson. IFAC World Congress; Barcelona, Spain. Citeseer. 2002. [Google Scholar]
- 15.Matveev AS, Savkin AV. Qualitative theory of hybrid dynamical systems. Birkhauser; 2000. [Google Scholar]
- 16.Ivanenko YP, Grasso R, Macellari V, Lacquaniti F. Control of foot trajectory in human locomotion: role of ground contact forces in simulated reduced gravity. J Neurophysiol. 2002;87(6):3070. doi: 10.1152/jn.2002.87.6.3070. [DOI] [PubMed] [Google Scholar]
- 17.Ruckstuhl H, Kho J, Weed M, Wilkinson MW, Hargens AR. Comparing two devices of suspended treadmill walking by varying body unloading and froude number. Gait & posture. 2009;30(4):446–451. doi: 10.1016/j.gaitpost.2009.07.001. [DOI] [PubMed] [Google Scholar]
- 18.Daun-Gruhn S. A mathematical modeling study of inter-segmental coordination during stick insect walking. J Comput Neurosci. 2011:1–24. doi: 10.1007/s10827-010-0254-3. [DOI] [PubMed] [Google Scholar]
- 19.Hatsopoulos NG. Coupling the neural and physical dynamics in rhythmic movements. Neural Comp. 1996;8(3):567–581. doi: 10.1162/neco.1996.8.3.567. [DOI] [PubMed] [Google Scholar]
- 20.Iwasaki T, Zheng M. Sensory feedback mechanism underlying entrainment of central pattern generator to mechanical resonance. Biol Cybern. 2006;94(4):245–261. doi: 10.1007/s00422-005-0047-3. [DOI] [PubMed] [Google Scholar]
- 21.Williams CA, DeWeerth SP. A comparison of resonance tuning with positive versus negative sensory feedback. Biol Cybern. 2007;96:603–614. doi: 10.1007/s00422-007-0150-8. [DOI] [PubMed] [Google Scholar]
- 22.Simoni MF, DeWeerth S. Sensory feedback in a half-center oscillator model. IEEE Trans Biomed Eng. 2007;54(2):193–204. doi: 10.1109/TBME.2006.886868. [DOI] [PubMed] [Google Scholar]
- 23.Cruse H. What mechanisms coordinate leg movement in walking arthropods? Trends Neurosci. 1990;13(1):15–21. doi: 10.1016/0166-2236(90)90057-h. [DOI] [PubMed] [Google Scholar]
- 24.Beer RD, Gallagher JC. Evolving dynamical neural networks for adaptive behavior. Adaptive behavior. 1992;1(1):91. [Google Scholar]
- 25.Chiel HJ, Beer RD, Gallagher JC. Evolution and analysis of model cpgs for walking: I. dynamical modules. J Comput Neurosci. 1999;7(2):99–118. doi: 10.1023/a:1008923704408. [DOI] [PubMed] [Google Scholar]
- 26.Beer RD, Chiel HJ, Gallagher JC. Evolution and analysis of model cpgs for walking: Ii. general principles and individual variability. J Comput Neurosci. 1999;7(2):119–147. doi: 10.1023/a:1008920021246. [DOI] [PubMed] [Google Scholar]
- 27.Kuo AD. The relative roles of feedforward and feedback in the control of rhythmic movements. Motor Control. 2002;6(2):129–145. doi: 10.1123/mcj.6.2.129. [DOI] [PubMed] [Google Scholar]
- 28.Proctor J, Holmes P. Reflexes and preflexes: on the role of sensory feedback on rhythmic patterns in insect locomotion. Biol Cybern. 2010;102(6):513–531. doi: 10.1007/s00422-010-0383-9. [DOI] [PubMed] [Google Scholar]
- 29.Juvin L, Simmers J, Morin D. Locomotor rhythmogenesis in the isolated rat spinal cord: a phase-coupled set of symmetrical flexion–extension oscillators. J Physiol. 2007;583(1):115. doi: 10.1113/jphysiol.2007.133413. [DOI] [PMC free article] [PubMed] [Google Scholar]
- 30.Frigon A, Gossard JP. Asymmetric control of cycle period by the spinal locomotor rhythm generator in the adult cat. J Physiol. 2009;587(19):4617–4628. doi: 10.1113/jphysiol.2009.176669. [DOI] [PMC free article] [PubMed] [Google Scholar]
- 31.Yakovenko S. A hierarchical perspective on rhythm generation for locomotor control. in: Breathe, walk and chew, the neural challenge. Prog Brain Res. 2011;188:151–165. doi: 10.1016/B978-0-444-53825-3.00015-2. [DOI] [PubMed] [Google Scholar]
- 32.Asai Y, Nomura T, Sato S, Tamaki A, Matsuo Y, Mizukura I, Abe K. A coupled oscillator model of disordered interlimb coordination in patients with parkinson’s disease. Biol Cybern. 2003;88(2):152–162. doi: 10.1007/s00422-002-0371-9. [DOI] [PubMed] [Google Scholar]


