Abstract
Background
No simplified bedside risk scores have been created to predict long-term mortality after coronary artery bypass graft (CABG) surgery.
Methods and Results
The New York State’s Cardiac Surgery Reporting System was used to identify 8,597 patients who underwent isolated CABG surgery in July-December 2000. The National Death Index was used to ascertain patients’ vital status through December 31, 2007. A Cox proportional hazards model was fit to predict death following CABG surgery using pre-procedural risk factors. Then points were assigned to significant predictors of death based on the values of their regression coefficients. For each possible point total, the predicted risks of death at years 1, 3, 5, and 7 were calculated. It was found that the 7-year mortality rate was 24.2% in the study population. Significant predictors of death included age, body mass index, ejection fraction, unstable hemodynamic state or shock, left main coronary artery disease, cerebrovascular disease, peripheral arterial disease, congestive heart failure, malignant ventricular arrhythmia, chronic obstructive pulmonary disease, diabetes, renal failure, and history of open heart surgery. The points assigned to these risk factors ranged from 1 to 7; and possible point totals for each patient ranged from 0 to 28. The observed and predicted risks of death at years 1, 3, 5, and 7 across patient groups stratified by point totals were highly correlated.
Conclusions
The simplified risk score accurately predicted the risk of mortality following CABG surgery, and can be used for informed consent and as an aid in determining treatment choice.
Keywords: CABG, follow-up studies, mortality, risk score
Statistical models have been developed to predict short-1–8 and long-term9–11 mortality after coronary artery bypass graft (CABG) surgery. In addition, simplified bedside friendly risk scores have been created to overcome the complexity of computing predicted risk of death using statistical models in clinical settings.1, 3, 6–8 With the aid of such risk scores, predicted risks of death can be obtained by summing the weights of baseline risk factors to obtain the point total for the risk score and identifying the predicted risk of mortality for that point total. This information can be used by clinicians and patients in choosing treatment for the management of severe coronary artery disease. In the past, simple risk scores have been created mainly to predict procedural mortality after CABG surgery,1, 3, 6–8 but there is also a need for risk scores that predict long-term mortality.
Our group has previously developed a risk score that predicts the risk of in-hospital mortality following CABG surgery using the data of the New York State’s Cardiac Surgery Reporting System (CSRS).6 Built on this previous work, the current study develops a risk score for predicting the long-term (up to 7 years) mortality after CABG surgery.
Methods
Databases
The New York State’s CSRS was the main database used in this study. The CSRS was created in 1988 to establish a state-wide registry for major cardiac surgery. The CSRS registry records all major cardiac procedures performed in non-federal hospitals in the State. The database contains numerous variables, including patient demographics, pre-procedural risk factors, procedure related information, post-procedural complications, and discharge status. The completeness and accuracy of the data in the CSRS are maintained by rigorous data auditing that includes matching between the CSRS data and the statewide hospital discharge data to check completeness of case reporting, and reviewing samples of medical records in selected hospitals to check the accuracy of risk factors. Because documentation is required for coding patient risk factors, a risk factor without documentation to support its presence is coded as absent. An exception is that ejection fraction is allowed to be coded as missing when it was not evaluated prior to the procedure, and missing values were treated as a separate category of ejection fraction in this study.
A second database, the National Death Index, was used to ascertain patients’ vital statuses following discharge by matching to the CSRS on patients’ social security numbers. The NDI is maintained by the National Center for Health Statistics, and it compiles all death records in the United States.
Study Population and End Point
The study population consisted of 8,597 patients who underwent isolated CABG surgery in 33 hospitals in New York State, and were discharged between July and December 2000. The endpoint of interest is mortality after surgery in the follow-up period. Patient vital status was followed through December 31, 2007 using the National Death Index.
Statistical Analysis
First, the bivariate relationship between each patient risk factor and long-term mortality. was examined using Kaplan-Meier survival analyses. Patient risk factors examined were demographics, body surface area, body mass index (BMI), left main coronary disease (stenonsis ≥ 50%), number of diseased coronary arteries (stenonsis ≥ 70% in left anterior descending artery, left circumflex artery, and right coronary artery), ejection fraction, history of myocardial infarction (MI), hemodynamic state, the presence of comorbidities including cerebrovascular disease, peripheral arterial disease, left ventricular hypertrophy, congestive heart failure, malignant ventricular arrhythmia, chronic obstructive pulmonary disease, extensively calcified aorta, diabetes, and renal failure, and history of open heart surgery and percutaneous coronary intervention (PCI). Continuous variables such as age, body surface area, BMI, and ejection fraction were divided into clinically meaningful categories. Significant (P<0.05) risk factors were identified and were used as candidate variables in the development of a multivariate Cox proportional hazards model.
Next, the study population was randomly divided into 2 groups. The data from one group (derivation group) of patients was used to derive a Cox proportional hazards model, which was then validated in the other group of patients (validation group). Using the derivation data, a Cox proportional hazards model was fit using backward selection to identify significant predictors (P<0.05). To account for the clustering of patients within hospitals, robust sandwich estimators of standard errors of regression coefficients were obtained in the Cox proportional hazards model.12 Age as a continuous variable and age splines were used to select the best function of age in the model. Other continuous variables such as body surface area, BMI and ejection fraction were treated as categorical variables in model fitting. Interactions between age and other significant predictors were believed to be the most clinically meaningful two-way interactions to investigate, but none were found to be statistically significant and were therefore not included in the model.
The performance of the derivation model was then evaluated in the validation patient sample. The derivation model was used to predict each patient’s survival at years 1, 3, 5, and 7 following surgery. To evaluate how well the derivation model predicted survival in the validation sample, C statistics were calculated to assess discrimination,13 and the observed and predicted mortality rates of 10 groups of patients of equal sizes grouped by the predicted risk of death were compared to assess the calibration of the model.14, 15
Then, the final Cox proportional hazards model was fit by including all of the significant variables identified in the derivation model using data from the entire study population. Since t the effects of the significant risk factors in the Cox proportional hazards model could be time-dependent, though in general the proportional hazards assumptions were satisfied for patient risk factors in this study, a separate set of Cox proportional hazards models was fit for 3 time periods, i.e., within 30 days, 31 days to 1 year, and later than 1 year after surgery. These 3 time periods were chosen based on clinical significance and similarity of regression coefficients when more than three models were developed. The C statistics measuring the discrimination of these 3 period-specific Cox proportional hazards models were 0.779, 0.774, 0.773, and 0.783 over 1, 3, 5, and 7 years of follow-up, respectively, and were similar to the respective C statistics of 0.773, 0.772, 0.773, and 0.782 for the final single Cox proportional hazards model. Therefore, the simple model was used to develop the risk score in the following steps.
Based on the final Cox proportional hazards model, a simplified risk score predicting long-term mortality following CABG surgery was developed by applying the method described by Sullivan and colleagues.16 First, a constant for the risk score system was determined as the increase in risk of death associated with a 5-year increase in age, and its value was expressed as the regression coefficient of age multiplied by 5 (0.0566 × 5= 0.2830). Next, points for each category of every risk factor (age was divided into intervals) were obtained by dividing its respective regression coefficient in the final Cox proportional hazards model by the constant (0.2830) and then rounding to the nearest non-zero integer. The risk score assigned to each patient is the sum of the points assigned to each of the patient’s risk factors. Next, the predicted risk of death for each possible point total at 1, 3, 5, and 7 years was computed by first calculating the survival rates (S0 (t)) at the mean values of the risk factors at each time point (t) of years 1, 3, 5, 7. Then the predicted risk of death for each point total at each time point (t) was calculated as 1 − S0 (t)exp[0.2830 × (Point total) −Σ βix̄i], in which Σβix̄i is the sum of the products of the regression coefficient and the mean values for each risk factor in the Cox proportional hazards model.
To assess how well the risk score predicts the risks of death at years 1, 3, 5, and 7, the agreements between the predicted mortality rates estimated using the risk score and the respective observed mortality rates in those years were evaluated. The patient populations were divided into 10 groups based on the distribution of point totals of risk score and clinical significance of predicted mortality. Then, for each group at each time point, the average predicted mortality based on the risk score and the 95% confidence interval for the observed mortality were calculated. A good agreement between a predicted risk of death and its corresponding observed risk of death was defined as the predicted risk falling within the 95% CI of the observed risk.
All statistical analyses were conducted in SAS version 9.1 (SAS Institute, Cary, NC).
Results
Among the 8,597 CABG patients, 2,156 deaths occurred through the end of 2007. Figure 1 shows that the respective 1-, 3-, 5-, 7-year mortality rates were 6.2%, 11.2%, 17.6%, and 24.2%.
Figure 1.
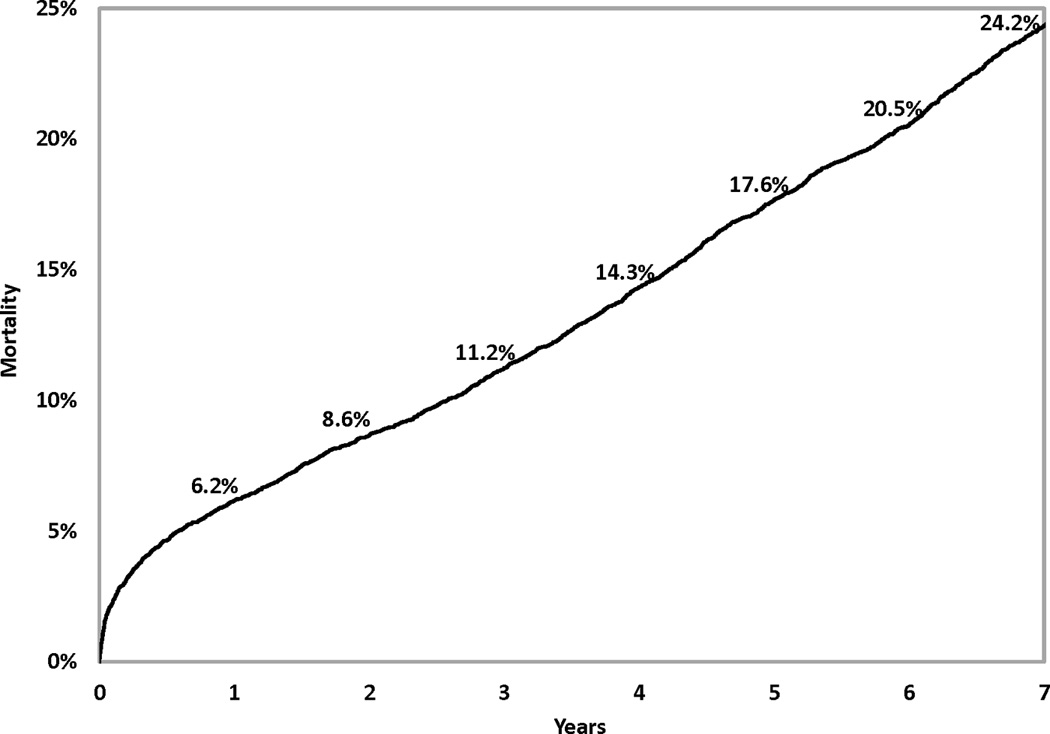
Mortality following coronary artery bypass graft surgery.
Table 1 shows that higher risk of mortality was associated with older age, female gender, non-Hispanic black race, small body surface area, extreme BMI values, left main coronary disease, multivessel disease, low values of ejection fraction, history of MI, unstable hemodynamic state/shock, the presence of comorbidities (cerebrovascular disease, peripheral arterial disease, left ventricular hypertrophy, congestive heart failure, malignant ventricular arrhythmia, chronic obstructive pulmonary disease, extensively calcified aorta, diabetes, hepatic failure, and renal failure), and history of open heart surgery or PCI prior to the current admission. Table 2 presents the Cox proportional hazards model that identified the independent predictors of death after CABG surgery. The 13 independent risk factors were older age, BMI < 25 or BMI ≥ 40, lower ejection fractions, unstable hemodynamic state/shock, left main coronary disease, a few comorbidities (cerebrovascular disease, peripheral arterial disease, congestive heart failure, malignant ventricular arrhythmia, chronic obstructive pulmonary disease, diabetes, and renal failure), and history of open heart surgery. Age was represented as a continuous variable (number of years greater than 50) in the model, and each 1-year increase in age above 50 years was associated with a 6% increase of risk of death (adjusted hazard ratio (aHR)=1.06, P<0.001)). The other risk factors were represented as categorical variables. Table 2 shows that renal failure requiring dialysis was associated with the highest relative risk of death (aHR=5.53, P<0.001). The C statistics, which measure the discrimination of the Cox proportional hazards model in the validation sample, were 0.768, 0.769, 0.771, and 0.783 for mortality at 1, 3, 5, and 7 years of follow-up. In addition, Figure 2 (Panels 2a–2d) shows good agreement between the observed and predicted mortality rates at 1, 3, 5, and 7 years for the 10 equal groups of patients categorized by the predicted risk of death.
Table 1.
Distribution of baseline risk factors and 7-year mortality (N=8,597).*
| Risk Factor | Number of Patients (%) |
7-Year Mortality (%)† |
P-Value |
|---|---|---|---|
| Mean age (yr, mean±SD) | 66.3±10.7 | - | - |
| Age group (yr) | <0.001 | ||
| <50 | 608 (7.1) | 8.9 | |
| 50–59 | 1,699 (19.8) | 11.9 | |
| 60–69 | 2,599 (30.2) | 19.2 | |
| 70–79 | 2,843 (33.1) | 31.1 | |
| ≥80 | 848(9.6) | 52.7 | |
| Sex | <0.001 | ||
| Female | 2,452 (28.5) | 28.8 | |
| Male | 6,145 (71.5) | 22.4 | |
| Race | 0.001 | ||
| Hispanic | 480 (5.6) | 23.3 | |
| Non-Hispanic white | 7,340 (85.4) | 24.3 | |
| Non-Hispanic black | 454 (5.3) | 29.3 | |
| Non-Hispanic other race | 323 (3.8) | 17.0 | |
| Body surface area (m2, mean±SD) | 2.00 ±0.25 | - | - |
| Groups of body surface area (m2) | <0.001 | ||
| 1st Quartile (≤ 1.83) | 2,198 (25.6) | 30.9 | |
| 2nd Quartile (1.84 – 1.99) | 2,102 (24.5) | 24.9 | |
| 3rd Quartile (2.00 – 2.14) | 2,155 (25.1) | 21.9 | |
| 4th Quartile (≥ 2.15) | 2,142 (24.9) | 19.1 | |
| Body mass index (kg/m2, mean±SD) | 28.5 ±5.25 | - | - |
| Body mass index (kg/m2) | <0.001 | ||
| <18.5 | 68(0.8) | 48.5 | |
| 18.5–24.99 | 2,058(23.9) | 31.2 | |
| 25.0–29.99 | 3,687(42.9) | 22.0 | |
| 30.0–34.99 | 1,862(21.7) | 21.3 | |
| 35.0–39.99 | 640(7.4) | 20.5 | |
| ≥40.0 | 282(3.3) | 25.5 | |
| Left main coronary artery disease (stenosis ≥ 50%) | <0.001 | ||
| Yes | 2,161 (25.1) | 29.2 | |
| No | 6,436 (74.9) | 22.6 | |
| Number of diseased vessels (stenosis ≥ 70%) | <0.001 | ||
| 3 | 4,841 (56.3) | 26.3 | |
| 2 | 2,554 (29.7) | 22.9 | |
| 0 or 1 | 1,202 (14.0) | 19.1 | |
| Ejection fraction | <0.001 | ||
| < 30% | 689 (8.0) | 43.5 | |
| 30–39% | 1,148 (13.4) | 32.8 | |
| 40–49% | 2,004 (23.3) | 22.5 | |
| ≥50% | 4,631 (53.9) | 20.0 | |
| Missing | 125 (1.4) | 27.2 | |
| Previous myocardial infarction | <0.001 | ||
| ≤23 hours before treatment | 117 (1.4) | 27.4 | |
| 1–7 days before treatment | 1,346 (15.7) | 23.8 | |
| 8–20 days before treatment | 571 (6.6) | 36.6 | |
| ≥21 days before treatment | 2,484 (28.9) | 28.2 | |
| No previous myocardial infarction | 4,079 (47.4) | 20.2 | |
| Hemodynamic state | <0.001 | ||
| Stable | 8,496 (98.8) | 24.0 | |
| Unstable | 75 (0.9) | 45.3 | |
| Shock | 26 (0.3) | 50.0 | |
| Cardiopulmonary resuscitation | |||
| Yes | 10 (0.1) | 40.0 | 0.11 |
| No | 8,587 (99.9) | 24.3 | |
| Cerebrovascular disease | <0.001 | ||
| Yes | 1,588 (18.5) | 39.7 | |
| No | 7,009 (81.5) | 20.8 | |
| Peripheral arterial disease | <0.001 | ||
| Yes | 903 (10.5) | 45.3 | |
| No | 7,694 (89.5) | 21.8 | |
| Electrocardiographic evidence of left ventricular hypertrophy | |||
| Yes | 974 (11.3) | 33.3 | <0.001 |
| No | 7,623 (88.7) | 23.1 | |
| Congestive heart failure | <0.001 | ||
| At current admission | 1,190 (13.8) | 43.8 | |
| Before current admission | 493 (5.7) | 44.8 | |
| None | 6,914 (80.4) | 19.4 | |
| Malignant ventricular arrhythmia | <0.001 | ||
| Yes | 131 (1.5) | 38.2 | |
| No | 8,466 (98.5) | 24.1 | |
| Chronic obstructive pulmonary disease | <0.001 | ||
| Yes | 1,426 (16.6) | 37.3 | |
| No | 7,171 (83.4) | 21.7 | |
| Extensively calcified ascending aorta | <0.001 | ||
| Yes | 423 (4.9) | 44.2 | |
| No | 8,174 (95.1) | 23.2 | |
| Diabetes | <0.001 | ||
| Yes | 2,758 (32.1) | 31.4 | |
| No | 5,839 (67.9) | 20.9 | |
| Hepatic failure | 0.03 | ||
| Yes | 5(0.1) | 60.0 | |
| No | 8,592 (99.9) | 24.2 | |
| Renal Failure (%) | <0.001 | ||
| Requiring dialysis | 133 (1.5) | 85.7 | |
| Creatinine >2.5 mg/dl (220 µmol/liter) | 150 (1.7) | 70.0 | |
| No renal failure | 8,314 (96.7) | 22.5 | |
| History of open heart operations | <0.001 | ||
| Yes | 481 (5.6) | 34.1 | |
| No | 8,116 (94.4) | 23.7 | |
| Emergency transfer to operating room after diagnostic catheterization | 0.71 | ||
| Yes | 115(1.3) | 23.5 | |
| No | 8,482(98.7) | 24.3 | |
| Emergency transfer to operating room after percutaneous coronary intervention | 0.12 | ||
| Yes | 42 (0.5) | 33.3 | |
| No | 8,555 (99.5) | 24.2 | |
| Percutaneous coronary intervention, this admission | 0.40 | ||
| Yes | 111 (1.3) | 27.9 | |
| No | 8,486 (98.7) | 24.2 | |
| Percutaneous coronary intervention, before this admission | <0.001 | ||
| Yes | 1,531 (17.8) | 21.1 | |
| No | 7,066 (82.2) | 25.0 | |
| Stent thrombosis | 0.53 | ||
| Yes | 116 (1.4) | 22.4 | |
| No | 8,481 (98.7) | 24.3 | |
Plus–minus values are means±SD. Because of rounding, percentages may not total 100;
Mortality rate was calculated using Kaplan-Meier method.
Table 2.
Cox proportional hazard model for death.
| Risk Factor | Coefficient | Adjusted Hazard Ratio (95% CI)* |
P-Value |
|---|---|---|---|
| Age: Number of years > 50 | 0.0566 | 1.06(1.05,1.06) | <0.001 |
| Body mass index (kg/m2) | |||
| < 18.5 | 0.6851 | 1.98(1.36,2.89) | 0.004 |
| 18.5 – 24.99 | 0.1491 | 1.16(1.04,1.29) | 0.006 |
| 25.0 – 39.99 | - | Reference | - |
| ≥40 | 0.2984 | 1.35(1.03,1.77) | 0.03 |
| Ejection Fraction | |||
| < 30% | 0.6089 | 1.84(1.54, 2.19) | <0.001 |
| 30 – 39% | 0.3019 | 1.35(1.21, 1.51) | <0.001 |
| ≥40† | - | Reference | - |
| Hemodynamically unstable or shock | 0.5425 | 1.72(1.19,2.50) | 0.004 |
| Left main coronary artery disease | 0.1605 | 1.17(1.07,1.29) | <0.001 |
| Cerebrovascular disease | 0.3719 | 1.45(1.32,1.59) | <0.001 |
| Peripheral arterial disease | 0.4110 | 1.51(1.32,1.72) | <0.001 |
| Congestive heart failure | 0.3596 | 1.43(1.25,1.65) | <0.001 |
| Malignant ventricular arrhythmia | 0.4232 | 1.53(1.15,2.02) | 0.003 |
| Chronic obstructive pulmonary disease | 0.3801 | 1.46(1.35,1.59) | <0.001 |
| Diabetes | 0.4276 | 1.53(1.36,1.73) | <0.001 |
| Renal failure | |||
| Requiring dialysis | 1.7108 | 5.53(4.30,7.13) | <0.001 |
| Creatinine > 2.5mg/dl (220 µmol/liter) | 0.9697 | 2.64(2.15,3.24) | <0.001 |
| No renal failure | - | Reference | - |
| Previous open heart operations | 0.2912 | 1.34(1.11,1.61) | 0.002 |
CI: confidence interval;
Including missing ejection fraction.
Figure 2.
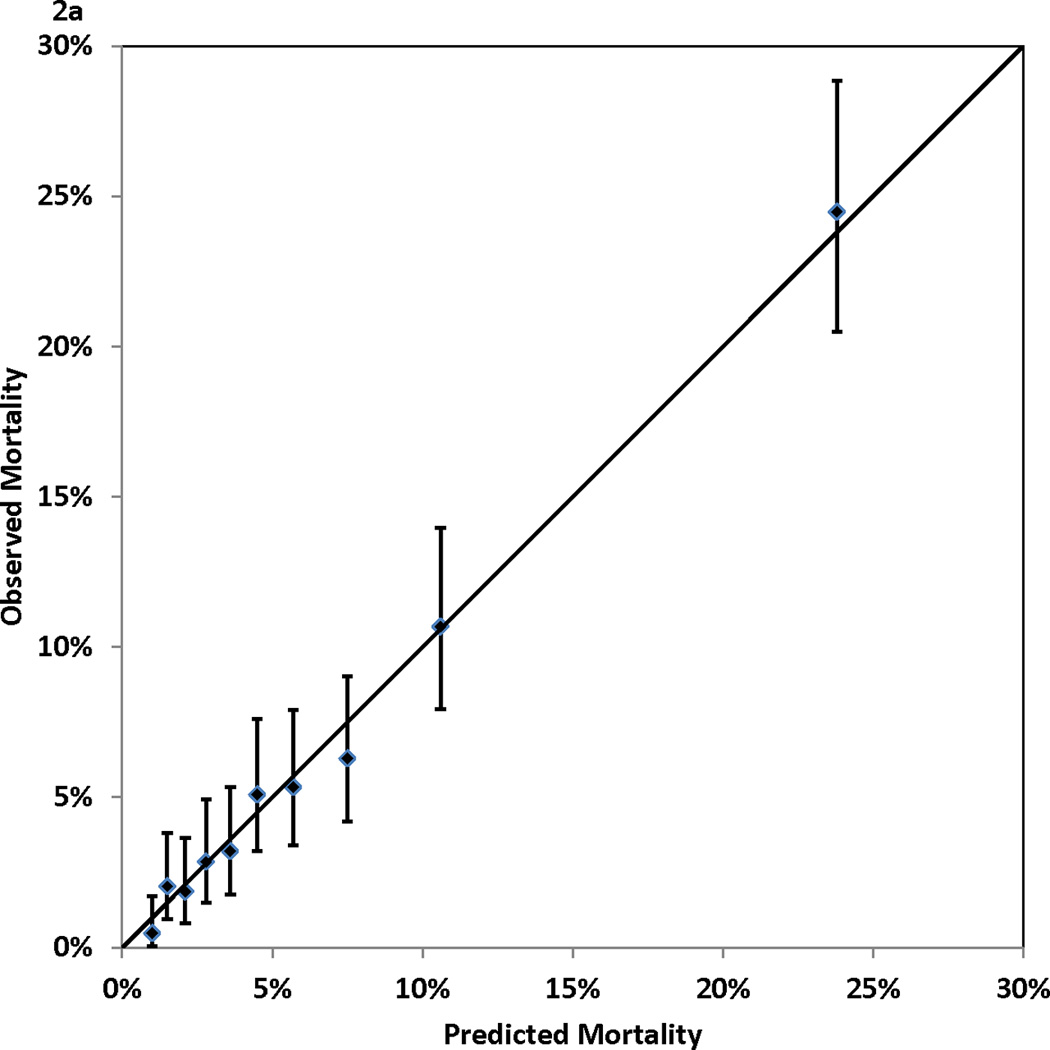
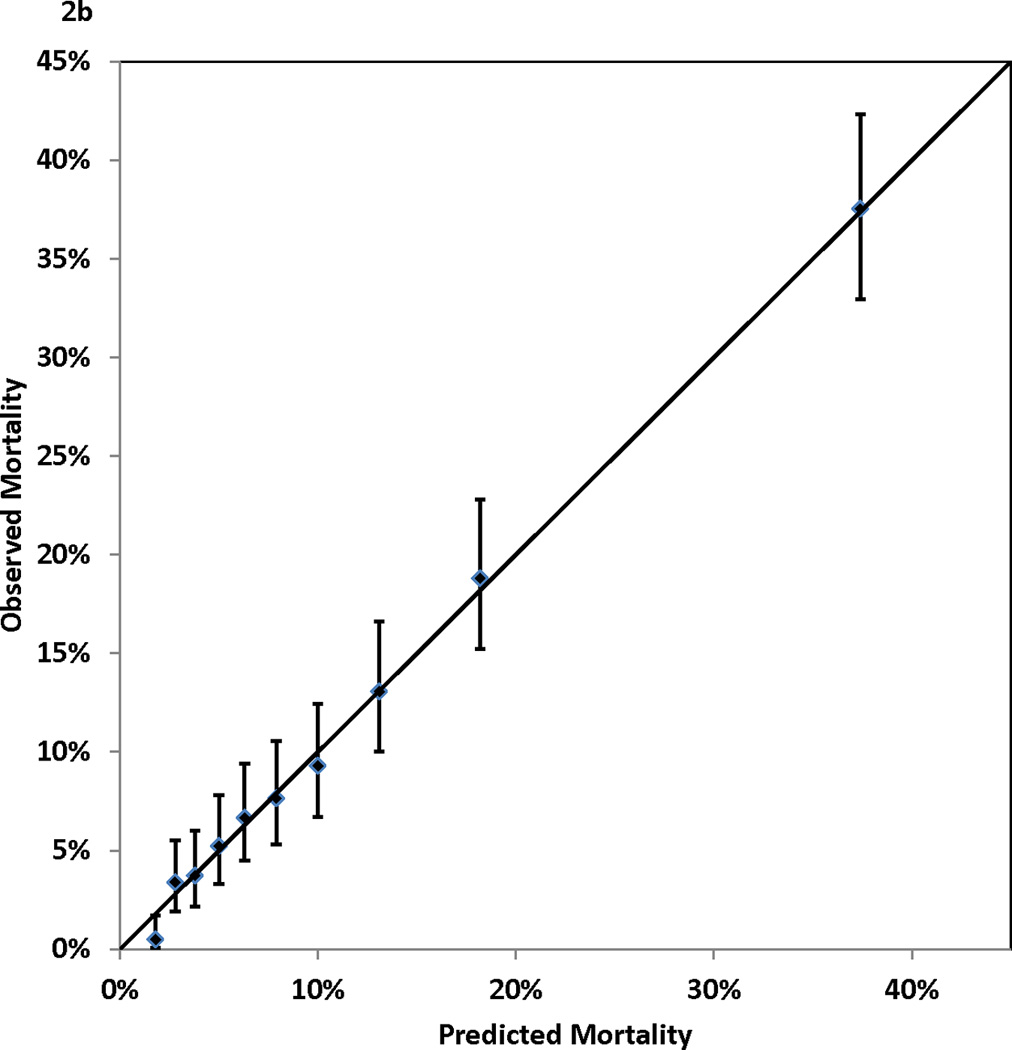
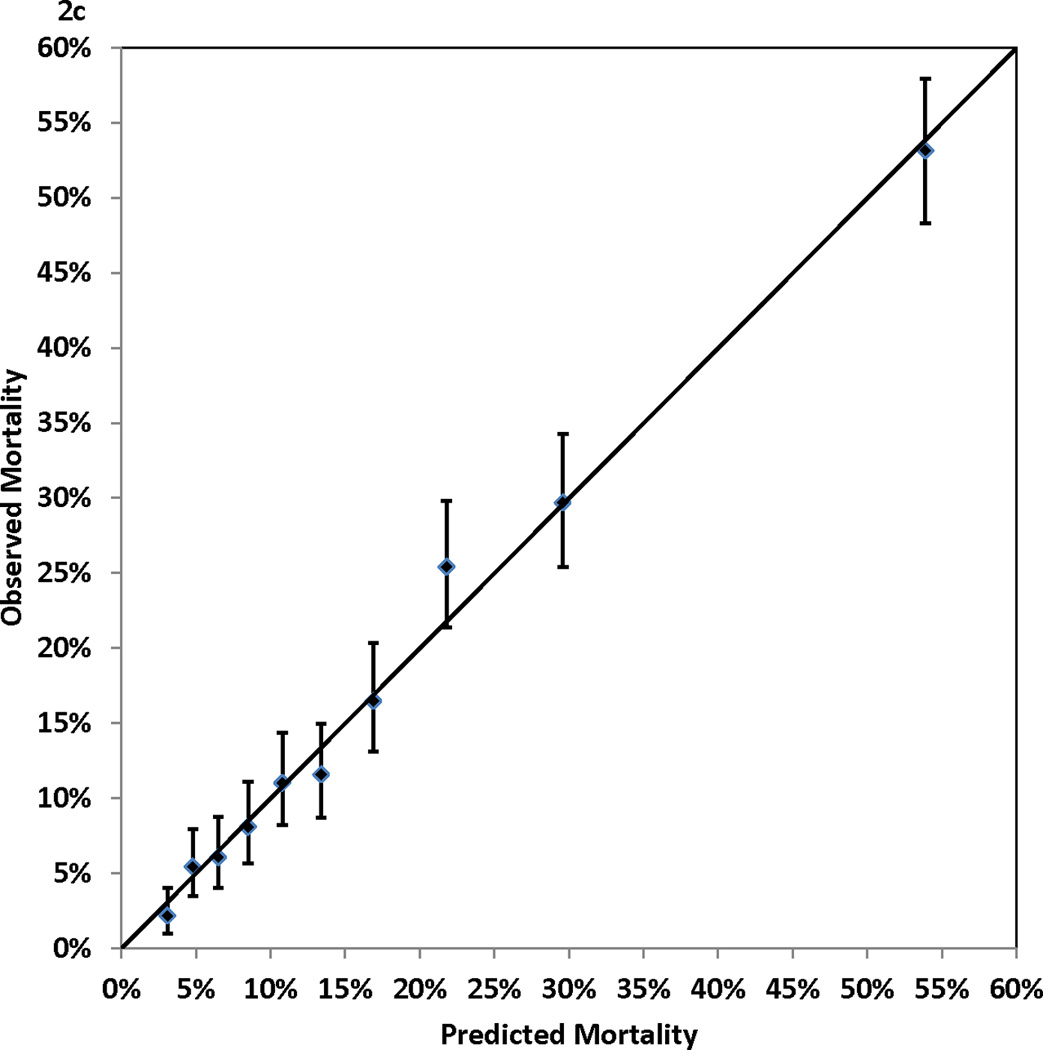
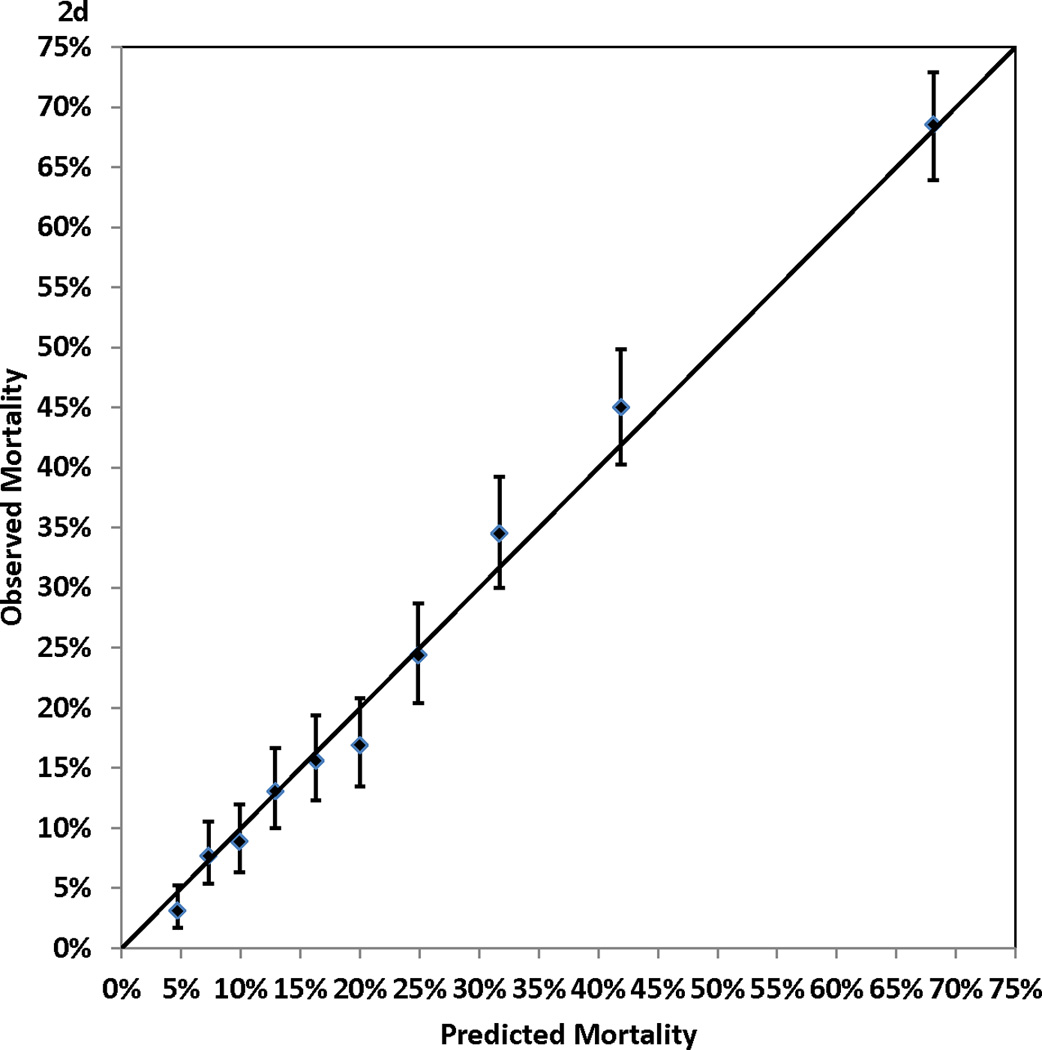
Calibration of the Cox proportional hazards model: observed (with 95% confidence interval) and predicted mortality rates for 10 groups of patients of equal size. Panel 2A, 1-year mortality. Panel 2B, 3-year mortality. Panel 2C, 5-year mortality. Panel 2D, 7-year mortality
Table 3 presents the integer points assigned to each risk factor in the Cox proportional hazards model. The points assigned to the reference categories of all risk factors were 0. The range of points was from 1 for a number of risk factors (e.g., age 51–59 years) to 7 for age ≥ 80 years. The possible range of point totals for individual patients ranged from 0 to 28. The largest observed point total in this study was 21.
Table 3.
Points assigned to each risk factor
| Risk Factor | Points |
|---|---|
| Age (yrs) | |
| ≤ 50 | 0 |
| 51–59 | 1 |
| 60–69 | 3 |
| 70–79 | 5 |
| 80+ | 7 |
| Body mass index (kg/m2) | |
| <18.5 | 2 |
| 18.5 – 24.99 | 1 |
| 25.0 – 39.99 | 0 |
| ≥40 | 1 |
| Ejection Fraction | |
| <30% | 2 |
| 30 – 39% | 1 |
| ≥40% | 0 |
| Hemodynamically unstable or shock | 2 |
| Left main coronary artery disease | 1 |
| Cerebrovascular disease | 1 |
| Peripheral arterial disease | 1 |
| Congestive heart failure | 1 |
| Malignant ventricular arrhythmia | 1 |
| Chronic obstructive pulmonary disease | 1 |
| Diabetes | 2 |
| Renal failure | |
| Requiring dialysis | 6 |
| Creatinine >2.5 mg/dl (220 µmol/liter) | 3 |
| No renal failure | 0 |
| Previous Open Heart Operations | 1 |
Possible range of point total is 0 – 28.
For each point total, the predicted risks of death at 1, 3, 5, and 7 years after the index procedure are presented in Table 4. The predicted risk of death at 1 year post procedure ranged from 0.87% for a point total of 0 to > 98% for a point total of 22 and higher. For the 7-year predicted risk of death, the range was from 4.35% for a point total of 0 to >99% for a point total of 17 and higher. Table 3 and 4 can be used together to obtain the corresponding predicted risks of death at different time intervals for each point total.
Table 4.
Predicted mortality rates for individual point totals.*
| Predicted Mortality (%) | |||||
|---|---|---|---|---|---|
| Point Total |
Cumulative Percentage of Patients with This Point Total or Less (%) |
1-Year | 3-year | 5-Year | 7-Year |
| 0 | 2.47 | 0.87 | 1.70 | 2.90 | 4.35 |
| 1 | 9.51 | 1.16 | 2.25 | 3.83 | 5.73 |
| 2 | 17.35 | 1.53 | 2.97 | 5.06 | 7.53 |
| 3 | 27.70 | 2.03 | 3.92 | 6.66 | 9.87 |
| 4 | 38.77 | 2.68 | 5.17 | 8.74 | 12.89 |
| 5 | 52.01 | 3.54 | 6.81 | 11.43 | 16.73 |
| 6 | 64.69 | 4.67 | 8.93 | 14.88 | 21.58 |
| 7 | 76.11 | 6.16 | 11.68 | 19.25 | 27.58 |
| 8 | 84.87 | 8.09 | 15.20 | 24.71 | 34.83 |
| 9 | 90.93 | 10.59 | 19.66 | 31.39 | 43.36 |
| 10 | 94.94 | 13.81 | 25.21 | 39.35 | 52.98 |
| 11 | 97.23 | 17.90 | 32.00 | 48.51 | 63.27 |
| 12 | 98.39 | 23.04 | 40.07 | 58.57 | 73.54 |
| 13 | 99.03 | 29.36 | 49.31 | 68.95 | 82.87 |
| 14 | 99.44 | 36.96 | 59.42 | 78.83 | 90.39 |
| 15 | 99.65 | 45.79 | 69.80 | 87.27 | 95.54 |
| 16 | 99.84 | 55.64 | 79.59 | 93.51 | 98.39 |
| 17 | 99.97 | 66.01 | 87.87 | 97.35 | >99 |
| 18 | 99.98 | 76.12 | 93.92 | >99 | >99 |
| 19 | 99.99 | 85.06 | 97.57 | >99 | >99 |
| 20 | 100.00 | 91.98 | >99 | >99 | >99 |
| 21 | 100.00 | 96.49 | >99 | >99 | >99 |
| 22+ | 100.00 | >98 | >99 | >99 | >99 |
The highest observed total risk score was 21
Figure 3 (Panels 3a–3d) shows good agreements between the observed mortality rates and predicted mortality rates at years 1, 3, 5, and 7 during follow-up across the 10 groups of patients categorized by point totals of risk score. All but one of the 40 predicted risks of deaths were within the corresponding 95% CIs of the observed mortality rates. The exception was the predicted risk for a point total of 7 at year 7, and the predicted risk (28.57%) was just outside of the 95% CI (29.66%–35.62%) for the respective observed mortality rate.
Figure 3.
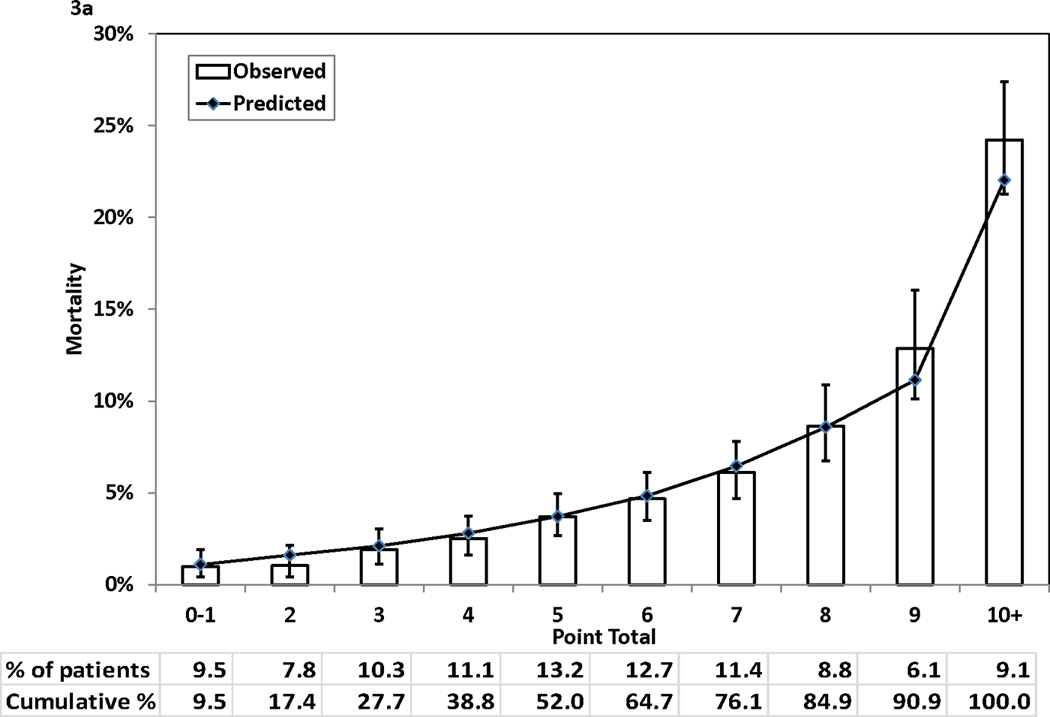
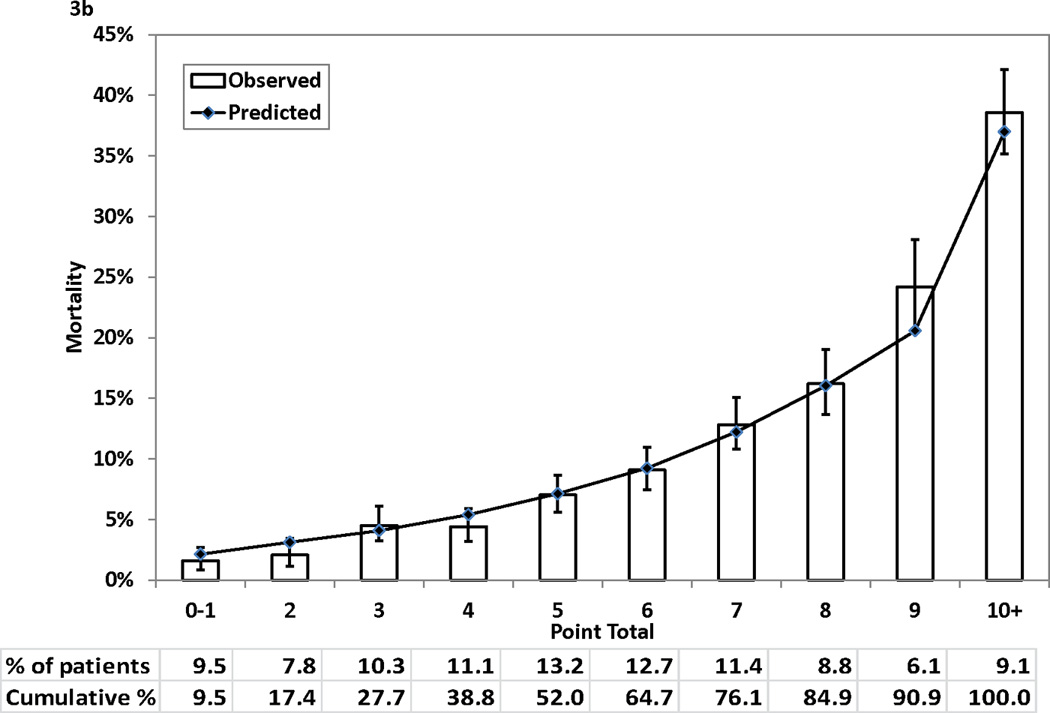
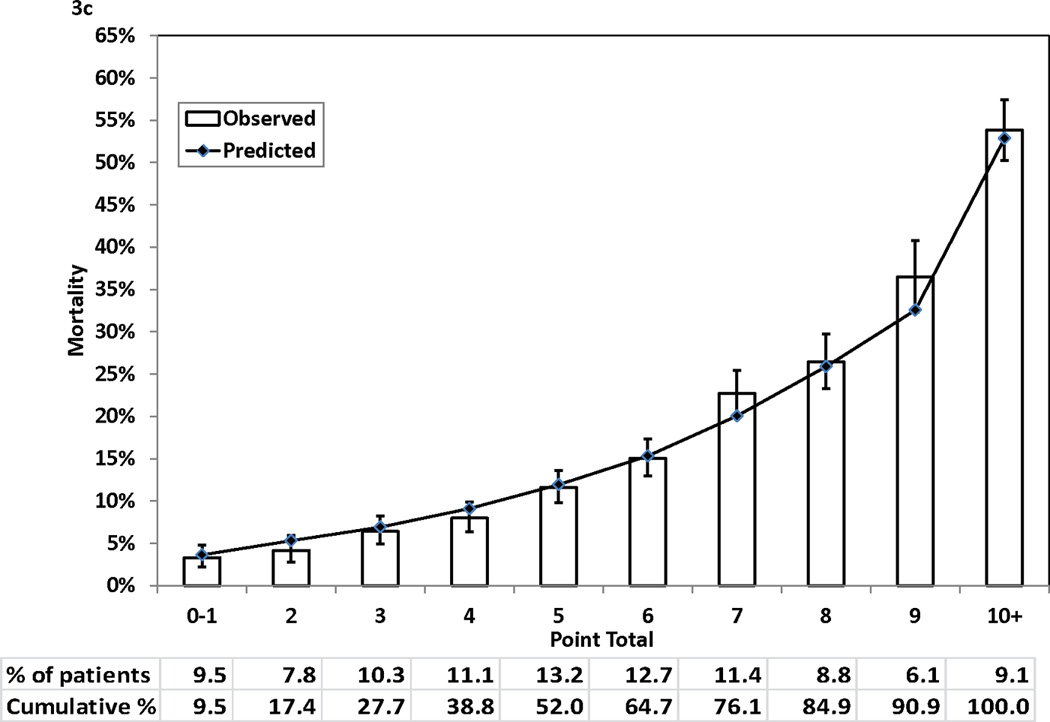
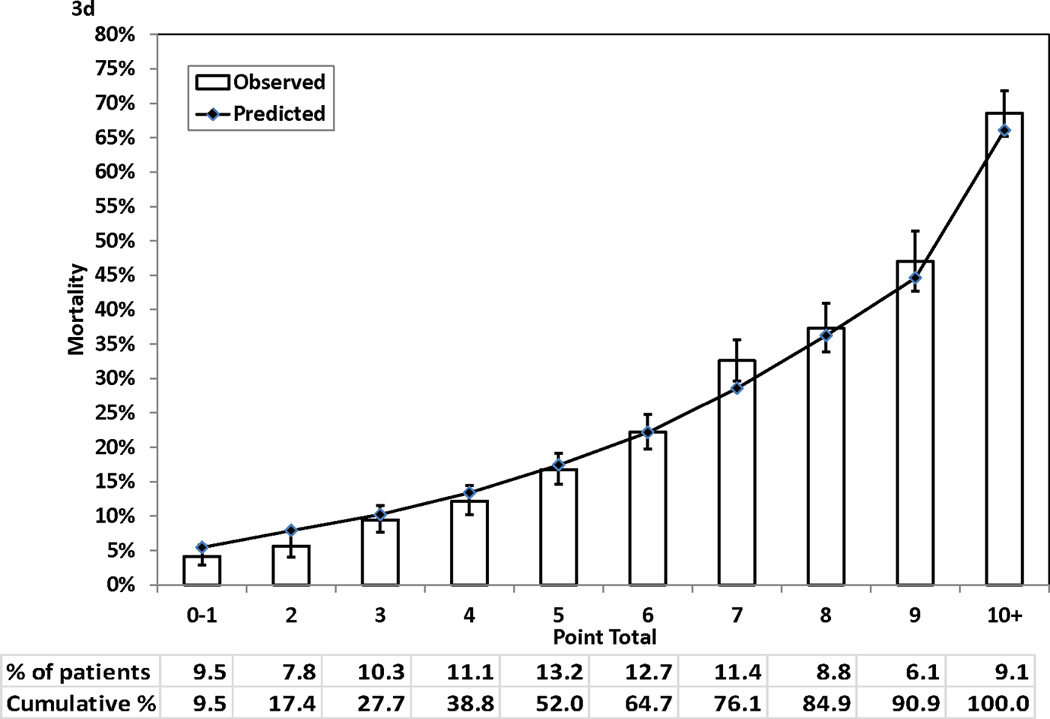
Observed (with 95% confidence interval) and predicted mortality rates by point total. Panel 3A, 1-year mortality. Panel 3B, 3-year mortality. Panel 3C, 5-year mortality. Panel 3D, 7-year mortality
Discussion
In this study, we fit a Cox proportional hazards model that identified the risk factors for long-term mortality of patients who underwent isolated CABG surgery. Based on the Cox model, we developed and evaluated a risk score that can be used to estimate the risk of long-term mortality following isolated CABG surgery.
In general, the predictors for long-term mortality identified in the Cox proportional hazards model in this study are consistent with other studies.9–11 Age, extreme BMI, lower ejection fraction values, left main coronary disease, and a few comorbidities such as cerebrovascular disease, peripheral arterial disease, congestive heart failure, malignant ventricular arrhythmia, chronic obstructive pulmonary disease, diabetes, renal failure, and history of open heart surgery have also been found to be significant predictors in other studies.9–11 The impact of these risk factors on long-term mortality was monotone except for BMI, which shows a U-shape relationship, in which BMI of 25.0 – 39.9 is related to the lowest risk, and lower and higher BMIs are associated with higher risk. Similar U-shape relationship between BMI and mortality following CABG surgery has been reported in other studies.17, 18 In addition, consistent with other studies9–11, sex was not an independent predictor of long-term mortality in this study, though female sex is often reported to be associated with higher risk of in-hospital and shortterm mortality.6, 11, 19 Also, no significant interaction between sex and BMI on the risk of long-term morality was observed in this study.
Using the Cox proportional hazards model, we developed a risk score that complements our risk score for in-hospital mortality6 by predicting mortality up to 7 years after procedure for CABG patients who have survived the first 30 days following procedures. This new risk score can be used together with the New York State CSRS CABG surgery risk score for in-hospital mortality6 or other similar risk scores for short-term mortality.1, 3, 7, 8 For example, based on a patient’s risk factors prior to isolated CABG surgery including age, sex, hemodynamic state, ejection fraction, history of MI and previous open heart surgery, and a number of comorbidities such as chronic obstructive pulmonary disease, extensively calcified aorta, peripheral arterial disease, and renal failure, the CSRS CABG surgery risk score for in-hospital mortality can be used to predict the patient’s short-term procedural risk.6 In addition, the risk score for long-term mortality developed in this study can be used to predict the risks of death at 1, 3, 5, and 7 years following CABG surgery.
Because there are possible variations in long-term mortality after CABG surgery between patient populations, we recommend recalibrating the predicted risks of death in this study in Table 4 to reflect the difference in mortality rates between the patient population of interest and our study population. First, the Cox proportional hazards model can be recalibrated using the approach described by D’Agostino and colleagues20 with the regression coefficients of the risk factors presented in Table 2, the prevalence of those risk factors, and the average survival rate in the new patient population. Then, the predicted risk of death for each point total in the new study population can be obtained using the method described in the methods section of this paper.
Our study has a few strengths. First, it used a large statewide population-based registry for CABG surgery, and therefore the generalizability of the study is likely to be high. Second, because we were able to match the patients to the National Death Index, the chance of loss to follow-up was minimized.
There are also a few limitations of the study. First, it was developed based on the data of the patients who underwent isolated CABG surgery a decade ago. The quality of CABG surgery and follow-up care has improved over time and outcomes following CABG surgery have also improved. However, our data are still the latest data on long-term mortality that are available. Second, the accuracy of this risk score should be tested in other patient populations and in other time periods. Third, the predictions from our statistical models are based on all-cause mortality that is predicted on the basis of available risk factors before CABG surgery. Some risk factors for longer-term mortality in general (e.g., cancer, smoking status) were not available. Also, the values of some risk factors (e.g., body mass index) may change over time, but only the baseline values were available. Therefore, the accuracy of the Cox proportional models is limited. Nonetheless, many non-cardiovascular risk factors (e.g., cerebrovascular disease, chronic obstructive pulmonary disease, diabetes, renal failure, and hepatic failure) were available. At 7 years of follow-up, the C statistic, which describes the capability of model to differentiate high and low risks of death, was 0.782, which is a reasonably high value. Last, the Cox proportional hazards model that was used to develop the risk score estimates the overall impact of significant risk factors on mortality during the entire 7-year follow-up period and does not estimate the impact of risk factors during sub-intervals of time within the 7 years. However, the simpler model does have similar C statistics (0.773, 0.772, 0.773, and 0.782 for 1-, 3-, 5-, and 7- year mortality, respectively) as the period specific models (0.779, 0.774, 0.773, and 0.783 for 1-, 3-, 5-, and 7- year mortality, respectively), indicating that these 2 sets of models have similar abilities for discriminating between high- and low-risk patients.
In summary, we created a risk score predicting long-term morality following isolated CABG surgery. Like our CSRS CABG risk score and other risk scores for in-hospital mortality,1, 3, 6–8 we anticipate that this new risk score can become a handy risk-stratification tool that can be used by clinicians and patients in the choice of treatment for severe coronary disease.
Bedside friendly risk scores that predict in-hospital or 30-day mortality following coronary artery bypass graft (CABG) surgery are currently available. However, there is a need for a risk score that predicts long-term mortality following CABG surgery. In this study, we developed a Cox proportional hazards model that predicts mortality up to 7 years following CABG surgery using patient baseline risk factors. Based on this model, we created a simplified risk score that can accurately predict long-term mortality after CABG surgery. This risk score can be conveniently used to estimate long-term mortality following CABG surgery for a patient for whom CABG surgery is indicated, and such information can also be useful while considering CABG surgery as an option to treat coronary artery disease.
Acknowledgments
We thank the New York State Cardiac Advisory Committee for their encouragement and support of this study; and Kimberly Cozzens, Rosemary Lombardo, and the cardiac catheterization laboratories and cardiac surgery programs of the participating hospitals for their tireless efforts to ensure the timeliness, completeness, and accuracy of the registry data.
Funding Sources: This work was supported by the NIH grant RC1HL099122. The views expressed are those of the authors and do not necessarily reflect those of the New York State Department of Health. An abstract based on part of this study was presented at the American Heart Association Scientific Sessions 2011, Orlando FL: November 12–16, 2011.
Footnotes
Publisher's Disclaimer: This is a PDF file of an unedited manuscript that has been accepted for publication. As a service to our customers we are providing this early version of the manuscript. The manuscript will undergo copyediting, typesetting, and review of the resulting proof before it is published in its final citable form. Please note that during the production process errors may be discovered which could affect the content, and all legal disclaimers that apply to the journal pertain.
Conflict of Interest Disclosures: None
References
- 1.Higgins TL, Estafanous FG, Loop FD, Beck GJ, Blum JM, Paranandi L. Stratification of morbidity and mortality outcome by preoperative risk-factors in coronary-artery bypass patients - a clinical severity score. JAMA-J. Am. Med. Assoc. 1992;267:2344–2348. [PubMed] [Google Scholar]
- 2.Wouters SCW, Noyez L, Verheugt FWA, Brouwer R. Preoperative prediction of early mortality and morbidity in coronary bypass surgery. Cardiovasc. Surg. 2002;10:500–505. doi: 10.1016/s0967-2109(02)00081-9. [DOI] [PubMed] [Google Scholar]
- 3.Nashef SAM, Rogues F, Michel P, Gauducheau E, Lemeshow S, Salamon R. Euro Ssg. European system for cardiac operative risk evaluation (euroscore) Eur. J. Cardio-Thorac. Surg. 1999;16:9–13. doi: 10.1016/s1010-7940(99)00134-7. [DOI] [PubMed] [Google Scholar]
- 4.Ivanov J, Tu JV, Naylor CD. Ready-made, recalibrated, or remodeled? Issues in the use of risk indexes for assessing mortality after coronary artery bypass graft surgery. Circulation. 1999;99:2098–2104. doi: 10.1161/01.cir.99.16.2098. [DOI] [PubMed] [Google Scholar]
- 5.Geissler HJ, Holzl P, Marohl S, Kuhn-Regnier F, Mehlhorn U, Sudkamp M, de Vivie ER. Risk stratification in heart surgery: Comparison of six score systems. Eur. J. Cardio-Thorac. Surg. 2000;17:400–405. doi: 10.1016/s1010-7940(00)00385-7. [DOI] [PubMed] [Google Scholar]
- 6.Hannan EL, Wu C, Bennett EV, Carlson RE, Culliford AT, Gold JP, Higgins RS, Isom OW, Smith CR, Jones RH. Risk stratification of in-hospital mortality for coronary artery bypass graft surgery. J Am Coll Cardiol. 2006;47:661–668. doi: 10.1016/j.jacc.2005.10.057. [DOI] [PubMed] [Google Scholar]
- 7.Shroyer ALW, Coombs LP, Peterson ED, Eiken MC, DeLong ER, Chen A, Ferguson TB, Grover FL, Edwards FH. The society of thoracic surgeons: 30-day operative mortality and morbidity risk models. Ann. Thorac. Surg. 2003;75:1856–1864. doi: 10.1016/s0003-4975(03)00179-6. [DOI] [PubMed] [Google Scholar]
- 8.Parsonnet V, Dean D, Bernstein AD. A method of uniform stratification of risk for evaluating the results of surgery in acquired adult heart disease. Circulation. 1989;79:I3–I12. [PubMed] [Google Scholar]
- 9.Gao D, Grunwald GK, Rumsfeld JS, Schooley L, MacKenzie T, Shroyer AL. Time-varying risk factors for long-term mortality after coronary artery bypass graft surgery. Ann Thorac Surg. 2006;81:793–799. doi: 10.1016/j.athoracsur.2005.08.005. [DOI] [PubMed] [Google Scholar]
- 10.Gardner SC, Grunwald GK, Rumsfeld JS, Mackenzie T, Gao D, Perlin JB, McDonald G, Shroyer AL. Risk factors for intermediate-term survival after coronary artery bypass grafting. Ann Thorac Surg. 2001;72:2033–2037. doi: 10.1016/s0003-4975(01)03217-9. [DOI] [PubMed] [Google Scholar]
- 11.MacKenzie TA, Malenka DJ, Olmstead EM, Piper WD, Langner C, Ross CS, O'Connor GT. Northern New England Cardiovascular Disease Study G. Prediction of survival after coronary revascularization: Modeling short-term, mid-term, and long-term survival. Ann Thorac Surg. 2009;87:463–472. doi: 10.1016/j.athoracsur.2008.09.042. [DOI] [PubMed] [Google Scholar]
- 12.Lin DY, Wei LJ. The robust inference for the cox proportional hazards model. Journal of the American Statistical Association. 1989;84:1074–1078. [Google Scholar]
- 13.Hanley JA, McNeil BJ. The meaning and use of the area under a receiver operating characteristic (roc) curve. Radiology. 1982;143:29–36. doi: 10.1148/radiology.143.1.7063747. [DOI] [PubMed] [Google Scholar]
- 14.Hosmer DW, Lemeshow S. Applied logistic regression. New York, NY: John Wiley and Sons; 1989. [Google Scholar]
- 15.Hosmer DW, Lemeshow S, May S. Applied survival analysis: Regression modeling of time to event data. Hoboken, NJ: Wiley-Interscience; 2008. [Google Scholar]
- 16.Sullivan LM, Massaro JM, D'Agostino RB., Sr Presentation of multivariate data for clinical use: The framingham study risk score functions. Stat Med. 2004;23:1631–1660. doi: 10.1002/sim.1742. [DOI] [PubMed] [Google Scholar]
- 17.Jin R, Grunkemeier GL, Furnary AP, Handy JR., Jr Is obesity a risk factor for mortality in coronary artery bypass surgery? Circulation. 2005;111:3359–3365. doi: 10.1161/CIRCULATIONAHA.104.489880. [DOI] [PubMed] [Google Scholar]
- 18.Wagner BD, Grunwald GK, Rumsfeld JS, Hill JO, Ho PM, Wyatt HR, Shroyer AL. Relationship of body mass index with outcomes after coronary artery bypass graft surgery. Ann Thorac Surg. 2007;84:10–16. doi: 10.1016/j.athoracsur.2007.03.017. [DOI] [PubMed] [Google Scholar]
- 19.Kim C, Redberg RF, Pavlic T, Eagle KA. A systematic review of gender differences in mortality after coronary artery bypass graft surgery and percutaneous coronary interventions. Clinical Cardiology. 2007;30:491–495. doi: 10.1002/clc.20000. [DOI] [PMC free article] [PubMed] [Google Scholar]
- 20.D'Agostino RB, Sr, Grundy S, Sullivan LM, Wilson P. Group CHDRP. Validation of the framingham coronary heart disease prediction scores: Results of a multiple ethnic groups investigation. JAMA. 2001;286:180–187. doi: 10.1001/jama.286.2.180. [DOI] [PubMed] [Google Scholar]


