

Abstract
Background
No previous prospective US study has examined if the incidence of colorectal cancer (CRC) is disproportionately high in low socioeconomic status (SES) populations of both men and women. This study examined the relationship between both individual and area-level SES and CRC incidence, overall and by tumor location.
Methods
Data were obtained from the ongoing prospective NIH-AARP Diet and Health Study of persons (50–71 years old) who resided in 6 US states and 2 metropolitan areas at baseline in 1995–1996. Incident CRCs were ascertained from tumor registries through December 2006. SES was measured by self-reported education and census-tract socioeconomic deprivation. Baseline and follow-up questionnaires collected detailed information on individual-level CRC risk factors including family history and health behaviors.
Findings
Among 506,488 participants analyzed, 7,676 were diagnosed with primary invasive colorectal adenocarcinomas: 46.6% in the right colon, 26.7% in the left colon and 25.9% in the rectum. The overall incidence of CRC was significantly higher among people who had low-educational level or lived in low-SES neighborhoods, relative to respective highest-SES groups, even after accounting for other risk factors. These associations were stronger in the rectum than in left or right colon. In the right colon, there were no significant SES differences by either SES measure after accounting for covariates.
Conclusion
SES, assessed by either individual-level education or neighborhood measures, was associated with risk of CRC even after accounting for other risk factors. The relationship between SES and CRC was strongest in the rectum and weakest in the right colon.
Keywords: colorectal cancer, socioeconomic status, risk factors, health behavior, poverty
INTRODUCTION
In 2011, an estimated 141,210 new cases of colorectal cancer (CRC) will be diagnosed in the US.1 Evidence from published studies suggests that people in low socioeconomic status (SES) will comprise a disproportionate number of these new cases.2–9 However, many of the existing US studies were cross-sectional in design and therefore not able to establish a temporal relationship between SES and CRC diagnosis. Also, no previous published US study has simultaneously examined the association of both individual and area-level SES and the incidence of CRC in the same analysis, overall and by tumor location.
A prospective study of women in the Nurses’ Health Study found a significant association between neighborhood SES and colon cancer incidence only for nurses with at least a college degree.9 Significant weaknesses of that study included reliance on self-reported CRC diagnosis; and a failure to analyze proximal colon cancers separately from distal cancers. There is evidence that right colon cancers differ biologically from those in the left colon,10, 11 suggesting that the effect of SES may also differ according to tumor location within the colon. Clarifying these relationships can help provide strong evidence for programs or policies that seek to understand and reduce SES disparities in CRC.
In this analysis, we examined whether self-reported educational achievement and neighborhood SES increases the risk of CRC. We hypothesized that SES has a differential effect based on tumor location. A secondary goal was to determine whether SES differences in incidence by neighborhood SES are similar to differences by educational achievement.
METHODS
Study design and population
This report used data from the ongoing prospective National Institutes of Health-AARP Diet and Health Study (NIH-AARP study). Details of the design and procedures of the NIH-AARP study have been described previously (http://dietandhealth.cancer.gov/).12 The cohort was comprised of 566,401 men and women who were between 50 and 71 years of age at the time of recruitment into the study in 1995 or 1996. Study participants were drawn from 2 metropolitan areas (Atlanta, GA, and Detroit, MI) and the states of California, Florida, Louisiana, New Jersey, North Carolina, and Pennsylvania. Between 1995 and 2000, only 5% of the cohort had moved out of a tumor registry area, preserving the high level of retention within the cohort. For this analysis, we excluded 705 participants for invalid or missing census data; 947 who withdrew from the study or did not accrue follow up time; 4,497 who reported a history of CRC at the time of the baseline questionnaire; and 53,764 with missing data on education, race, smoking, physical activity or BMI. The study was approved by the NCI Special Studies Institutional Review Board.
Colorectal Cancer Incidence Ascertainment
The outcome for this analysis was the incidence of primary invasive adenocarcinoma of the colon or rectum. Follow-up for ascertainment of CRC diagnosis began from the date when the baseline questionnaire was received at the study center and continued until respondents moved out of a tumor registry area or December 31, 2006, whichever occurred first. New CRC cases, along with the date of diagnosis, were obtained from participating state tumor registries using codes from both the second and third editions of the International Classification of Diseases for Oncology (ICD-O). Adenocarcinoma were identified by using the following histology codes: 8000, 8010, 8020–1, 8140–7, 8200, 8210–1, 8215, 8221, 8230, 8255, 8260–3, 8323, 8410, 8430, 8440, 8470, 8480–1, 8490, 8510, 8560, 8570–4 and 8576. Using ICD-O codes, we categorized a tumor as right or left depending on whether it was located before or after the splenic flexure, or unspecified.
Socioeconomic Indicators
The predictors of primary interest in our analyses were SES measures, defined at both the individual and area levels. Participants completed a mailed questionnaire at baseline (1995–1996) that included a question about “the highest grade or level of schooling completed” with the following response options: less than 8 years; 8–11 years; 12 years or completed high school; post-high school training other than college (e.g. vocational or technical training); some college; college graduate; or post-graduate. In our analyses, we combined the first two categories as “<12 years of schooling” since these groups had similar CRC incidence rates and those with <8 years of schooling comprised only 0.8% (n=3,849) of the analytic sample.
The NIH-AARP study used the residential address of each participant at baseline to link to socioeconomic data from the 2000 decennial census. Principal component analysis was then used to compute a socioeconomic deprivation index (neighborhood SES) using the following 10 variables measured at the census-tract level13, 14: percent of persons in the census-tract who had less than high school education; or were unemployed, non-Hispanic blacks, or in managerial jobs [separately for men and women]; as well as percent of households below 1999 federal poverty levels, on public assistance, or with annual income of <$30,000, no car, or headed by a female with dependent children. Unlike person-level variables, this summary variable takes into account socioeconomic context and the racial composition of people residing in the same census-tract and was used as an indicator of neighborhood SES. Higher scores correspond to lower neighborhood SES.
Covariates
The baseline questionnaire collected data on several individual-level CRC risk factors including age, sex, race and ethnicity, health behaviors, history of diabetes and history of CRC in a first degree relative. Body mass index (BMI) was calculated from self-reported body weight (lbs) and height (ft-inches). Data on smoking included whether a participant had ever smoked more than 100 cigarettes during their lifetime, and if so, the typical number of cigarettes smoked per day and current smoking status. Physical activity was measured by the frequency of vigorous physical activity that lasted at least 20 minutes. Components of participants’ usual diet over a prior 12-month period were ascertained using a 124-item food frequency questionnaire (FFQ).15 A Mediterranean diet score was calculated from the reported intakes of vegetables, legumes, fruit and nuts, fish and seafood, cereals, meat and meat products, dairy products, and alcoholic beverages, and the ratio of monounsaturated to saturated fat in the diet. This index-based dietary measure incorporates several of the dietary components known to be associated with CRC risk and has been shown to be strongly predictive of CRC incidence.16 Data on the frequency of use of aspirin and other non-steroidal anti-inflammatory drugs (NSAIDs) “during the past 12 months” were collected in a follow-up questionnaire in 1996–1997 on a subset of the original cohort.
Statistical analysis
We used the Chi-square test for categorical variables and analysis of variance for continuous variables to compare the characteristics of the cohort across categories of education and quintiles of neighborhood SES. We assessed for variation in CRC incidence across census tracts using Weibull gamma frailty models and found that it was not statistically significant (likelihood ratio test p-value=0.19–0.46). Our estimations were then performed using Poisson regression models that accounted for exposure time and with robust variance estimation, based on standard model assumptions.17 Poisson models were a good fit for the data as evaluated with the chi-square goodness-of-fit test.
We used Poisson regression models to obtain age and sex adjusted incidence rates. We then estimated incidence rate ratios (IRR) and 95% confidence intervals (CI) for associations between each SES measure (separately) and CRC incidence. First, we adjusted for non-mutable factors (age, sex, race and ethnicity and family history of CRC) and state of residence (Model 1). Second, we included the same factors as Model 1 but further simultaneously adjusted for education, neighborhood SES and the behavioral factors (obesity, diet, physical activity and smoking) (Model 2). The goal was to determine whether associations between SES and CRC incidence were stable to adjustment for other risk factors especially health behaviors. These analyses were performed for all tumors combined and then according to tumor location. We performed sensitivity analyses in which we added NSAIDs use to Model 2 on a subset of the cohort (n= 306,146). We also examined for, and did not find statistically significant, interactions between education and quintiles of neighborhood SES (Bonferroni adjusted p-value=0.22–0.98, depending on tumor location). All analyses were performed using STATA Release 11.2.
RESULTS
Characteristics of participants
Of the 506,488 participants included in the analyses, about 93% were non-Hispanic whites, and 39.8% had a college degree or higher. The distribution of the cohort according to levels of educational achievement and neighborhood deprivation are shown in Tables 1 and 2, respectively. Participants in low-educational or neighborhood SES groups were slightly older than those in the respective highest-SES group. There were also more women, blacks and Hispanics in the lower SES groups. Compared to participants residing in the high-SES neighborhoods (census-tracts), a higher proportion in the low-SES areas had <12 years of education (see Table 2).
Table 1.
Characteristics of the cohort (n=507,314) according to educational achievement, NIH-AARP Study, 1995–2006
| Characteristics, % | Educational Achievement | |||||
|---|---|---|---|---|---|---|
| <12 years | High school | Post-high school | Some college | College | Post-graduate | |
| N | 31,333 | 101,580 | 51,612 | 120,507 | 98,292 | 103,164 |
| Age | ||||||
| <55 | 6.6 | 10.5 | 13.2 | 14.6 | 14.4 | 15.8 |
| 55–59 | 17.0 | 21.3 | 21.8 | 23.5 | 22.9 | 23.9 |
| 60–64 | 28.0 | 29.6 | 27.8 | 27.8 | 27.8 | 27.5 |
| 65–69 | 42.8 | 34.8 | 33.4 | 30.8 | 31.4 | 29.5 |
| =>70 | 5.5 | 3.8 | 3.8 | 3.3 | 3.5 | 3.3 |
| Females | 39.0 | 51.4 | 43.0 | 42.8 | 31.4 | 30.8 |
| Race/ethnicity | ||||||
| Non-Hispanic White | 89.0 | 93.8 | 93.6 | 92.5 | 93.1 | 93.5 |
| Non-Hispanic Black | 6.2 | 3.6 | 3.4 | 4.1 | 2.8 | 3.1 |
| Hispanic | 3.5 | 1.6 | 1.8 | 2.0 | 1.7 | 1.3 |
| Others | 1.3 | 0.9 | 1.3 | 1.4 | 2.3 | 2.1 |
| Family history of CRC | 4.8 | 5.6 | 6.1 | 5.9 | 6.3 | 6.8 |
| Mediterranean diet | ||||||
| Low | 46.2 | 42.6 | 38.0 | 35.0 | 30.4 | 25.0 |
| Middle | 38.6 | 40.0 | 40.7 | 40.9 | 41.3 | 41.2 |
| High | 15.3 | 17.4 | 21.4 | 24.1 | 28.3 | 33.8 |
| Physical activity | ||||||
| Never | 11.7 | 7.1 | 4.6 | 4.1 | 2.9 | 2.1 |
| Rarely | 19.4 | 17.9 | 15.1 | 14.3 | 11.5 | 9.6 |
| Once monthly – twice weekly | 31.0 | 34.6 | 37.0 | 36.8 | 36.2 | 34.8 |
| 3+ weekly | 37.9 | 40.3 | 43.3 | 44.8 | 49.4 | 53.4 |
| Body mass index, kg/m2 | ||||||
| <25 | 28.2 | 33.2 | 33.7 | 34.7 | 38.0 | 40.0 |
| 25–30 | 43.0 | 41.9 | 42.7 | 42.1 | 43.3 | 42.4 |
| >30 | 28.8 | 24.9 | 23.6 | 23.2 | 18.7 | 17.7 |
| Smoking | ||||||
| Never smoked | 26.4 | 36.4 | 32.3 | 31.2 | 37.3 | 45.3 |
| Former ≤20 cigs/day | 29.8 | 27.9 | 29.6 | 29.2 | 29.0 | 28.5 |
| Former>20 cigs/day | 25.4 | 20.9 | 23.3 | 25.3 | 23.8 | 19.2 |
| Current ≤20 cigs/day | 11.9 | 9.7 | 9.2 | 9.0 | 6.3 | 4.6 |
| Current >20 cigs/day | 6.5 | 5.1 | 5.6 | 5.3 | 3.6 | 2.4 |
| NSAIDs, n | 15,844 | 58,194 | 31,151 | 72,771 | 61,618 | 66,568 |
| Non-Aspirin NSAIDs* | ||||||
| None | 48.4 | 45.5 | 43.5 | 42.0 | 41.7 | 40.6 |
| <2 times monthly | 13.9 | 17.1 | 18.4 | 20.2 | 23.1 | 24.4 |
| 2–3 times monthly | 9.4 | 11.5 | 11.7 | 12.1 | 12.0 | 12.0 |
| 1–2 times weekly | 6.3 | 7.0 | 7.1 | 7.1 | 7.1 | 7.5 |
| 3–6 times weekly | 6.9 | 6.2 | 6.5 | 6.3 | 5.8 | 5.5 |
| Once daily | 5.3 | 4.9 | 4.9 | 4.7 | 4.3 | 4.1 |
| 2+ times daily | 6.7 | 5.8 | 6.5 | 6.1 | 4.8 | 4.7 |
| Missing | 3.0 | 2.0 | 1.5 | 1.5 | 1.2 | 1.2 |
| Aspirin | ||||||
| None | 31.4 | 30.4 | 28.1 | 26.6 | 24.4 | 23.5 |
| <2 times monthly | 14.6 | 17.5 | 18.1 | 19.8 | 21.5 | 22.0 |
| 2–3 times monthly | 9.4 | 11.5 | 10.6 | 11.2 | 10.8 | 10.8 |
| 1–2 times weekly | 6.9 | 6.8 | 7.2 | 7.1 | 7.1 | 7.0 |
| 3–6 times weekly | 8.4 | 8.6 | 9.4 | 9.2 | 9.8 | 10.6 |
| Once daily | 23.3 | 21.0 | 22.7 | 22.1 | 23.3 | 23.0 |
| 2+ times daily | 3.7 | 2.7 | 2.8 | 2.9 | 2.3 | 2.1 |
| Missing | 2.2 | 1.5 | 1.2 | 1.1 | 1.0 | 0.9 |
NSAIDs= Non-steroidal anti-inflammatory agents. Data on NSAIDs were collected in a follow-up questionnaire during 1996–1997 on a subset of the original cohort.
All chi-square test for trend p-values were <0.001
Table 2.
Characteristics of the cohort (n=507,314) according to education and neighborhood SES, NIH-AARP Study, 1995–2006
| Characteristics, % | Quintiles of Socioeconomic Deprivation Index*
|
||||
|---|---|---|---|---|---|
| First quintile | Second Quintile | Third Quintile | Fourth Quintile | Fifth quintile | |
| N | 150,389 | 132,342 | 111,485 | 77,619 | 34,653 |
|
| |||||
| Age | |||||
| <55 | 14.6 | 13.4 | 12.3 | 12.4 | 13.0 |
| 55–59 | 23.7 | 22.2 | 21.5 | 21.8 | 22.6 |
| 60–64 | 27.7 | 28.0 | 28.0 | 28.5 | 29.1 |
| 65–69 | 30.6 | 32.7 | 34.2 | 33.4 | 31.8 |
| =>70 | 3.4 | 3.6 | 3.9 | 3.9 | 3.5 |
| Females | 35.5 | 38.4 | 40.8 | 43.9 | 49.4 |
| Race/ethnicity | |||||
| Non-Hispanic White | 95.6 | 95.4 | 94.6 | 91.0 | 71.9 |
| Non-Hispanic Black | 1.2 | 1.7 | 2.5 | 5.0 | 22.0 |
| Hispanic | 1.3 | 1.5 | 1.7 | 2.5 | 4.0 |
| Others | 2.0 | 1.4 | 1.2 | 1.5 | 2.1 |
| Education | |||||
| Post-graduate | 31.1 | 19.5 | 14.7 | 12.8 | 12.5 |
| College degree | 26.5 | 19.5 | 15.6 | 13.5 | 13.3 |
| Some college | 22.1 | 24.5 | 24.7 | 24.4 | 23.8 |
| Post-high school | 6.7 | 10.8 | 12.2 | 12.4 | 11.5 |
| High school | 11.4 | 20.4 | 24.9 | 26.6 | 26.2 |
| <12 years | 2.2 | 5.3 | 7.8 | 10.1 | 12.6 |
| Family history of CRC | 6.3 | 6.1 | 6.2 | 5.8 | 5.3 |
| Mediterranean diet | |||||
| Low | 29.5 | 34.8 | 36.8 | 38.7 | 39.0 |
| Middle | 40.9 | 40.7 | 40.6 | 40.5 | 40.4 |
| High | 29.5 | 24.5 | 22.6 | 20.8 | 20.5 |
| Physical activity | |||||
| Never | 3.0 | 4.1 | 5.2 | 6.1 | 7.9 |
| Rarely | 11.4 | 13.8 | 14.6 | 15.9 | 18.3 |
| Once monthly to twice weekly | 35.7 | 35.9 | 35.4 | 35.1 | 34.5 |
| 3+ weekly | 49.8 | 46.1 | 44.8 | 42.9 | 39.2 |
| Body mass index, kg/m2 | |||||
| <25 | 40.3 | 35.4 | 33.4 | 32.6 | 29.8 |
| 25–30 | 42.5 | 43.0 | 42.9 | 42.1 | 40.1 |
| >30 | 17.2 | 21.6 | 23.8 | 25.3 | 30.1 |
| Smoking | |||||
| Never smoked | 38.4 | 35.5 | 34.5 | 34.8 | 36.4 |
| Former ≤20 cigs/day | 29.9 | 29.0 | 28.6 | 27.4 | 27.6 |
| Former>20 cigs/day | 22.6 | 23.5 | 23.2 | 22.5 | 18.9 |
| Current ≤20 cigs/day | 6.1 | 7.6 | 8.6 | 9.4 | 11.6 |
| Current >20 cigs/day | 3.1 | 4.3 | 5.1 | 5.8 | 5.5 |
|
| |||||
| NSAIDs, n | 92,514 | 81,096 | 67,433 | 45,558 | 19,545 |
|
| |||||
| Non-Aspirin NSAIDs* | |||||
| None | 40.2 | 43.0 | 43.9 | 44.5 | 45.9 |
| <2 times monthly | 23.7 | 20.9 | 19.0 | 17.9 | 16.9 |
| 2–3 times monthly | 12.5 | 11.7 | 11.5 | 11.2 | 10.7 |
| 1–2 times weekly | 7.7 | 7.0 | 7.0 | 6.8 | 6.3 |
| 3–6 times weekly | 5.9 | 6.0 | 6.1 | 6.4 | 6.2 |
| Once daily | 4.0 | 4.5 | 4.8 | 5.0 | 5.1 |
| 2+ times daily | 4.7 | 5.4 | 6.0 | 6.4 | 6.9 |
| Missing | 1.3 | 1.4 | 1.6 | 1.8 | 2.1 |
| Aspirin | |||||
| None | 24.5 | 26.3 | 27.3 | 28.7 | 30.6 |
| <2 times monthly | 22.0 | 19.8 | 18.5 | 17.8 | 17.9 |
| 2–3 times monthly | 11.1 | 11.0 | 10.7 | 10.8 | 10.7 |
| 1–2 times weekly | 7.3 | 7.0 | 7.0 | 6.7 | 6.8 |
| 3–6 times weekly | 9.9 | 9.7 | 9.4 | 9.0 | 8.6 |
| Once daily | 22.2 | 22.5 | 23.1 | 22.6 | 20.6 |
| 2+ times daily | 2.1 | 2.6 | 2.9 | 3.0 | 3.2 |
| Missing | 1.0 | 1.2 | 1.2 | 1.3 | 1.6 |
NSAIDs= Non-steroidal anti-inflammatory agents. Data on NSAIDs were collected in a follow-up questionnaire during 1996–1997 on a subset of the original cohort.
All chi-square test for trend p-values were <0.001
Incidence and Location of Colorectal Cancer
There were a total of 7,676 participants diagnosed with CRC during the nearly 5 million person-years of follow-up on the study. The overall CRC incidence rate adjusted for age and sex was 16.0 per 10,000 person-years. About 46.6% (n=3,576) of the cancers were in the right colon, 26.7% (n=2,050) in the left colon, 25.9% (n=1,991) in the rectum and 0.8% (n=59) in unspecified locations. There were more proximal cancers in people with postgraduate education than in those with <12 years of education (49.6% vs. 46.2%, p-value=0.01) (see also Figure 1). A similar tumor distribution of location was seen according to neighborhood SES (48.8% proximal cancers in the first vs. 46.7% in the fifth quintile, p-value=0.01).
Figure 1.
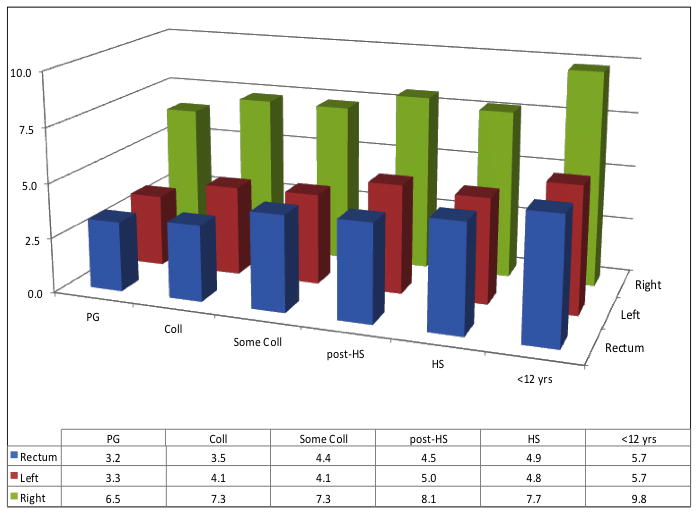
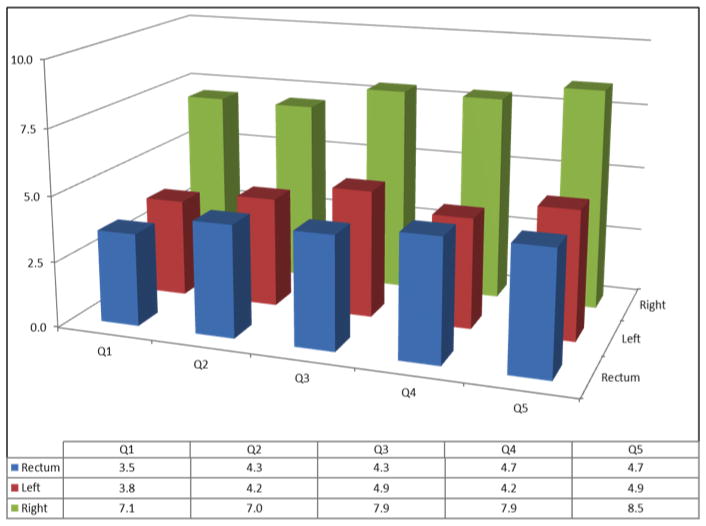
Incidence of Colorectal Cancer According to Socioeconomic Status and Location of Tumors, NIH-AARP Study, 1995–2006
Figure 1A: PG=Postgraduate; Coll=College degree; HS=High school diploma; <12 years=<12 years of education
Figure 1B: Q1–Q5=Quintiles of education
Associations with CRC Incidence
Table 3 shows the age-sex adjusted CRC incidence and multivariable adjusted IRRs according to levels of each SES measure. The incidence of CRC increased with decreasing levels of neighborhood SES or educational achievement. The differences in CRC incidence across levels of education were significant after adjusting for Model 1 covariates: people with <12 years of education had a 42% higher risk of incidence of CRC (IRR: 1.42, CI 1.29–1.56) compared to those with a postgraduate education. The association was attenuated to an IRR of 1.19 times [CI: 1.07–1.31] after further adjustment for behavioral factors and neighborhood SES (Model 2). Similarly, people who resided in the poorest neighborhoods (census-tracts) had a 31% higher CRC risk (IRR: 1.31, CI: 1.19–1.45) after adjustment for Model 1 covariates; and remained significant and similarly attenuated by controlling for Model 2 covariates (IRR: 1.16, CI: 1.05–1.28).
Table 3.
Incidence of invasive adenocarcinoma of the colon/rectum according to socioeconomic status: NIH-AARP study, 1995–2006
| CRC Risk Factors | Participants, N (CRC cases) | Incidence* (per 10,000 person-years) | Incidence rate ratio (95% confidence interval) | |
|---|---|---|---|---|
| Model 1‡ | Model 2§ | |||
| Education | ||||
| Post-graduate (ref) | 103,164 (1,305) | 13.2 | - | - |
| College degree | 98,292 (1,408) | 15.0 | 1.12 (1.04–1.21) | 1.07 (0.99–1.15) |
| Some college | 120,507 (1,815) | 15.9 | 1.25 (1.17–1.35) | 1.13 (1.05–1.22) |
| Post-high school | 51,612 (857) | 17.6 | 1.33 (1.22–1.44) | 1.19 (1.09–1.30) |
| High school | 101,580 (1,681) | 17.5 | 1.33 (1.23–1.43) | 1.16 (1.08–1.26) |
| <12 years | 31,333 (610) | 21.2 | 1.42 (1.29–1.57) | 1.19 (1.07–1.31) |
| P-value for trend | <0.001 | <0.001 | ||
| Neighbor Deprivation | ||||
| Q1 [Least deprived] (ref) | 150,389 (2,086) | 14.5 | - | - |
| Q2 | 132,342 (1,975) | 15.7 | 1.06 (1.00–1.13) | 1.00 (0.94–1.07) |
| Q3 | 111,485 (1,803) | 17.2 | 1.17 (1.09–1.25) | 1.07 (1.00–1.14) |
| Q4 | 77,619 (1,224) | 16.8 | 1.18 (1.09–1.26) | 1.06 (0.98–1.14) |
| Q5 [most deprived] | 34,653 (588) | 18.1 | 1.31 (1.19–1.45) | 1.16 (1.05–1.28) |
| P-value for trend | <0.001 | 0.002 | ||
The incidence rate estimates were adjusted for age and sex.
Model 1 adjusted for covariates age, sex, race and ethnicity and family history of CRC in a first degree relative, and state of residence (Model 1).
The full models also included simultaneously adjusted for all behavioral factors, education and neighborhood deprivation.
Low-SES increased the risk of CRC irrespective of tumor location (see Figure 1). In analyses controlling for Model 1 covariates, compared to those with post-graduate education, people with <12 years of education had a higher risk of CRC at all three locations of the colon/rectum, but the effect size was larger in the rectum (IRR: 1.64, CI: 1.35–1.98) and left colon (IRR: 1.58, CI: 1.31–1.90) than in the right colon (IRR: 1.27, CI: 1.10–1.46) (data not shown). Similar patterns of risks were observed for neighborhood SES. Compared to the first quintile, the IRR (CI) was 1.52 (1.26–1.84) for rectal cancers, 1.38 (1.15–1.66) for left colon cancers and 1.19 (1.03–1.37) for right colon cancers. In the analyses shown in Table 4 using Model 2, the association between education and CRC incidence remained statistically significant for rectal and left colon cancers, but not for right colon cancers. Neighborhood SES was significantly associated with CRC incidence in the rectum, but not in the left or right colon.
Table 4.
Adjusted Association between Neighborhood Deprivation, Education, and Colorectal Cancer Incidence by Tumor Location, NIH-AARP Study, 1995–2006
| Socioeconomic measure | Incidence rate ratio (95% confidence interval) by tumor location§
|
||
|---|---|---|---|
| Right colon (3,576 cases) | Left colon (2.050 cases) | Rectum (1,991 cases) | |
| Education | |||
| Post-graduate (ref) | - | - | - |
| College degree | 1.05 (0.94–1.17) | 1.16 (1.00–1.35) | 1.02 (0.87–1.19) |
| Some college | 1.02 (0.92–1.14) | 1.19 (1.03–1.37) | 1.30 (1.12–1.50) |
| Post-high school | 1.08 (0.95–1.22) | 1.36 (1.15–1.61) | 1.26 (1.06–1.51) |
| High school | 1.00 (0.89–1.11) | 1.30 (1.12–1.51) | 1.40 (1.21–1.63) |
| <12 years | 1.07 (0.93–1.24) | 1.29 (1.06–1.56) | 1.36 (1.11–1.65) |
| P-value for trend | 0.77 | <0.001 | <0.001 |
| Neighbor Deprivation | |||
| Q1 [Least deprived] (ref) | - | - | - |
| Q2 | 0.93 (0.85–1.02) | 1.01 (0.89–1.14) | 1.11 (0.98–1.26) |
| Q3 | 1.02 (0.93–1.12) | 1.14 (1.00–1.29) | 1.10 (0.96–1.26) |
| Q4 | 1.02 (0.92–1.14) | 0.99 (0.86–1.15) | 1.20 (1.04–1.39) |
| Q5 [most deprived] | 1.08 (0.94–1.25) | 1.18 (0.98–1.43) | 1.31 (1.08–1.59) |
| P-value for trend | 0.17 | 0.15 | 0.004 |
Estimates obtained from Poisson regression models that simultaneously adjusted for age, sex, race and ethnicity, family history of CRC and state of residence, behavioral factors, neighborhood SES and education.
Sensitivity analyses
Analyses that considered use of aspirin and other NSAIDs, alcohol use, including beer consumption, or history of diabetes did not change our findings. The 53,764 participants excluded from our primary analyses because of missing data were similar in age (62.6 vs. 62.1 years) to those analyzed, but had more women (44.2% vs. 39.7%) and a slightly higher cumulative incidence of CRC (1.6% vs. 1.5%). Those excluded also had lower educational achievement. Our findings did not change when we performed the analyses using missing value dummies or multiple imputation techniques to retain those with missing values.
DISCUSSION
Colorectal cancer (CRC) is the second most common cancer in the United States and the third most common worldwide.18, 19 In this large US prospective cohort study, with over 10 years of follow-up, we were able to simultaneously examine the association between self-reported educational achievement and neighborhood SES and incidence of CRC. We found that people in low-SES by both SES measures had a higher risk of developing clinically detectable CRC, even after accounting for other CRC risk factors. SES disparities were higher for rectal and left colon cancers than for the right colon cancers.
We are not aware of any previous US studies of a similar design for direct comparison. However, some of our findings are in accord with previous studies, only one of which was prospective in design.2–9, 18 In the analysis of the Nurse’s Health study, Kim et al. found neighborhood-SES disparities in incidence for rectal cancer. However, in cases of colon cancer, the authors found that neighborhood-SES disparities in incidence were only apparent in nurses with at least a bachelor’s degree.9 Although in our analyses, we also found that the associations were stronger for rectal cancers than for colon cancers, we did not find an interaction between education and neighborhood SES. In contradistinction to that study, we examined the left colon separately from the right, and found a graded difference in incidence from the rectum to the right colon. In the latter, the association was not statistically significant after adjustment for health behaviors. This finding is consistent with potential mediation of the association between SES and CRC risk by health behaviors.9 The differences in the strength of the association between SES and CRC incidence in different parts of the colon may be due to differences in biology or carcinogenesis.10, 11, 20 It suggests that SES factors are weak predictors of right-sided cancers.
Our results also suggest that access to and use of health care services, likely contribute to the SES effect. Screening reduces the incidence of CRC, but studies also suggest that screening is more effective in the left colon and the rectum than in the right colon.21–23 People in low-SES have lower rates of CRC screening.24, 25 This may account for the large socioeconomic differences for tumors in the rectum and left colon and relatively small differences in the right colon. The extent to which differential use of screening contributes to SES disparities in CRC incidence was not considered in our analysis and needs further study.
The neighborhood socioeconomic measures collected from census data in 2000 may be a limitation of our study, since the measure did not take into account changes in place of residence from baseline. However, any misclassification of participants’ SES is likely to be non-differential, which further strengthens our findings. Our study population was relatively homogenous with predominantly older, upper-to-middle class Americans in urban centers: non-whites comprised a relatively small proportion of our sample. This may limit the generalizability of this study. Thus, future studies in more diverse populations with more measures of SES, including occupation and income, may be needed to establish the full impact of SES on CRC incidence. That said, our study had a wider SES range than has been reported in previous prospective studies of SES and CRC incidence in the US.9 A particular strength of this study is the data on a large number of risk factors typically not available in other data sets, and linkage of a large cohort with tumor registry data. This allowed us to examine invasive adenocarcinomas as opposed to any CRC, including separate analysis by tumor location.
There are important implications of this study for the burden of CRC in the US. Data from the SEER cancer registry show that the incidence of CRC in the US in whites fell below that of blacks in 1987 and this black-white gap has persisted since then. Unfortunately, there are no comparable data by SES. However, the available data by race and ethnicity suggests that, in the US, CRC will remain a disease of the poor, creating a situation of high rates of disease in populations with limited access to early detection and treatment. This is a potentially serious public problem, particularly as tough economic times widen the socioeconomic gap between rich and poor. Therefore, concerted efforts in promotion of healthy behavior and access to care are needed in low-SES populations to slow potentially widening disparities in coming years.
In conclusion, this study showed that people in low-SES had a disproportionately high CRC incidence independent of the effects of individual-level CRC risk factors. The disparity in incidence of CRC by SES was more pronounced for rectal and left colon cancers than for cancers in the right colon.
Acknowledgments
Funding Support: The NIH-AARP study was conducted as part of an Intramural Research Program of the NIH/National Cancer Institute. The following authors were supported by grants from the National Cancer Institute/NIH: Doubeni (5K01CA127118-02 & 5U01CA151736); Laiyemo (5U54CA091431-09 S1) and Schootman and Lian (R01CA137750).
Cancer incidence data from the Atlanta metropolitan area were collected by the Georgia Center for Cancer Statistics, Department of Epidemiology, Rollins School of Public Health, Emory University. Cancer incidence data from California were collected by the California Department of Health Services, Cancer Surveillance Section. Cancer incidence data from the Detroit metropolitan area were collected by the Michigan Cancer Surveillance Program, Community Health Administration, State of Michigan. The Florida cancer incidence data used in this report were collected by the Florida Cancer Data System (FCDC) under contract with the Florida Department of Health (FDOH). The views expressed herein are solely those of the authors and do not necessarily reflect those of the FCDC or FDOH. Cancer incidence data from Louisiana were collected by the Louisiana Tumor Registry, Louisiana State University Medical Center in New Orleans. Cancer incidence data from New Jersey were collected by the New Jersey State Cancer Registry, Cancer Epidemiology Services, New Jersey State Department of Health and Senior Services. Cancer incidence data from North Carolina were collected by the North Carolina Central Cancer Registry. Cancer incidence data from Pennsylvania were supplied by the Division of Health Statistics and Research, Pennsylvania Department of Health, Harrisburg, Pennsylvania. The Pennsylvania Department of Health specifically disclaims responsibility for any analyses, interpretations or conclusions. Cancer incidence data from Arizona were collected by the Arizona Cancer Registry, Division of Public Health Services, Arizona Department of Health Services. Cancer incidence data from Texas were collected by the Texas Cancer Registry, Cancer Epidemiology and Surveillance Branch, Texas Department of State Health Services.
We are indebted to the participants in the NIH-AARP Diet and Health Study for their outstanding cooperation. We also thank Sigurd Hermansen and Kerry Grace Morrissey from Westat for study outcomes ascertainment and management; Michael Spriggs and Leslie Carroll at Information Management Services for data support and analysis; and Melissa D’Andrea of UMMS for proofing and checking the manuscripts prior to submission.
Footnotes
The authors have no financial conflicts of interest.
Author Contributions
Dr. Doubeni conceptualized, designed and performed the analyses and was responsible for writing the manuscript. Drs. Laiyemo, Major, Schootman and Sinha participated in the conceptualization, design and interpretation of the data. Dr. Lian participated in the conceptualization. Drs. Park and Hollenbeck guided study design and interpretation of findings. Dr. Graubard participated in conceptualization, analysis and interpretation of findings.
References
- 1.Siegel R, Ward E, Brawley O, Jemal A. Cancer statistics, 2011: The impact of eliminating socioeconomic and racial disparities on premature cancer deaths. CA: a cancer journal for clinicians. 2011;61(4):212–36. doi: 10.3322/caac.20121. Available from http://www.ncbi.nlm.nih.gov/pubmed/21685461. [DOI] [PubMed] [Google Scholar]
- 2.Siegel RL, Jemal A, Thun MJ, Hao Y, Ward EM. Trends in the incidence of colorectal cancer in relation to county-level poverty among blacks and whites. J Natl Med Assoc. 2008;100(12):1441–4. doi: 10.1016/s0027-9684(15)31544-3. Available from http://www.ncbi.nlm.nih.gov/entrez/query.fcgi?cmd=Retrieve&db=PubMed&dopt=Citation&list_uids=19110912. [DOI] [PubMed] [Google Scholar]
- 3.Singh GK, Miller BA, Hankey BF, Edwards BK. NCI Cancer Surveillance Monograph Series, Number 4. Bethesda, MD: National Cancer Institute; 2003. Area Socioeconomic Variations in U.S. Cancer Incidence, Mortality, Stage, Treatment, and Survival, 1975–1999. NIH Publication No. 03-5417. [Google Scholar]
- 4.Yin D, Morris C, Allen M, Cress R, Bates J, Liu L. Does socioeconomic disparity in cancer incidence vary across racial/ethnic groups? Cancer Causes Control. 2010;21(10):1721–30. doi: 10.1007/s10552-010-9601-y. Available from http://www.ncbi.nlm.nih.gov/pubmed/20567897. [DOI] [PMC free article] [PubMed] [Google Scholar]
- 5.Krieger N, Quesenberry C, Jr, Peng T, Horn-Ross P, Stewart S, Brown S, et al. Social class, race/ethnicity, and incidence of breast, cervix, colon, lung, and prostate cancer among Asian, Black, Hispanic, and White residents of the San Francisco Bay Area, 1988–92 (United States) Cancer Causes Control. 1999;10(6):525–37. doi: 10.1023/a:1008950210967. Available from http://www.ncbi.nlm.nih.gov/entrez/query.fcgi?cmd=Retrieve&db=PubMed&dopt=Citation&list_uids=10616822. [DOI] [PubMed] [Google Scholar]
- 6.Brown J, Harding S, Bethune A, Rosato M. Longitudinal study of socioeconomic differences in the incidence of stomach, colorectal and pancreatic cancers. Popul Trends. 1998;(94):35–41. Available from http://www.ncbi.nlm.nih.gov/pubmed/9885835. [PubMed]
- 7.Baquet CR, Horm JW, Gibbs T, Greenwald P. Socioeconomic factors and cancer incidence among blacks and whites. J Natl Cancer Inst. 1991;83(8):551–7. doi: 10.1093/jnci/83.8.551. Available from http://www.ncbi.nlm.nih.gov/entrez/query.fcgi?cmd=Retrieve&db=PubMed&dopt=Citation&list_uids=2005640. [DOI] [PubMed] [Google Scholar]
- 8.Clegg LX, Reichman ME, Miller BA, Hankey BF, Singh GK, Lin YD, et al. Impact of socioeconomic status on cancer incidence and stage at diagnosis: selected findings from the surveillance, epidemiology, and end results: National Longitudinal Mortality Study. Cancer Causes Control. 2009;20(4):417–35. doi: 10.1007/s10552-008-9256-0. Available from http://www.ncbi.nlm.nih.gov/entrez/query.fcgi?cmd=Retrieve&db=PubMed&dopt=Citation&list_uids=19002764. [DOI] [PMC free article] [PubMed] [Google Scholar]
- 9.Kim D, Masyn KE, Kawachi I, Laden F, Colditz GA. Neighborhood socioeconomic status and behavioral pathways to risks of colon and rectal cancer in women. Cancer. 2010;116(17):4187–96. doi: 10.1002/cncr.25195. Available from http://www.ncbi.nlm.nih.gov/pubmed/20544839. [DOI] [PMC free article] [PubMed] [Google Scholar]
- 10.Deng G, Kakar S, Tanaka H, Matsuzaki K, Miura S, Sleisenger MH, et al. Proximal and distal colorectal cancers show distinct gene-specific methylation profiles and clinical and molecular characteristics. European journal of cancer. 2008;44(9):1290–301. doi: 10.1016/j.ejca.2008.03.014. Available from http://www.ncbi.nlm.nih.gov/pubmed/18486467. [DOI] [PubMed] [Google Scholar]
- 11.Freeman HJ. Heterogeneity of colorectal adenomas, the serrated adenoma, and implications for screening and surveillance. World journal of gastroenterology : WJG. 2008;14(22):3461–3. doi: 10.3748/wjg.14.3461. Available from http://www.ncbi.nlm.nih.gov/pubmed/18567071. [DOI] [PMC free article] [PubMed] [Google Scholar]
- 12.Schatzkin A, Subar AF, Thompson FE, Harlan LC, Tangrea J, Hollenbeck AR, et al. Design and serendipity in establishing a large cohort with wide dietary intake distributions : the National Institutes of Health-American Association of Retired Persons Diet and Health Study. Am J Epidemiol. 2001;154(12):1119–25. doi: 10.1093/aje/154.12.1119. Available from http://www.ncbi.nlm.nih.gov/entrez/query.fcgi?cmd=Retrieve&db=PubMed&dopt=Citation&list_uids=11744517. [DOI] [PubMed] [Google Scholar]
- 13.Doubeni CA, Schootman M, Major JM, Torres Stone RA, Laiyemo AO, Park Y, et al. Health Status, Neighborhood Socioeconomic Context, and Premature Mortality in the United States: The National Institutes of Health-AARP Diet and Health Study. Am J Public Health. 2011:e1–e9. doi: 10.2105/AJPH.2011.300158. Available from http://www.ncbi.nlm.nih.gov/pubmed/21852636. [DOI] [PMC free article] [PubMed]
- 14.Major JM, Doubeni CA, Freedman ND, Park Y, Lian M, Hollenbeck AR, et al. Neighborhood socioeconomic deprivation and mortality: NIH-AARP diet and health study. PLoS One. 2010;5(11):e15538. doi: 10.1371/journal.pone.0015538. Available from http://www.ncbi.nlm.nih.gov/entrez/query.fcgi?cmd=Retrieve&db=PubMed&dopt=Citation&list_uids=21124858. [DOI] [PMC free article] [PubMed] [Google Scholar]
- 15.Thompson FE, Kipnis V, Midthune D, Freedman LS, Carroll RJ, Subar AF, et al. Performance of a food-frequency questionnaire in the US NIH-AARP (National Institutes of Health-American Association of Retired Persons) Diet and Health Study. Public Health Nutr. 2008;11(2):183–95. doi: 10.1017/S1368980007000419. Available from http://www.ncbi.nlm.nih.gov/entrez/query.fcgi?cmd=Retrieve&db=PubMed&dopt=Citation&list_uids=17610761. [DOI] [PubMed] [Google Scholar]
- 16.Reedy J, Mitrou PN, Krebs-Smith SM, Wirfalt E, Flood A, Kipnis V, et al. Index-based dietary patterns and risk of colorectal cancer: the NIH-AARP Diet and Health Study. Am J Epidemiol. 2008;168(1):38–48. doi: 10.1093/aje/kwn097. Available from http://www.ncbi.nlm.nih.gov/entrez/query.fcgi?cmd=Retrieve&db=PubMed&dopt=Citation&list_uids=18525082. [DOI] [PMC free article] [PubMed] [Google Scholar]
- 17.Frome EL. The analysis of rates using Poisson regression models. Biometrics. 1983;39(3):665–74. Available from http://www.ncbi.nlm.nih.gov/entrez/query.fcgi?cmd=Retrieve&db=PubMed&dopt=Citation&list_uids=6652201. [PubMed] [Google Scholar]
- 18.American Cancer Society. Colorectal Cancer Facts and Figures 2010–2013. Atlanta, GA: American Cancer Society; 2011. [Google Scholar]
- 19.Vainio H, Miller AB. Primary and secondary prevention in colorectal cancer. Acta oncologica. 2003;42(8):809–15. doi: 10.1080/02841860310010673. Available from http://www.ncbi.nlm.nih.gov/pubmed/14968941. [DOI] [PubMed] [Google Scholar]
- 20.Rex DK, Eid E. Considerations regarding the present and future roles of colonoscopy in colorectal cancer prevention. Clinical gastroenterology and hepatology: the official clinical practice journal of the American Gastroenterological Association. 2008;6(5):506–14. doi: 10.1016/j.cgh.2008.02.025. Available from http://www.ncbi.nlm.nih.gov/pubmed/18455696. [DOI] [PubMed] [Google Scholar]
- 21.Atkin W, Kralj-Hans I, Wardle J, Duffy S. Randomised trials of flexible sigmoidoscopy. BMJ. 2010;341:c4618. doi: 10.1136/bmj.c4618. Available from http://www.ncbi.nlm.nih.gov/entrez/query.fcgi?cmd=Retrieve&db=PubMed&dopt=Citation&list_uids=20736284. [DOI] [PubMed] [Google Scholar]
- 22.Mandel JS, Church TR, Bond JH, Ederer F, Geisser MS, Mongin SJ, et al. The effect of fecal occult-blood screening on the incidence of colorectal cancer. N Engl J Med. 2000;343(22):1603–7. doi: 10.1056/NEJM200011303432203. Available from http://www.ncbi.nlm.nih.gov/entrez/query.fcgi?cmd=Retrieve&db=PubMed&dopt=Citation&list_uids=11096167. [DOI] [PubMed] [Google Scholar]
- 23.Brenner H, Hoffmeister M, Arndt V, Stegmaier C, Altenhofen L, Haug U. Protection from right- and left-sided colorectal neoplasms after colonoscopy: population-based study. J Natl Cancer Inst. 2010;102(2):89–95. doi: 10.1093/jnci/djp436. Available from http://www.ncbi.nlm.nih.gov/entrez/query.fcgi?cmd=Retrieve&db=PubMed&dopt=Citation&list_uids=20042716. [DOI] [PubMed] [Google Scholar]
- 24.Doubeni CA, Laiyemo AO, Klabunde CN, Young AC, Field TS, Fletcher RH. Racial and ethnic trends of colorectal cancer screening among Medicare enrollees. Am J Prev Med. 2010;38(2):184–91. doi: 10.1016/j.amepre.2009.10.037. Available from http://www.ncbi.nlm.nih.gov/entrez/query.fcgi?cmd=Retrieve&db=PubMed&dopt=Citation&list_uids=20117575. [DOI] [PMC free article] [PubMed] [Google Scholar]
- 25.Doubeni CA, Laiyemo AO, Reed G, Field TS, Fletcher RH. Socioeconomic and racial patterns of colorectal cancer screening among Medicare enrollees in 2000 to 2005. Cancer Epidemiol Biomarkers Prev. 2009;18(8):2170–5. doi: 10.1158/1055-9965.EPI-09-0104. Available from http://www.ncbi.nlm.nih.gov/entrez/query.fcgi?cmd=Retrieve&db=PubMed&dopt=Citation&list_uids=19622721. [DOI] [PMC free article] [PubMed] [Google Scholar]
- 26.Surveillance, Epidemiology, and End Results (SEER) Program (www.seer.cancer.gov) SEER*Stat Database: Incidence - SEER 17 Regs Research Data + Hurricane Katrina Impacted Louisiana Cases, Nov 2009 Sub (1973–2007 varying), National Cancer Institute, DCCPS, Surveillance Research Program, Cancer Statistics Branch, released April 2010, based on the November 2009 submission.