

Abstract
Expression of a NUP98-HOXD13 (NHD13) fusion gene leads to myelodysplastic syndrome in mice. In addition to ineffective hematopoiesis, we observed that NHD13 mice were lymphopenic; the lymphopenia was due to a decrease in both T and B lymphocytes. Although the pro-B cell (B220+/CD43+) populations from the NHD13 and wild-type (WT) mice were similar, the NHD13 mice showed decreased pre-B cells (B220+/CD43−), indicating impaired differentiation at the pro-B to pre-B stage. Thymi from NHD13 mice were smaller and overexpressed Hoxa cluster genes, including Hoxa7, Hoxa9, and Hoxa10. In addition, the NHD13 thymi contained fewer thymocytes, with an increased percentage of CD4−/CD8− (DN) cells and a decreased percentage of CD4+/CD8+ (DP) cells; the DN1/DN2 population was increased and the DN3/DN4 population was decreased, suggesting a partial block at the DN2 to DN3 transition. To determine clonality of the thymocytes, we used degenerate RT-PCR to identify clonal Tcrb gene rearrangements. 5 of 6 NHD13 thymi showed an unusual Tcrb gene rearrangement pattern with common, clonal DJ rearrangements but distinct V-D junctions, suggesting a marked clonal expansion of thymocytes that had undergone a DJ rearrangement, but not completed a VDJ rearrangement. Taken together, these findings demonstrate that expression of the NHD13 transgene inhibits lymphoid as well as myeloid and erythroid differentiation, results in overexpression of Hoxa cluster genes, and leads to a pre-T lymphoblastic leukemia/lymphoma (pre-T LBL).
Keywords: NUP98, HOXD13, HOXA9, myelodysplastic syndrome, T-lymphocyte, B-lymphocyte
Introduction
The myelodysplastic syndromes (MDS) represent a heterogeneous group of clonal disorders of hematopoiesis, characterized by peripheral blood cytopenias, hypercellular, dysplastic bone marrow, and a predilection for transformation to acute myelogenous leukemia. The assertion that MDS is a clonal disease is supported by observations which demonstrate over 50% of patients with MDS have one or more clonal cytogenetic abnormalities,(1) as well as studies demonstrating clonal X inactivation in informative female MDS patients.(2)
The involvement of the lymphoid compartment as a part of the MDS clone has been the topic of some debate. Patients with MDS often have a mild degree of lymphopenia, especially involving T-lymphocytes.(3) In addition, although rare, there are numerous case reports of acute lymphoblastic leukemia evolving from MDS,(4) suggesting the potential for the MDS clone to produce lymphoid cells. However, lymphocytes from patients with trisomy 8 or monosomy 7, two common cytogenetic abnormalities associated with MDS, typically do not contain the cytogenetic abnormality when analyzed by fluorescence in situ hybridization (FISH),(5, 6) although xenotransplant experiments with trisomy 8 cells have documented trisomy 8 in engrafted B-cells.(7) Using a 5q deletion (5q-) as a clonal marker, only 1 of 9 cases showed clear evidence of peripheral B-lymphocyte involvement in the MDS clone.(8) Intriguingly, the same authors found that almost all of the CD34+CD38− cells, and a large fraction (25–90%) of pro-B cells contained the 5q aberration.(8) These results demonstrate that the 5q aberration is present in the hematopoietic stem cell (HSC) compartment, and suggest that impaired B cell differentiation might account for the difficulty in detecting the 5q aberration in peripheral B lymphocytes.
Using a NUP98-HOXD13 (NHD13) fusion gene initially identified in patients with MDS,(9) we developed a mouse model which recapitulates all of the critical features of MDS including peripheral blood cytopenias, dysplasia, and transformation to acute leukemia. In addition to anemia and neutropenia, we noted that these mice were consistently lymphopenic, and that 10–30% of the NHD13 mice developed a precursor T-cell leukemia/lymphoma (pre-T LBL) with clonal T cell receptor β gene rearrangements.(10) In order to better understand the lymphopenia and T-cell malignancies in these mice, we characterized lymphoid differentiation abnormalities and clonal evolution of T-cells in the NHD13 mice.
Materials and Methods
Evaluation of clinically healthy mice
NHD13 transgenic (line G2 (10)) and wild type (WT) littermate control mice were maintained on a C57BL6 background and were 6 to 9 months old. In some experiments, an independent line of NHD13 mice (line C1 (10)), generated on an FVB/N background, were used to verify results obtained with the NHD13 line G2 mice. However, unless otherwise stated, all experiments were performed with the NHD13 line G2 mice. Peripheral blood (PB) was obtained from the tail vein using di-potassium EDTA (ethylenediaminetetraacetic acid) salt as an anticoagulant. Complete blood counts (CBCs) were determined using a HEMAVET Multispecies Hematology Analyzer (CDC Technologies, Oxford, CT). Serum IgM and IgG levels were evaluated by ELISA at Ani Lytics (Gaithersburg, MD). Bone marrow nucleated cells were obtained by flushing the femur and tibia of euthanized mice. All studies were approved by the NCI intramural animal care and use committee.
Flow cytometry and cell sorting
Single-cell suspensions from the thymus, spleen, PB and BM were stained with conjugated antibodies purchased from either BD Pharmingen (BD) (BD Biosciences, CA) or eBioscience (eB) (San Diego, CA). The cells were resuspended with Hank’s Balanced Salt Solution (HBSS) (Ca2+, Mg2+ free, Invitrogen, CA) containing 2% fetal bovine serum (FBS) (HF2) and incubated for 30 min on ice with the following antibodies: CD4-PE (BD), CD8-FITC (BD), B220-FITC (BD), IgM-PE (BD), CD25-PE (BD), CD44-FITC (BD), B220-APC (eB), CD43-FITC (eB), CD24-PECy5 (eB), BP1-PE (eB), IgD-PE (eB), and IgM-PECy5 (eB). Cells were washed twice with phosphate buffered saline (PBS) and resuspended with HF2 containing 1 μg/ml of propidium iodide (PI, [Sigma-Aldrich, MO]). Flow cytometry was performed using a dual laser FACScan (BD Biosciences) and data were analyzed using the CellQuest Pro software (BD Biosciences). For cell sorting, the FACSAria (BD Biosciences) was used.
Thymocyte viability and apoptosis assay
Thymocyte viability test was performed as described.(11) One million thymocytes were resuspended in RPMI 1640 supplemented with 10% FBS, 25 mM HEPES, 2 mM glutamine, penicillin (100 U/ml), streptomycin (100 μg/ml) and 50 μM 2-mercaptoethanol and incubated at 37°C in an atmosphere of 5% CO2. Aliquots were removed daily and viable cell counts performed using trypan blue dye exclusion. For the apoptosis assay, fresh thymocytes were stained with Annexin V-FITC (BD Biosciences) and PI (Sigma-Aldrich, MO) using the manufacturer’s recommended protocol, and analyzed with a dual laser FACScan (BD Biosciences). Thymocyte viable cell counts and apoptosis assays were performed in triplicate.
In vivo proliferation assay using 5-bromo-2-deoxyuridine (Brdu)
NHD13 and WT mice were injected intraperitoneally with 1mg BrdU in a volume of 0.5 mL (BrdU Flow kit; BD Biosciences-Pharmingen) and euthanized 24 hours later. A single cell thymocyte suspension was prepared and 2 × 10⁶ cells were stained for CD4, CD8, CD44, CD25 and BrdU (anti-BrdU-APC) using the manufacturer’s reagents and recommended protocols (BrdU Flow kit, BD Biosciences-Pharmingen).
Histologic analysis
Thymi were fixed in 10% neutral buffered formalin, embedded in paraffin, sectioned, and stained with Hematoxylin-eosin (H&E) for histological examination. Photomicrographs were taken with a Fuji FinePix 6800Z camera (Fuji, Tokyo, Japan) with a Carl Zeiss Standard 25 ICS microscope and a custom eyepiece adaptor (Accuscope, Frederick, MD). All original magnifications were either 100 × or 400 X.
T cell receptor (TCR) β gene rearrangements
TCRβ gene rearrangements were amplified for sequence analysis using degenerate RT-PCR.(12, 13) First strand cDNA was synthesized from 1 μg of total RNA using SuperScript™ II reverse transcriptase (Invitrogen) and the cDNA quality assessed by amplification of β-actin, (5-GTGGGCCGCTCTAGGCAACCAA-3 and 5-CTCTTTGATGTCACGCACGATTTC-3) primers. TCRβ mRNA was amplified using a degenerate Vβ region primer (5′-TAAGCGGCCGCATGSLYTGGTAYWXXCAG-3′; S = G or T, L = A, G, or T, Y = C or T, W = A or C, X = A or G) and a Cβ primer (5′-CCCACCAGCTCAGCTCCACGTGG-3′). The cycling parameters were 94°C for 2 min, and 3 cycles of 94°C for 1 min, 37°C for 1 min, and 72°C for 1 min, and 27 cycles of 94°C for 30 sec, 55°C for 30 sec, and 72°C for 1 min, followed by a terminal extension of 10 min at 72°C. The PCR products were gel purified and subcloned into pGEM-T Easy (Promega, Madison, WI). Individual plasmid clones were isolated for sequence analysis. For analysis of genomic DJ rearrangements, primers 5TCRBD1.2 (5′-CTTATCTGGTGGTTTCTTCCAGC-3′) and 3TCRBJ1S4.2 (5′-TTTACATACCCAGGACAGACAGC-3′) were used with genomic DNA templates.
Real-time quantitative RT-PCR analysis of gene expression
RNA was isolated from thymus and/or thymic tumor tissue using Trizol (Invitogen) reagent and the manufacturer’s recommended protocol. For some experiments, DN thymocytes were purified by the depletion of CD4+CD8+ double positive (DP), CD4 single positive (SP) and CD8 SP using the “MACS” system (Miltenyi Biotech, Bergisch Gladbach, Germany). Thymoctyes were stained for 15 minutes at 4°C with the micromagnetic bead conjugated antibodies, anti-CD4 and anti-CD8. After washing, the cells were magnetically separated using a MACS LS columns (Miltenyi Biotech). The purity was 94% to 99%. cDNA was synthesized from 1ug of RNA template, again using the manufacturer’s recommended protocol (Superscript II, Invitrogen). TaqMan probes for the following mouse genes were purchased from Applied Biosystems: HoxA10 (Mm00433966_m1), HoxA9 (Mm00439364_m1), and HoxA7 (Mm00657963_m1). Relative expression levels of target transcripts analyzed on an Applied Biosystems 7500 Fast real-time PCR system and normalized to the 18S ribosomal RNA using relative cycle time (Ct) value. For Tcrb real time quantification (RQ) PCR was performed using SYBR green (Fast 7500 real-time PCR system, Applied Biosystems). Relative quantification used the Tcrb and primers described above and normalized to actin (also described above). Thermal cycling parameters were 50°C for 2 min, 95 °C for 10 min and cycle steps of [95 °C for 15 sec, 60°C for 1 min] for 40 cycles.
Statistical analysis
Data are expressed as the mean ± standard errors of the mean (SEM) or standard deviation (SD) where applicable. Differences between groups were analyzed by student’s t-test. P-values less than 0.05 were considered to be significant.
Results
Both T and B lymphocyte numbers are decreased in peripheral blood from NHD13 mice
Similar to our prior observations, CBCs obtained from clinically healthy 6–9 month old NHD13 mice (line G2, generated on a C57Bl6 background) showed macrocytic anemia and leukopenia.(10) In this cohort of mice, the lymphopenia seen in the NHD13 mice was quite marked (2.21 vs. 8.72 K/μL, p<0.01) compared with wild type (WT) littermate controls (Supplemental Table S1). This lymphopenia was due to a decrease in both T and B cells. FACS analysis of peripheral blood (PB) and splenocytes from NHD13 mice revealed decreased numbers of CD4+ T-lymphocytes compared to WT controls (Figure 1A and B). In both the PB and spleen, there was a trend toward decreased numbers of CD8+ cells as well; however, this trend did not reach statistical significance (Figure 1A and B). Interestingly, although the absolute numbers of PB and spleen B220+ cells were similar between the NHD13 mice and WT controls, close inspection of the FACS plots (Figure 1D) demonstrated that the NHD13 B220+ cells were “dim”, suggesting that these were not normal, mature B cells. Moreover, although many of the WT B220+ cells in the PB or spleen were also positive for IgM, the NHD13 mice showed a dramatic decrease in the number of mature B220+/IgM+ B cells (Figure 1A and B). As expected given the decreased numbers of B220+/IgM+ cells, the NHD13 mice showed a significant decrease in circulating levels of IgG and IgM antibodies (Figure 1C). In addition, a small but detectable population of immature CD4+/CD8+ cells could now be detected in the NHD13 spleen (not shown).
Figure 1. NHD13 mice show decreased B and T lymphocytes in peripheral blood.
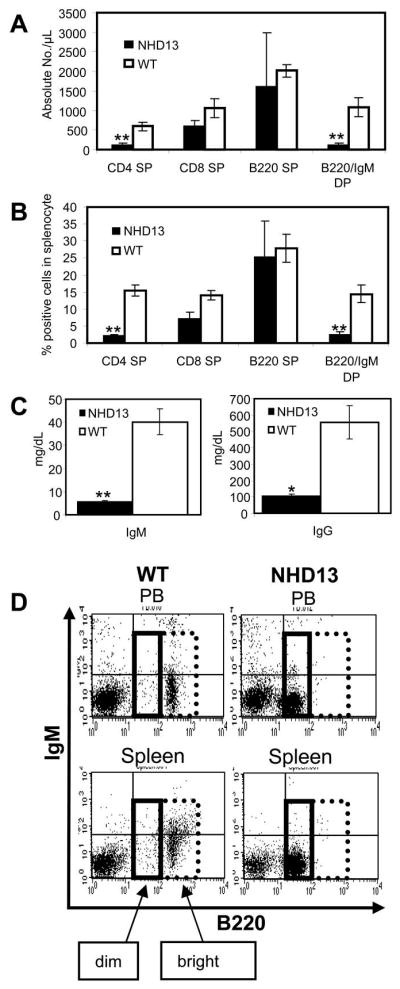
(A) FACS analysis of CD4/CD8 and IgM/B220 positive cells in peripheral blood (PB) from NHD13 mice (n=5) and wild type (WT) littermate controls (n=6). PB from NHD13 mice revealed a marked decrease in CD4 single positive (SP) and B220+/IgM+ cells compared to WT controls (** p<0.01). The decrease in CD8 SP cells was not statistically significant (p>0.05) (B) FACS analysis of CD4/CD8 and IgM/B220 positive splenocytes. Splenocytes from NHD13 mice (n=5) showed a marked decrease in CD4 SP and B220+/IgM+ cells compared to WT controls (n=6) (** p<0.01). The decrease in CD8 SP cells was not statistically significant (p>0.05) (C) NHD13 mice showed markedly decreased serum IgM and IgG (n=4, median age = 7 mo, *p<0.05, ** p<0.01). (D) Representative FACS plots of B220/IgM expression from WT and NHD13 mice (upper panel: PB, lower panel: spleen). NHD13 mice showed increased numbers of B220 “dim” (solid box) cells and decreased numbers of B220 “bright” (dotted box) cells compared to WT controls.
To exclude the possibility that the decreased numbers of mature lymphocytes was due to the integration site of the NHD13 transgene, we analyzed the lymphoid compartment in an independent line of transgenic mice (line C1), that were generated on an FVB/N background (10). As shown in supplemental figure S1, NHD13 mice generated on an FVB/N background also showed decreased numbers of circulating B and T cells. Similar to results obtained with the NHD13 line G2, the number of B220+/IgM+ cells in the spleen was decreased, and the spleen contained an increased proportion of B220 “dim” cells (Figure S1). These findings demonstrate that the impaired lymphoid development was not dependent on the integration site.
Impaired B-cell differentiation at the pro-B to pre-B stage
In order to better characterize the B-cell lymphopenia, we determined the developmental stages (“Hardy fractions”) of bone marrow B cells.(14) The mean total numbers of bone marrow cells were similar between WT and NHD13 mice (n = 5 each, median age = 6 months, 7.49 × 10⁷ cells for WT and 6.39 × 10⁷ cells for NHD13). Although the pro-B cell (B220+/CD43+) populations showed no clear differences between the NHD13 and WT BM (Figure 2), the NHD13 BM showed significantly decreased pre-B cell (B220+/CD43−) populations, suggesting impaired differentiation at the pro-B to pre-B stage of differentiation (Figure 2). A finer analysis showed an increase in the percentage of Hardy B fraction and a decrease in the Hardy C and C′ fractions, suggesting a partial block in differentiation at the Hardy B to Hardy C fraction stage of differentiation. Also, although there was a 6-fold reduction in the percentage of pre-B cells in the BM (3.22% vs. 0.55%, Figure 2B), the proportion of Hardy fractions D–F were similar between the NHD13 and WT mice (Figure 2A), suggesting that the pro-B cells that “escaped” the differentiation block were then able to mature normally.
Figure 2. Decreased number of pre-B cells in NHD13 BM.

(A) Representative FACS plots of pro-B and pre-B cells from NHD13 mice and WT controls. The percentage of pro-B cells (B220+/CD43+) are similar in the NHD13 and WT BM. NHD13 BM showed a decreased proportion of pre-B cells (B220+/CD43−). Hardy fractions A, B, C, C′, D, E, and F are indicated. (B) Statistical analysis of pooled data (n=5 NHD13 and 5 WT mice); pre-B cells (B220+/CD43−) were significantly decreased in NHD13 BM (**p<0.01).
NHD13 mice have small thymi, absent cortex, and decreased CD4+CD8+ thymocytes
We consistently observed a decrease in the size of the thymus from NHD13 mice compared to WT mice; representative gross morphology of a NHD13 mouse (7 months old) is shown in Figure 3A. As expected, the total number of thymocytes from NHD13 mice was also decreased compared to the WT thymi (1.75×10⁷ vs. 9.21×10⁷, p<0.01) (Figure 3B). Histologic examination showed that the NHD13 mice have no discernible medulla (Figure 3D), consistent with the observation that the NHD13 mice had decreased numbers of circulating mature T-lymphocytes (Figure 1A and 1B). Analysis of cell surface markers demonstrated a marked increase in the CD4−CD8− (DN) population (p<0.001) and a marked decrease in the CD4+CD8+ (DP) population (p<0.001) in the NHD13 mice compared to WT mice (Figure 3E). Further analysis of the DN population revealed a more variable increase in the DN1 (which may include a small number of lineage positive cells) and DN2 population, as well as a decrease in the DN3 and DN4 population in thymi from the NHD13 thymus, suggesting a partial block at the DN1 to DN2 or DN2 to DN3 transition (Figure 3F and G). Given that the absolute numbers of mature SP CD4 and CD8 cells were reduced in the NHD13 thymi, it was not surprising that microscopic examination of the NHD13 thymi revealed a markedly atretic medulla (Figure 3D). Again, to rule out a transgene integration effect, we analyzed an independent line of NHD13 mice (line C1(10)). As shown in Figure S1, the proportion of DP thymocytes was markedly reduced in the NHD13 mice, and the proportion of DN thymocytes markedly increased.
Figure 3. Impaired differentiation and decreased thymocyte number in NHD13 mice.

(A) Gross morphology of thymi from WT and NHD13 mice (age 7 months). (B) Decreased total number of thymocytes in NHD13 thymus (n=7 NHD13 and 7 WT mice, median age = 7 mo old, **p<0.01). (C) WT thymus (upper panel, original × 50; lower panel, original × 400) (D) NHD13 thymus (upper panel, original × 50; lower panel, original × 400) Note absent absent medulla in NHD13 thymus. (E) Representative FACS plots of thymocytes from WT and NHD13 mice stained with CD4, CD8, CD44, and CD25. The upper panel shows CD4 and CD8 distribution, and the lower panel shows CD44 and CD25 staining of DN cells. DN1, DN2, DN3, and DN4 populations are indicated. (F) Increased DN and decreased DP thymocytes from NHD13 mice (n= 7) compared to WT (n=9) mice aged 7–9 months, **p<0.01. (G) Analysis of DN subpopulations. Note the variable increase in the DN1 and DN2 population, as well as a decrease in the DN3 and DN4 population in thymi from the NHD13 thymi (n=7) compared to WT thymi (n=9), *p<0.05.
We investigated the stage(s) of differentiation that are most prominently inhibited by the NHD13 transgene, using in vivo proliferation assays with BrdU. As shown in Figure S2, the majority of BrdU positive NHD13 thymocytes were in the DN population, more specifically in the DN1 population. However, it should also be noted that a subset of thymocytes “escape” this partial block, and continue to proliferate, as evidenced by residual BrdU positive DN2, DN3, DN4 and DP thymocytes (Figure S2). These findings are most consistent with a partial block at the DN1 to DN2 transition.
To determine if an increased rate of apoptosis could account for the decreased total thymocyte number, we stained fresh thymocytes with Annexin V and propidium iodide (PI) to identify apoptotic cells. Although thymocytes from the NHD13 mice showed an increased Annexin V+/PI+ population (late apoptosis(15, 16), p=0.05), this difference was only marginally significant (Figure 4A). Reasoning that many of the apoptotic thymocytes might not be detected due to efficient clearance by tissue macrophages, we assayed thymocytes cultured in vitro for apoptosis. Thymocytes from the NHD13 mice died much more rapidly than did WT thymocytes; after 3 days of culture, there were 100-fold fewer viable thymocytes from the NHD13 mice (Figure 4B). The cells died due to an apoptotic process, as evidenced by increased Annexin V and PI positivity (Figure 4C). As expected from the cell survival curve (Figure 4B) there were dramatically more apoptotic thymocytes in the NHD13 wells compared to the WT wells; and almost 100% of thymocytes had undergone apoptosis by day 3 (Figure 4C and D).
Figure 4. Increased apoptosis of NHD13 thymocytes.

(A) Apoptosis assay of fresh thymocytes using Annexin V and propidium iodide (PI); late apoptotic (AnnexinV+/PI+) cells were increased in NHD13 thymi (n=5 NHD13 and 5 WT mice, *p=0.05). (B) In vitro culture of thymocytes demonstrates rapid death of NHD13 thymocytes (**p<0.01). (C) Percent apoptotic cells following in vitro culture. (**p<0.01).
Clonality of NHD13 thymocytes
Functional Tcrb transcripts result from the rearrangement of germline variable (V), diversity (D) and joining (J) region segments in the genomic DNA of the developing T-lymphocyte.(17, 18) This physical reconfiguration of genomic DNA can then serve as a marker for clonality of thymocytes that have undergone VDJ recombination. Therefore, to determine clonality of the NHD13 thymocyte population, we used degenerate RT-PCR to identify clonal Tcrb gene rearrangements (Supplemental Figure S3). As expected, the WT thymi showed polyclonal Tcrb gene rearrangements; of 40 clones analyzed, no two were identical (Supplemental Table S2). Since SCL/LMO1 double transgenic mice, which also showed a partial differentiation block at the DN to DP stage and developed pre-T LBL, showed evidence of oligoclonal thymocyte expansion prior to the onset of a frank malignancy,(11) we anticipated that we might find evidence for clonal or oligoclonal VDJ rearrangements in the NHD13 thymocytes harvested from clinically healthy (non-leukemic) mice. However, in the initial NHD13 thymus we analyzed (mouse 1079), only two out of 34 clones (79-1 and 79-113) had an identical VDJ rearrangement, suggesting that there was no significant clonal expansion of thymocytes that had completed VDJ rearrangement of the Tcrb locus (Table 1). Interestingly, close inspection of the VDJ junctions revealed a novel, surprising finding. Subclones 79-3, 79-15, 79-60, 79-109, 79-132, 79-137, and 79-138 had an identical D-J junction, with precisely the same “N-region” nucleotide addition (TATCTCCAATA), but distinct, non-clonal V-D junctions (Table 1). Moreover, a second group of 11 clones from mouse 1079 (subclones 79-2, 5, 8, 65, 84, 24, 108, 123, 124, 125, and 134) demonstrated a similar finding—identical D-J junctions, but distinct V-D junctions (Table 1). The most likely explanation for this “clonal DJ, distinct VD” pattern was that a thymocyte had undergone a marked clonal expansion following DJ rearrangement, but before V-D rearrangement.
Table 1.
Tcrb gene rearrangements from NHD13 thymi (mice 1079 and 1080)
| Sub-clone | V | N | D | N | J | IF | ||
|---|---|---|---|---|---|---|---|---|
|
| ||||||||
| 79-2b | V8S3 | AGCAGTGATga | CTTG | CAGGG | caAACACAGA | J1S1 | Y | |
| 79-5 | V8S3 | GTGCCAGCAgtgatg | CAGTAG | CAGGG | caAACACAGA | J1S1 | Y | |
| 79-8 | V8S3 | GTGCCAGCAgtgatg | GTGAGGG | AGGG | caAACACAGA | J1S1 | Y | |
| 79-65 | V8S3 | GTGCCAGCAGtgatg | GG | GGGACAGGG | caAACACAGA | J1S1 | N | |
| 79-84 | V8S3 | GTGCCAGCAGtgatg | GGGACAGGG | caAACACAGA | J1S1 | Y | ||
| 79-24 | V6S1 | GTGCCAGCAgtatag | CAGGG | caAACACAGA | J1S1 | Y | ||
| 79-108 | V8S3 | GTGCCAGCAGTGATG | GCTCC | GGGACAGGG | caAACACAGA | J1S1 | Y | |
| 79-123 | V8S3 | TGCCAGCagtgatg | CCC | GGGACAGGG | caAACACAGA | J1S1 | Y | |
| 79-124 | V8S3 | TGCCAGCAGTGATG | GCGTG | GGGACAGGG | caAACACAGA | J1S1 | Y | |
| 79-125 | V8S2 | GTGCCAGCGGTGATG | CTGAAA | ACAGGG | caAACACAGA | J1S1 | N | |
| 79-134 | V5S2 | TGTGCCAGCTCtctc | GACAGGG | caAACACAGA | J1S1 | Y | ||
| 79-3 | V8S3 | CAGTGATG | CGAGA | CAGGGG | TATCTCCAATA | TTCTGGAAATACGCT | J1S3 | Y |
| 79-15 | V8S2 | TGCCAGCGGtgatg | GGTGCC | GGGACAGGGG | TATCTCCAATA | TTCTGGAAATACGCT | J1S3 | Y |
| 79-60 | V8S2 | TGCCAGCGGTGATG | G | GGGACAGGGG | TATCTCCAATA | TTCTGGAAATACGCT | J1S3 | Y |
| 79-109 | V8S3 | TGCCAGCAGTGATG | CGA | GACAGGGG | TATCTCCAATA | TTCTGGAAATACGCT | J1S3 | Y |
| 79-132 | V2S1 | ACCTGCAGTGCaga | T | GGACAGGGG | TATCTCCAATA | TTCTGGAAATACGCT | J1S3 | Y |
| 79-137 | V8S2 | GTGCCAGCGGTGATG | GACAGG | TATCTCCAATA | TTCTGGAAATACGCT | J1S3 | Y | |
| 79-138 | V8S3 | GTGCCAGCAGTGATG | A | GGGACAGGGG | TATCTCCAATA | TTCTGGAAATACGCT | J1S3 | Y |
| 79-1 | V8S2 | GTGCCAGCGGTGATG | C | GACTGGGGG | ctcCTATGAACAGTA | J2S7 | Y | |
| 79-113 | V8S2 | GTGCCAGCGGTGATG | C | GACTGGGGG | ctcCTATGAACAGTA | J2S7 | Y | |
| 79-99 | V8S3 | CAGCAGTGAtg | CCC | GGGACAGGGG | caAACTCCGACTAC | J1S2 | Y | |
| 79-119 | V5S1 | TGTGCCAGCTCtctc | GC | GGACAG | CAAACTCCGACTAC | J1S2 | Y | |
| 79-6 | V8S2 | TGCCAGCGGTGAtg | AG | CTGGGGGG | AGA | ctcctatGAACAGTA | J2S7 | Y |
| 79-117 | V5S1 | TGTGCCAGCTCtctc | CT | TT | ctccTATGAACAGTA | J2S7 | Y | |
| 79-127 | V8S3 | GTGCCAGCAGTGATG | GGACTGGGGG | T | ctccTATGAACAGTA | J2S7 | Y | |
| 79-136 | V5S2 | TGTGCCAGCTCTCtc | CC | GGAC | AGGGGGCA | ctccTATGAACAGTA | J2S7 | Y |
| 79-149 | V5S1 | TGTGCCAGCTCTCTc | TGGGGGGG | T | ctcctaTGAACAGTA | J2S7 | Y | |
| 79-130 | V8S2 | GTGCCAGCGGTgatg | ACA | AATTT | ttcTGGAAATACGCT | J1S3 | Y | |
| 79-133 | V8S3 | TGCCAGCAgtgatg | TC | GACAGGGGGC | ttCTGGAAATACGCT | J1S3 | Y | |
| 79-143 | V8S3 | CAGCagtgatg | TCAG | GGGAC | ttctGGAAATACGCT | J1S3 | Y | |
| 79-100 | V6S1 | TGTGCCAGCagtatag | CCT | CT | AGGGGGGGGGGGA | TAACTATGCTGAGC | J2S1 | N |
| 79-120 | V8S3 | TGCCAGCAGTGATg | TGGGGG | TCT | AGTGCAGAAAC | J2S3 | Y | |
| 79-85 | V8S3 | GCCAGCAGTgatg | TAC | GGAC | AGGGGAGG | agtCAAAACAC | J2S4 | Y |
| 79-148 | V8S3 | CAGCAGTGATg | CC | GC | CG | AACCAAGACACCCAGT | J2S5 | Y |
|
| ||||||||
| 80-3-31 | V8S3 | GTGCCAGCTGTGATG | CC | GGGACA | CTCTT | tttcCAACGAAAG | J1S4 | Y |
| 80-3-47 | V8S3 | CCAGCAGTGatg | GGACA | CTCTT | tttcCAACGAAAG | J1S4 | Y | |
| 80-3-2 | V8S3 | GTGCCAGCAGTGATg | ACCG | CA | CTCTT | tttcCAACGAAAG | J1S4 | Y |
| 80-1 | V8S3 | GTGCCAGCAGTGatg | GACC | GGGACA | CTCTT | tttcCAACGAAAG | J1S4 | Y |
| 80-6 | V8S3 | GTGCCAGCagtgatg | GGGACA | CTCTT | tttcCAACGAAAG | J1S4 | Y | |
| 80-7 | V8S3 | GTGCCAGCAGTgatg | AGGC | GACA | CTCTT | tttcCAACGAAAG | J1S4 | Y |
| 80-3-94 | V8S3 | GTGCCAGCAGTGATG | AAGG | A | CTCTT | tttcCAACGAAAG | J1S4 | Y |
| 80-3-56 | V8S3 | GTGCCAGCAGTGATG | TGATAAGGA | GGACA | CTCTT | tttcCAACGAAAG | J1S4 | Y |
| 80-3-63 | V8S3 | TGTGCCAGCagtgatg | GGG | GGGACA | CTCTT | tttcCAACGAAAG | J1S4 | Y |
| 80-97 | V6S1 | GTGCCAGCAGTATAG | GGACA | CTCTT | tttcCAACGAAAG | J1S4 | Y | |
| 80-107 | V8S3 | TGCCAGCAGTGATG | CCCCCG | CA | CTCTT | tttcCAACGAAAG | J1S4 | Y |
| 80-108 | V6S1 | GCCAGCAGTATAG | GACA | CTCTT | tttcCAACGAAAG | J1S4 | Y | |
| 80-109 | V8S3 | TGCCAGCAGTGATG | CGGAC | GGGACA | CTCTT | tttcCAACGAAAG | J1S4 | Y |
| 80-113 | V8S2 | GTGCCAGCGGTGatg | GGACA | CTCTT | tttcCAACGAAAG | J1S4 | Y | |
| 80-112 | V8S3 | GTGCCAGCAGTGatg | CG | GGGACA | CTCTT | tttcCAACGAAAG | J1S4 | Y |
| 80-128 | V8S2 | TGCCAGCGGTGATG | GGAA | GGACA | CTCTT | tttcCAACGAAAG | J1S4 | Y |
| 80-131 | V8S3 | GTGCCAGCAGtgatg | ACAGAACC | GGGACA | CTCTT | tttcCAACGAAAG | J1S4 | Y |
| 80-3-21 | V14S1 | CTGGAGTCT | taacaacCAGGCTCCG | J1S5 | Y | |||
| 80-3-67 | V14S1 | CTGGAGTCT | taacaacCAGGCTCCG | J1S5 | Y | |||
| 80-3-85 | V8S2 | TGCCAGCGGtgatg | GATCA | GACTGGGG | A | agtgCAGAAACGC | J2S3 | Y |
| 80-3-93 | V8S2 | TGCCAGCGGtgatg | GATCA | GACTGGGG | A | agtgCAGAAACGC | J2S3 | Y |
| 80-99 | V8S2 | TGCCAGCGGTgatg | CCA | GAC | AGGGT | ctcctaTGAACAGT | J2S7 | Y |
| 80-123 | V8S2 | TGCCAGCGGTgatg | CCA | GAC | AGGGT | ctcctaTGAACAGT | J2S7 | Y |
| 80-17 | V8S3 | CAGCAGTGAtg | CAGGG | ATG | caaaCACAGAAG | J1S1 | Y | |
| 80-98 | V8S3 | CAGCAGTgatg | AAAGGCCGGA | GACAG | C | CAAACTCCGACTAC | J1S2 | Y |
| 80-3-91 | V8S2 | GCCAGCGGTgatg | C | GGACA | A | TTTCCAACGAAAG | J1S4 | Y |
| 80-32 | V8S3 | CAGCAGTGAtg | GGA | AGAA | tTCCTATAAT | J1S6 | Y | |
| 80-127 | V8S3 | GTGCCAGCAGTGatg | G | TG | ttcctATAATTCGC | J1S6 | Y | |
| 80-3-34 | V8S3 | CCCTGATGG…(98)…… | CA | GGGACTGGGG | CCCTCC | TAACTATGCT | J2S1 | Y |
| 80-103 | V5S1 | CCAGCTCTCTC | CCACA | GGGGGC | G | taacTATGCTGAGC | J2S1 | Y |
| 80-121 | V8S3 | GTGCCAGCAGTGatg | G | TT | CAAACACCGGGCAG | J2S2 | Y | |
| 80-3-40 | V8S3 | CAGCAGTGAtg | CTGGGGG | AGTCAAAACAC | J2S4 | Y | ||
| 80-105 | V8S2 | TGCCAGCGGTGATG | CAAA | GGACTGGGGGG | TCAG | agtcaAAACACCTTGT | J2S4 | Y |
| 80-124 | V8S3 | GTGCCAGCAGTGATG | GGAC | ACT | T | AGTCAAAACACCTTGT | J2S4 | Y |
| 80-111 | V8S3 | TGTGCCAGCAGTGatg | GC | GGGGC | aaccaAGACACCCAG | J2S5 | Y | |
| 80-5 | V8S2 | CAGCGGTGAtg | CTCA | GGGGGC | C | CTCCTATGAACAG | J2S7 | Y |
| 80-12 | V8S3 | GTGCCAGCAGTGATG | C | CTGGGGGGG | A | ctccTATGAACAG | J2S7 | Y |
| 80-116 | V8S3 | GTGCCAGCAGTgatg | CCT | GACTGGGG | CCT | ctcCTATGAACAGT | J2S7 | Y |
| 80-118 | V8S3 | GTGCCAGCAGTGATG | C | GGGAC | AA | ctccTATGAACAGT | J2S7 | Y |
| 80-126 | V8S3 | GTGCCAGCAGTGatg | GGGACTGGGGGGG | T | ctccTATGAACAGT | J2S7 | Y | |
Bold lower-case letters indicate nucleotides deleted from germline V, J segments. V,D, and J segments are underlined.
Clones outlined in grey display the “clonal D-J, distinct V-D” pattern.
“IF”, in-frame
This novel and characteristic “clonal DJ, distinct VD” pattern was reproduced in 4 of 5 additional NHD13 mice (#1080, 1084, 5078, and 5091); one mouse (#5051) showed only a clonal VDJ rearrangement (Table 1 and Supplemental Table S3). If the above hypothesis is correct (a thymocyte with a clonal DJ rearrangement expanded and divided numerous time before the subsequent V-D rearrangement), then it should be possible to detect a thymocyte clone which had the unique, clonal DJ rearrangement, but had not yet undergone V-D rearrangement, and therefore had a germline V-D configuration. To address this question, we performed PCR analysis on genomic DNA from two NHD13 thymi that showed the “clonal DJ, distinct VD” pattern (1079 and 1080), using primers 5′ of D1 (and thus deleted during V-D rearrangement) and 3′ of J1S4, as shown in Figure 5A. Based on the 2 predominant DJ rearrangements recovered in the subclones from mouse 1079 (Table 1), we would expect fragments of 648 bp, representing the D1-J1S3 fusion, and 1096 bp, representing the D1-J1S1 fusion, depicted schematically in Figure 5B. Using a similar analysis, we would expect a fragment of 146 bp (representing a D1-J1S4 fusion) in thymus DNA from mouse 1080. We would not expect any clonal rearrangements in the WT control thymus, but might recover polyclonal D1-J1S4 rearrangements. Clonal fragments as predicted were recovered from 1079 and 1080 thymic DNA (Figure 5C); these were sequenced and shown to contain the clonal D-J junctions shown in Table 1. The ~145 bp PCR product from the WT mouse (Figure 5C) was subcloned and 4 independent clones were sequenced; all contained different D1-J1S4 junctions, with unique N regions, indicating that these represented polyclonal D1-J1S4 Tcrb gene rearrangements (Supplemental Table S4).
Figure 5. Detection of alleles with clonal DJ rearrangments.

(A) Germline configuration of Tcrb locus; locations of V, D, and J segments are indicated. The location of primers 5TCRBD1.2 and 3TCRBJ1S4.2, 5′ of D1 and 3′ of J1S4 respectively, are depicted with horizontal arrows. (B) Configuration of predicted clonal DJ rearrangements for mice 1079 and 1080 based on sequence of V-DJ junctions. (C) PCR products corresponding to a 146 bp fragment from mouse 1080, and 648 and 1096 bp fragments from mouse 1079. The PCR products of ~145 bp from the WT control mouse represent polyclonal D1-J1S4 rearrangements (see text).
To determine whether thymocytes with the “clonal DJ, distinct VD” rearrangements could be detected in peripheral blood we studied spleens from mice # 1079, 1084 and 5051, all of which displayed the “clonal DJ, distinct VD” pattern in the thymus. Surprisingly, out of 47 Tcrb clones analyzed, none were derived from the known “clonal DJ, distinct VD” classes identified in the thymi of these mice (Supplemental Table S5), suggesting that the thymocytes with clonal DJ rearrangements did not mature and migrate from the thymus.
To evaluate which thymocyte population (ie, DN, DP, CD4SP, CD8SP) contains the “clonal DJ, distinct VD” thymocytes, we sorted thymocytes from NHD13 mouse (#5200) and assayed Tcrb gene rearrangements as described above (Supplemental Figure S2, Table 2). 13, 12, 19 and 16 Tcrb clones from DN, DP, CD4SP, and CD8 SP populations respectively (total 60) were sequenced. Of these 60 clones, 21 had unique VDJ rearrangements and will not be considered further. The remaining 39 clones could be placed into one of 10 classes. There were five distinct classes of “clonal DJ, distinct VD” thymocytes identified (classes 1–5, Table 2), and 5 smaller clonal VDJ expansions (classes 6–10, Table 2) identified. All four thymocyte subpopulations contained “clonal DJ, distinct VD” thymocytes. However, similar to previous findings, we did not identify any of these clonal expansions in splenic T-cells (34 clones analyzed, Supplemental Table S6).
Table 2.
Clonal Tcrb gene rearrangements from sorted thymocytes (NHD13 # 5200)
| Class | b Sub-clone | V | N | D | N | J | IF | ||
|---|---|---|---|---|---|---|---|---|---|
|
| |||||||||
| 1 | DN-2 | V8S3 | CTTCTGTGCCAGCAGTGATG | GCC | CTGGGGGG | TT | ataaCTATGCTGAGC | J2S1 | Y |
| DN-14 | V8S3 | CTTCTGTGCCAGCAGTGATG | GCC | CTGGGGGG | TT | taaCTATGCTGAGCA | J2S1 | Y | |
| DN-15 | V8S3 | CTTCTGTGCCAGCAGTGATG | GCC | CTGGGGGG | TT | taaCTATGCTGAGCA | J2S1 | Y | |
| 4SP-55 | V8S3 | CTTCTGTGCCAGCAGTGATG | GCC | CTGGGGGG | TT | taaCTATGCTGAGCA | J2S1 | Y | |
| 4SP-68 | V8S3 | CTTCTGTGCCAGCAGTGATG | GCC | CTGGGGGG | TT | taaCTATGCTGAGCA | J2S1 | Y | |
| 4SP-72 | V8S3 | CTTCTGTGCCAGCAGTGATG | GCC | CTGGGGGG | TT | taaCTATGCTGAGCA | J2S1 | Y | |
| DN-6 | V8S3 | TTCTGTGCCAGCAgtgatg | CTT | CTGGGGGG | TT | taaCTATGCTGAGCA | J2S1 | Y | |
| 8SP-13 | V8S3 | CTTCTGTGCCAGCAGTGATG | GCC | CTGGGGGG | TT | taaCTATGCTGAGCA | J2S1 | Y | |
| 4SP-39 | V8S3 | TTCTGTGCCAGCAGtgatg | AGACCTCCCCTTTACC | GGGACTGGGGGG | TT | taaCTATGCTGAGCA | J2S1 | Y | |
| 8SP-2 | V8S3 | TTCTGTGCCAGCAGtgatg | CCCCCCGGA | GGGGGG | TT | taaCTATGCTGAGCA | J2S1 | N | |
|
| |||||||||
| 2 | DN-21 | V8S3 | CTTCTGTGCCAGCAGTGATG | CAC | GGGACAGGGG | tttcCAACGAAAGA | J1S4 | Y | |
| DP-3 | V8S3 | CTTCTGTGCCAGCAGTGATG | CAC | GGGACAGGGG | tttcCAACGAAAGA | J1S4 | Y | ||
| DN-5 | V8S3 | CTTCTGTGCCAGCAGTGATG | CCCTCC | GGGACAGGGG | tttcCAACGAAAGA | J1S4 | Y | ||
| DP-7 | V8S3 | CTTCTGTGCCAGCAGTGATG | CAGGGCA | G | tttcCAACGAAAGA | J1S4 | Y | ||
| DP-15 | V8S3 | CTTCTGTGCCAGCAGTGATG | AAGG | CAGGGG | tttcCAACGAAAGA | J1S4 | Y | ||
| DP-16 | V8S3 | TTTCTGTGCCAGCAGTGATG | A | GGGACAGGGG | tttcCAACGAAAGA | J1S4 | Y | ||
| 4SP-45 | V8S3 | TTTCTGTGCCAGCAGTGATG | CGAA | ACAGGGG | tttcCAACGAAAGA | J1S4 | Y | ||
| 4SP-47 | V8S2 | TTTCTGTGCCAGCGGTGATG | ACAGGGG | tttcCAACGAAAGA | J1S4 | Y | |||
|
| |||||||||
| 3 | DN-9 | V5S1 | ACTTCTGTGCCAGCTCTCtc | CCCCGTCGACC | GGGACAGGGG | A | cAAACACAGAAGTC | J1S1 | Y |
| DP-4 | V8S3 | CTTCTGTGCCAGCAGTGAtg | GACAGGGG | A | cAAACACAGAAGTC | J1S1 | Y | ||
| DP-9 | V8S3 | CTTCTGTGCCAGCAGTGATG | CGAG | AGGGG | A | cAAACACAGAAGTC | J1S1 | Y | |
| DP-19 | V8S2 | TCTGTGCCAGCGGTGATg | CGG | AGGG | A | cAAACACAGAAGTC | J1S1 | Y | |
|
| |||||||||
| 4 | 8SP-5 | V8S3 | TTCTGTGCCAGCAGtgatg | GGACA | GGGA | TTCAGG | ctcctatgaacagtaCT | J2S7 | Y |
| 8SP-16 | V8S3 | CTTCTGTGCCAGCAGTGAtg | CG | GGGA | TTCAGG | ctcctatgaacagtaCT | J2S7 | Y | |
|
| |||||||||
| 5 | 8SP-10 | V8S3 | TTCTGTGCCAGCAGtgatg | AGCAATC | GACAGGG | TTCTGGAAATACGCT | J1S3 | Y | |
| 8SP-14 | V8S3 | CTTCTGTGCCAGCAGTGATG | AG | CAGGGGGC | TTCTGGAAATACGCT | J1S3 | Y | ||
|
| |||||||||
| 6 | DP-1 | V2S1 | CTGCACCTGCAGTGCAGA | TC | GGG | T | TAACTATGCTGAGCA | J2S1 | Y |
| DP-5 | V2S1 | CTGCACCTGCAGTGCAGA | TC | GGG | T | TAACTATGCTGAGCA | J2S1 | Y | |
|
| |||||||||
| 7 | DP-8 | V8S3 | CTTCTGTGCCAGCAGTGATG | AAA | GGACAGGGG | A | cAAACACAGAAGTC | J1S1 | Y |
| DP-21 | V8S3 | CTTCTGTGCCAGCAGTGATG | AAA | GGACAGGGG | A | cAAACACAGAAGTC | J1S1 | Y | |
|
| |||||||||
| 8 | 4SP-26 | V8S2 | TCTGTGCCAGCGGTGatg | CC | GGGACAG | CAAACACAGAAGTC | J1S1 | Y | |
| 4SP-66 | V8S2 | TCTGTGCCAGCGGTGatg | CC | GGGACAG | CAAACACAGAAGTC | J1S1 | Y | ||
|
| |||||||||
| 9 | 4SP-32 | V8S3 | CTTCTGTGCCAGCAGTGATg | TC | GGGACAG | AA | caaacacAGAAGTC | J1S1 | Y |
| 4SP-34 | V8S3 | CTTCTGTGCCAGCAGTGATg | TC | GGGACAG | AA | caaacacAGAAGTC | J1S1 | Y | |
| 4SP-52 | V8S3 | CTTCTGTGCCAGCAGTGATg | TC | GGGACAG | AA | caaacacAGAAGTC | J1S1 | Y | |
| 4SP-64 | V8S3 | CTTCTGTGCCAGCAGTGATg | TC | GGGACAG | AA | caaacacAGAAGTC | J1S1 | Y | |
| 4SP-65 | V8S3 | CTTCTGTGCCAGCAGTGATg | TC | GGGACAG | AA | caaacacAGAAGTC | J1S1 | Y | |
|
| |||||||||
| 10 | 4SP-70 | V8S2 | TCTGTGCCAGCGGTGatg | GGGACTGGGGGG | T | taaCTATGCTGAGCA | J2S1 | Y | |
| 4SP-71 | V8S2 | TCTGTGCCAGCGGTGatg | GGGACTGGGGGG | T | taaCTATGCTGAGC | J2S1 | Y | ||
Bold lower-case letters indicate nucleotides deleted from germline V, J segments. V,D, and J segments are underlined.
DN, DP, 4SP, and 8SP prefix indicate clones derived from the DN, DP, CD4 single positive, and CD8 single positive populations, respectively.
“IF”, in-frame
Overexpression of Hoxa cluster genes in thymus and pre-T LBL from NHD13 mice
Because overexpression of HOXA cluster genes, particularly HOXA9 has been linked to pre-T LBL in humans (19), and impaired lymphocyte differentiation in mice (20–22), we used RQ-PCR to assay expression of Hoxa7, 9, and 10 in NHD13 thymus. As shown in Figures 6 and S4, expression of Hoxa7, 9, and 10 was markedly increased in thymus from clinically healthy NHD13 mice, and was even higher in pre-T LBL that arose in NHD13 mice, consistent with the hypothesis that the NHD13 fusion may exert its oncogenic effect, at least in part, through Hoxa cluster genes including Hoxa7, 9, and 10. To rule out the possibility that the overexpression of Hoxa cluster genes was due to a transgene integration effect, we also showed a 30–100 fold increase in expression of the same Hoxa cluster genes in an independent transgenic line (C1), that was generated on a different mouse background (FVB/N) (Figure S4). To determine if the increase in Hoxa cluster genes was restricted to the more immature DN thymocyte population, we purified DN thymocytes from NHD13 and WT mice. RQ-PCR analysis demonstrated that expression of Hoxa7, 9, and 10 was 10–100 fold higher in NHD13 DN thymocytes compared to WT DN thymocytes (Figure S5). Furthermore, although levels of Hoxa7, 9, and 10 fell by 3–10 fold as WT DN thymocytes matured to DP and SP cells, elevated levels of Hoxa7, 9, and 10 persisted as the NHD13 DN thymocytes matured (Figure S5). There was no direct correlation between Hoxa7, 9, and 10 expression and Tcrb expression. Figure S6 shows that Tcrb expression in DN thymocytes from NHD13 mice was ~30 fold less than DN thymocytes from WT mice, consistent with the observation of a partial differentiation block at the DN1 to DN2 transition (Figures 3 and S2). However, thymocytes that “escape” this block are able to express CD4, CD8, and normal levels of Tcrb, despite ongoing overexpression of Hoxa7, 9, and 10 (Figure S5)
Figure 6. Expression of Hoxa7, Hoxa9, and Hoxa10 in thymus and pre-T LBL from NHD13 mice.

Relative expression is presented on a logarithmic scale. *indicates p<0.01. p value was unobtainable for Hoxa10 as only 1 of 3 WT thymus control samples expressed a detectable level of Hoxa10 mRNA.
Discussion
The results presented here demonstrate that a NUP98-HOXD13 (NHD13) fusion gene dramatically impairs differentiation of both B and T lymphocytes. Although the number of B220+/IgM− cells was similar between the NHD13 and WT mice, these B220+/IgM− cells were not normal B-cell precursors, as analysis of the FACS plot (Figure 1D) demonstrates that the B220+/IgM− population in the NHD13 mice consisted primarily of an abnormal B220dim population of cells. Although B220 (CD45R) is typically considered to be a B cell marker, B220 expression, often “dim”, has been detected on myeloid, macrophage, and natural killer precursors(23–26); therefore, it is conceivable that the B220dim cells detected in the NHD13 mice are not committed to the B-cell lineage. FACS analysis of NHD13 BM cells demonstrated a relative block in B-lymphocyte differentiation at the pro-B to pre-B cell transition.
In addition to impaired B-lymphocyte differentiation, the NHD13 mice also displayed small thymi and a decreased number of thymocytes. During normal T-lymphocyte differentiation, T-cells mature from DN1 to DN4 cells, and subsequently to DP cells in the thymic cortex and cortico-medullary junction. Final maturation of T-lymphocytes to SP CD4 or CD8 cells occurs in the medulla; upon final maturation the T-lymphocytes exit the thymus and seed peripheral lymphoid organs such as lymph nodes and spleen.(27) Microscopic examination of the NHD13 thymi demonstrated a markedly atretic medulla. Consistent with this finding, the number of DP and SP thymocytes were markedly reduced in the NHD13 thymi, whereas the number of immature DN cells, particularly the most immature DN1 and DN2 cells, were markedly increased in the NHD13 thymi, suggesting a partial block to differentiation at the DN1 to DN2 transition.
Functional Tcrb transcripts result from the rearrangement of germline variable (V), diversity (D) and joining (J) region genes in the genomic DNA of the T-lymphocyte, a process that also permits the generation of immense TCR diversity.(17, 18) Rearrangement of the TCRβ-chain begins with a DJ rearrangement at the DN2 stage, followed by a V-DJ rearrangement, which is required for progression to the DP stage of thymocyte development. Although we expected to detect evidence for clonal or oligoclonal Tcrb gene rearrangements in the thymi from NHD13 mice, we were surprised to find little evidence for clonal expansion of thymocytes with complete VDJ rearrangements. Instead, a novel pattern of VDJ rearrangements was identified, which consisted of an identical, clonal DJ rearrangement, and distinct V-DJ junction. This finding suggested that there was a marked clonal expansion of DN2 thymocytes that had “escaped” the partial DN1 to DN2 block, and had generated a DJ rearrangement, but not completed a VDJ rearrangement. Although this “clonal DJ, distinct VD” pattern has not previously been recognized in murine T-cells, a similar phenomenon has recently been reported to occur in human B lymphocytes.(28) In that study, leukemic B-lymphocytes from a twin with TEL-AML1 gene rearrangement and leukemia showed expansion of a clone with a complete VDJ recombination event, whereas B-lymphocytes from a clinically healthy twin showed the TEL-AML1 fusion and expansion of a clone that had an identical DJ fusion as the leukemic twin, without a complete V-DJ recombination event. These observations led to the hypothesis that the TEL-AML1 fusion exerted its oncogenic effect in a B-lymphocyte that had undergone D-J recombination, but not V-DJ recombination. Although none of the mice in this study developed T-ALL, several mice had evidence for clonal VDJ rearrangements in addition to the “clonal DJ, distinct VD” rearrangements, raising the possibility that these cells with a clonal VDJ rearrangement, might have expanded to become a clinically evident T-cell malignancy. In at least one case (mouse 5200, Table 2, class #1) a clonal VDJ expansion was derived from a parental clone with a “clonal DJ, distinct VD” pattern.
It is not clear why thymocytes with the “clonal DJ, distinct VD” pattern are abundant in the thymus, but undetected in the peripheral circulation. The Tcrb rearrangements for the vast majority of the “clonal DJ, distinct VD” thymocytes are in frame (Tables 1, 2, and S3). It is conceivable that the same event which leads to an increased clonal proliferation at the DJ rearrangement stage might inhibit or interfere with further maturation of the developing thymocyte, or might lead to a requirement for interaction with the thymic stroma.
We and others have previously shown that several Hoxa cluster genes, including Hoxa7, 9, 10, are overexpressed in NHD13 bone marrow(29, 30). Of these genes, overexpression of Hoxa9 has previously been linked to impaired B-lymphocyte (but not T-lymphocyte) differentiation,(20) and overexpression of Hoxa10 has been associated with impaired B and T lymphocyte differentiation in mice.(21, 22) In addition, overexpression of HOXA9 by several different mechanisms has been associated with pre-T LBL in clinical studies (19). We detected markedly increased expression of Hoxa7, 9, and 10 in thymus from clinically healthy NHD13 mice that was further increased in pre-T LBL that arose in the NHD13 mice, suggesting a role for Hoxa cluster gene overexpression in these malignancies. Although it is difficult to directly compare the aforementioned animal models of Hoxa overexpression, as only one of the mouse studies used a Hoxa transgene targeted specifically to the hematopoietic compartment,(20) it seems that the degree of B and T lymphocyte inhibition was more severe in the NHD13 mice than in mice that overexpress only Hoxa9 or Hoxa10 (20–22). This may be due to an additive effect caused by NHD13-induced overexpression of several Hoxa cluster genes simultaneously.
Although it is not clear why the NHD13 mice have a more dramatic decrease in T and B lymphocytes than is typically seen in patients with MDS, one plausible explanation is outlined below. Spontaneously occurring MDS is thought to be largely due to acquired, not inherited mutations. Thus patients with MDS generally have some level of residual, normal lympho-hematopoiesis, including long-lived T and B memory cells, which does not involve the MDS clone. However, since the NHD13 mice are generated by insertion of a transgene in the germline, they have no residual normal cells to provide normal lympho-hematopoiesis, and the only lymphoid cells that develop are relatively rare cells which “escape” the differentiation inhibition caused by the NHD13 transgene.
In summary, we demonstrated that NHD13 transgene inhibits lymphoid as well as myeloid and erythroid differentiation. In the B cell lineage, this inhibition results from a block at the pro-B to pre-B stage, and leads to a >5-fold decrease in circulating B cells and immunoglobulin levels. In the T-cell lineage, the inhibition occurs at the DN2-DN3 transition, and is associated with a marked overexpression of Hoxa7, Hoxa9 and Hoxa10. Similar to the situation seen in patients with pre-T LBL, overexpression of Hoxa7, Hoxa9, and Hoxa10 is associated with impaired thymocyte differentiation and leads to pre-T LBL. Finally, detailed analysis of NHD13 thymocytes revealed a marked expansion of thymocytes that had a D-J rearrangement, and generation of a large population of thymocytes with a common clonal D-J rearrangement, but distinct V-D rearrangements.
Supplementary Material
Acknowledgments
We would like to thank Dave Caudell, Helge Hartung, Sarah Beachy, R. Keith Humphries, and Warren Pear for insightful discussions.
This research was supported by the Intramural Research Program of the NIH, NCI.
Footnotes
Authorship:
Contribution: C.W.C. designed and performed research, analyzed data, and wrote the first draft of the manuscript. Y.J.C. designed and performed research and analyzed data. C.S. designed and performed research and analyzed data. P.D.A. designed research, analyzed data, and wrote the final draft of the manuscript.
References
- 1.Haase D, Germing U, Schanz J, Pfeilstocker M, Nosslinger T, Hildebrandt B, Kundgen A, Lubbert M, Kunzmann R, Giagounidis AA, Aul C, Trumper L, Krieger O, Stauder R, Muller TH, Wimazal F, Valent P, Fonatsch C, Steidl C. New insights into the prognostic impact of the karyotype in MDS and correlation with subtypes: evidence from a core dataset of 2124 patients. Blood. 2007;110:4385–4395. doi: 10.1182/blood-2007-03-082404. [DOI] [PubMed] [Google Scholar]
- 2.Gale RE. Evaluation of clonality in myeloid stem-cell disorders. Semin Hematol. 1999;36:361–372. [PubMed] [Google Scholar]
- 3.Hamblin T. Immunologic abnormalities in myelodysplastic syndromes. Hematol Oncol Clin North Am. 1992;6:571–586. [PubMed] [Google Scholar]
- 4.Disperati P, Ichim CV, Tkachuk D, Chun K, Schuh AC, Wells RA. Progression of myelodysplasia to acute lymphoblastic leukaemia: implications for disease biology. Leuk Res. 2006;30:233–239. doi: 10.1016/j.leukres.2005.06.011. [DOI] [PubMed] [Google Scholar]
- 5.Gerritsen WR, Donohue J, Bauman J, Jhanwar SC, Kernan NA, Castro-Malaspina H, O’Reilly RJ, Bourhis JH. Clonal analysis of myelodysplastic syndrome: monosomy 7 is expressed in the myeloid lineage, but not in the lymphoid lineage as detected by fluorescent in situ hybridization. Blood. 1992;80:217–224. [PubMed] [Google Scholar]
- 6.Saitoh K, Miura I, Takahashi N, Miura AB. Fluorescence in situ hybridization of progenitor cells obtained by fluorescence-activated cell sorting for the detection of cells affected by chromosome abnormality trisomy 8 in patients with myelodysplastic syndromes. Blood. 1998;92:2886–2892. [PubMed] [Google Scholar]
- 7.Kerbauy DM, Lesnikov V, Torok-Storb B, Bryant E, Deeg HJ. Engraftment of distinct clonal MDS-derived hematopoietic precursors in NOD/SCID-beta2-microglobulin-deficient mice after intramedullary transplantation of hematopoietic and stromal cells. Blood. 2004;104:2202–2203. doi: 10.1182/blood-2004-04-1518. [DOI] [PubMed] [Google Scholar]
- 8.Nilsson L, Astrand-Grundstrom I, Arvidsson I, Jacobsson B, Hellstrom-Lindberg E, Hast R, Jacobsen SE. Isolation and characterization of hematopoietic progenitor/stem cells in 5q-deleted myelodysplastic syndromes: evidence for involvement at the hematopoietic stem cell level. Blood. 2000;96:2012–2021. [PubMed] [Google Scholar]
- 9.Raza-Egilmez SZ, Jani-Sait SN, Grossi M, Higgins MJ, Shows TB, Aplan PD. NUP98-HOXD13 gene fusion in therapy-related acute myelogenous leukemia. Cancer Res. 1998;58:4269–4273. [PubMed] [Google Scholar]
- 10.Lin YW, Slape C, Zhang Z, Aplan PD. NUP98-HOXD13 transgenic mice develop a highly penetrant, severe myelodysplastic syndrome that progresses to acute leukemia. Blood. 2005;106:287–295. doi: 10.1182/blood-2004-12-4794. [DOI] [PMC free article] [PubMed] [Google Scholar]
- 11.Chervinsky DS, Zhao XF, Lam DH, Ellsworth M, Gross KW, Aplan PD. Disordered T-cell development and T-cell malignancies in SCL LMO1 double-transgenic mice: parallels with E2A-deficient mice. Mol Cell Biol. 1999;19:5025–5035. doi: 10.1128/mcb.19.7.5025. [DOI] [PMC free article] [PubMed] [Google Scholar]
- 12.Chervinsky DS, Lam DH, Melman MP, Gross KW, Aplan PD. scid Thymocytes with TCRbeta gene rearrangements are targets for the oncogenic effect of SCL and LMO1 transgenes. Cancer Res. 2001;61:6382–6387. [PubMed] [Google Scholar]
- 13.Danska JS, Pflumio F, Williams CJ, Huner O, Dick JE, Guidos CJ. Rescue of T cell-specific V(D)J recombination in SCID mice by DNA-damaging agents. Science. 1994;266:450–455. doi: 10.1126/science.7524150. [DOI] [PubMed] [Google Scholar]
- 14.Hardy RR, Carmack CE, Shinton SA, Kemp JD, Hayakawa K. Resolution and characterization of pro-B and pre-pro-B cell stages in normal mouse bone marrow. J Exp Med. 1991;173:1213–1225. doi: 10.1084/jem.173.5.1213. [DOI] [PMC free article] [PubMed] [Google Scholar]
- 15.Mirakian R, Nye K, Palazzo FF, Goode AW, Hammond LJ. Methods for detecting apoptosis in thyroid diseases. J Immunol Methods. 2002;265:161–175. doi: 10.1016/s0022-1759(02)00078-9. [DOI] [PubMed] [Google Scholar]
- 16.van Engeland M, Nieland LJ, Ramaekers FC, Schutte B, Reutelingsperger CP. Annexin V-affinity assay: a review on an apoptosis detection system based on phosphatidylserine exposure. Cytometry. 1998;31:1–9. doi: 10.1002/(sici)1097-0320(19980101)31:1<1::aid-cyto1>3.0.co;2-r. [DOI] [PubMed] [Google Scholar]
- 17.Chien YH, Gascoigne NR, Kavaler J, Lee NE, Davis MM. Somatic recombination in a murine T-cell receptor gene. Nature. 1984;309:322–326. doi: 10.1038/309322a0. [DOI] [PubMed] [Google Scholar]
- 18.Nikolich-Zugich J, Slifka MK, Messaoudi I. The many important facets of T-cell repertoire diversity. Nat Rev Immunol. 2004;4:123–132. doi: 10.1038/nri1292. [DOI] [PubMed] [Google Scholar]
- 19.Van Vlierberghe P, van Grotel M, Tchinda J, Lee C, Beverloo HB, van der Spek PJ, Stubbs A, Cools J, Nagata K, Fornerod M, Buijs-Gladdines J, Horstmann M, van Wering ER, Soulier J, Pieters R, Meijerink JP. The recurrent SET-NUP214 fusion as a new HOXA activation mechanism in pediatric T-cell acute lymphoblastic leukemia. Blood. 2008;111:4668–4680. doi: 10.1182/blood-2007-09-111872. [DOI] [PMC free article] [PubMed] [Google Scholar]
- 20.Thorsteinsdottir U, Mamo A, Kroon E, Jerome L, Bijl J, Lawrence HJ, Humphries K, Sauvageau G. Overexpression of the myeloid leukemia-associated Hoxa9 gene in bone marrow cells induces stem cell expansion. Blood. 2002;99:121–129. doi: 10.1182/blood.v99.1.121. [DOI] [PubMed] [Google Scholar]
- 21.Taghon T, Stolz F, De Smedt M, Cnockaert M, Verhasselt B, Plum J, Leclercq G. HOX-A10 regulates hematopoietic lineage commitment: evidence for a monocyte-specific transcription factor. Blood. 2002;99:1197–1204. doi: 10.1182/blood.v99.4.1197. [DOI] [PubMed] [Google Scholar]
- 22.Thorsteinsdottir U, Sauvageau G, Hough MR, Dragowska W, Lansdorp PM, Lawrence HJ, Largman C, Humphries RK. Overexpression of HOXA10 in murine hematopoietic cells perturbs both myeloid and lymphoid differentiation and leads to acute myeloid leukemia. Mol Cell Biol. 1997;17:495–505. doi: 10.1128/mcb.17.1.495. [DOI] [PMC free article] [PubMed] [Google Scholar]
- 23.Balciunaite G, Ceredig R, Massa S, Rolink AG. A B220+ CD117+ CD19− hematopoietic progenitor with potent lymphoid and myeloid developmental potential. Eur J Immunol. 2005;35:2019–2030. doi: 10.1002/eji.200526318. [DOI] [PubMed] [Google Scholar]
- 24.Anderson K, Rusterholz C, Mansson R, Jensen CT, Bacos K, Zandi S, Sasaki Y, Nerlov C, Sigvardsson M, Jacobsen SE. Ectopic expression of PAX5 promotes maintenance of biphenotypic myeloid progenitors coexpressing myeloid and B-cell lineage-associated genes. Blood. 2007;109:3697–3705. doi: 10.1182/blood-2006-05-026021. [DOI] [PubMed] [Google Scholar]
- 25.Rolink A, ten Boekel E, Melchers F, Fearon DT, Krop I, Andersson J. A subpopulation of B220+ cells in murine bone marrow does not express CD19 and contains natural killer cell progenitors. J Exp Med. 1996;183:187–194. doi: 10.1084/jem.183.1.187. [DOI] [PMC free article] [PubMed] [Google Scholar]
- 26.Dannaeus K, Johannisson A, Nilsson K, Jonsson JI. Flt3 ligand induces the outgrowth of Mac-1+B220+ mouse bone marrow progenitor cells restricted to macrophage differentiation that coexpress early B cell-associated genes. Exp Hematol. 1999;27:1646–1654. doi: 10.1016/s0301-472x(99)00106-x. [DOI] [PubMed] [Google Scholar]
- 27.Scollay R, Godfrey DI. Thymic emigration: conveyor belts or lucky dips? Immunol Today. 1995;16:268–273. doi: 10.1016/0167-5699(95)80179-0. discussion 273–264. [DOI] [PubMed] [Google Scholar]
- 28.Hong D, Gupta R, Ancliff P, Atzberger A, Brown J, Soneji S, Green J, Colman S, Piacibello W, Buckle V, Tsuzuki S, Greaves M, Enver T. Initiating and cancer-propagating cells in TEL-AML1-associated childhood leukemia. Science. 2008;319:336–339. doi: 10.1126/science.1150648. [DOI] [PubMed] [Google Scholar]
- 29.Chung YJ, Choi CW, Slape C, Fry T, Aplan PD. Transplantation of a myelodysplastic syndrome by a long-term repopulating hematopoietic cell. Proc Natl Acad Sci U S A. 2008;105:14088–14093. doi: 10.1073/pnas.0804507105. [DOI] [PMC free article] [PubMed] [Google Scholar]
- 30.Pineault N, Buske C, Feuring-Buske M, Abramovich C, Rosten P, Hogge DE, Aplan PD, Humphries RK. Induction of acute myeloid leukemia in mice by the human leukemia-specific fusion gene NUP98-HOXD13 in concert with Meis1. Blood. 2003;101:4529–4538. doi: 10.1182/blood-2002-08-2484. [DOI] [PubMed] [Google Scholar]
Associated Data
This section collects any data citations, data availability statements, or supplementary materials included in this article.