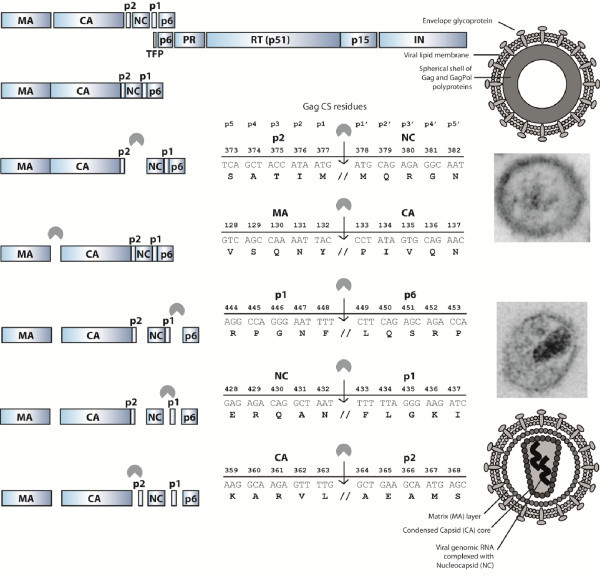
Figure 1.
A schematic representation of HIV particle maturation. At the top, the viral GagPol polyprotein is depicted. On the left, the 5 sequential proteolytic processing steps of Gag are shown. In the middle, the 5 Gag cleavage sites (CS) and their nucleotide and corresponding amino acid sequences are shown. The numbers above the residues correspond to their position in the Gag polyprotein. At the top of the middle panel, the location of the p5-p5’ positions is indicated. On the right are schematic representations and electron-microscopy images of an HIV particle. Top: the immature, non-infectious particle with its granulated core. Bottom: the fully mature and infectious virion with its characteristic electron-dense conical core. The pacman figure represents the viral protease enzyme.

