Abstract
Lactose synthesis is believed to be rate limiting for milk production. However, understanding the molecular events controlling lactose synthesis in humans is still rudimentary. We have utilized our established model of the RNA isolated from breast milk fat globule from seven healthy, exclusively breastfeeding women from 6 h to 42 days following delivery to determine the temporal coordination of changes in gene expression in the carbohydrate metabolic processes emphasizing the lactose synthesis pathway in human mammary epithelial cell. We showed that milk lactose concentrations increased from 75 to 200 mM from 6 to 96 h. Milk progesterone concentrations fell by 65% at 24 h and were undetectable by day 3. Milk prolactin peaked at 36 h and then declined progressively afterward. In concordance with lactose synthesis, gene expression of galactose kinase 2, UDP-glucose pyrophosphorylase 2 (UGP2), and phosphoglucomutase 1 increased 18-, 10-, and threefold, respectively, between 6 and 72 h. Between 6 and 96 h, gene expression of UDP-galactose transporter 2 (SLC35A2) increased threefold, whereas glucose transporter 1 was unchanged. Gene expression of lactose synthase no. 3 increased 1.7-fold by 96 h, whereas α-lactalbumin did not change over the entire study duration. Gene expression of prolactin receptor (PRLR) and its downstream signal transducer and activator of transcription complex 5 (STAT5) were increased 10- and 2.5-fold, respectively, by 72 h. In summary, lactose synthesis paralleled the induction of gene expression of proteins involved in UDP-galactose synthesis and transport, suggesting that they are potentially rate limiting in lactose synthesis and thus milk production. Progesterone withdrawal may be the signal that triggers PRLR signaling via STAT5, which may in turn induce UGP2 and SLC35A2 expression.
Keywords: fat globule, lactose synthesis, glucose metabolism, microarray
the onset of lactation or “lactogenesis” is a process that has been divided into two phases: lactogenesis I or secretory differentiation and lactogenesis II or secretory activation. The classical definition of secretory activation is “the onset of copious milk secretion,” and it is characterized additionally by dramatic changes in milk composition, including increased lactose, citrate, and potassium and decreased concentrations of milk sodium and immunoglobulin (2, 11). From animal models, the induction of secretory activation is thought to be triggered by a progressive fall in plasma progesterone concentration (22, 35, 45, 48) and adequate suckling with milk removal together with the presence of prolactin and glucocorticoid (36, 45). These events appear to initiate a series of changes in the mammary epithelium that include first and foremost the closure of tight junctions (26, 39, 40, 44), the induction of genes linked to intermediary metabolism and lipid and carbohydrate metabolism (50, 51), and the activation of protein synthesis (5, 49). However, the understanding of this process in humans is still rudimentary.
Lactose (a disaccharide of galactose and glucose) is the major carbohydrate in the milk of most mammalian species, being the highest in human milks (180–200 mM). Lactose is thought to play a primary role in milk production since it represents the main osmotic agent in milk that draws water into lacteal. Analysis of lactose synthesis in rodent and bovine models of secretory activation has demonstrated increases in a number of enzyme activities and carbohydrate metabolites that together formed the fundamentals for elucidation of the lactose synthesis pathway (3, 6, 7, 18, 20, 22, 23, 25, 26, 35, 38, 47, 53, 57). These findings support the idea that a coordinated expression of the genes encoding for these enzymes could play a role in the success of secretory activation. Despite these findings, the mechanism(s) through which such coordination might occur is not well understood. During late pregnancy and the first few days postpartum in humans, the mammary glands produce colostrum. From 24 to 72 h postdelivery, milk volume increases gradually with increasing lactose concentrations, resulting in the establishment of lactation normally by ∼96 h (40, 42, 52).
The present studies were designed to determine the temporal coordination of changes in gene expression in carbohydrate metabolic pathways, emphasizing the lactose synthesis pathway that takes place during initiation of lactation. It was our intended goal to identify potential rate-limiting steps and potential targets for determining the pathophysiology of lactation failure, with the hope to design potential intervention in women who struggle with breastfeeding. To accomplish this aim, we utilized our established model of the RNA isolated from milk fat globule (MFG) (28–30) to measure the mRNA profiles in the human mammary gland during secretory activation and through the first 6 wk of lactation.
MATERIALS AND METHODS
Subjects
Following approval from the Institutional Review Board at Baylor College of Medicine (Houston, TX), written informed consent was obtained from nine healthy lactating women; seven of them completed the entire study. Two women withdrew from the study; one withdrew for personal reasons unrelated to the study, and the other withdrew due to an inability to support exclusive breastfeeding by day 21 and was accordingly excluded from the analysis. Volunteers were excluded if they had diabetes or impaired glucose tolerance, anemia, or renal or hepatic dysfunction. All women were 18–35 yr old. They had uncomplicated singleton pregnancies delivered vaginally at term (>37 wk) and had documented prepregnancy body mass index (BMI) <26 kg/m2. Throughout the study, infants were deemed healthy and were breastfed exclusively.
Milk Collection
Breast milk (3–5 ml during the first 4 days and then 10 ml afterward) was collected 6 h following delivery, 12 h for the first 4 days and then weekly for 6 wk. Following day 7, the weekly samples were collected at ∼10 AM to avoid any effects due to circadian rhythm (29, 30). Milk was collected simultaneously from both breasts using a standard breast pump (Playtex Embrace, Dover, DE) and placed immediately on ice.
The milk sample was transferred into sterile, RNase-free, tightly sealed tubes containing 20 μl of RNAse inhibitor (20 U/μl SUPERase IN; Abmion Applied Biosystems) and then centrifuged (Sorvall Legend T) at 3,000 rpm for 15 min at 4°C. The supernatant fat layer was transferred using a sterile spatula to a new tube. Trizol (2 ml; Invitrogen Life Technologies, Carlsbad, CA) was added prior to storage at −80°C. The infranate was stored at −80°C for substrate and hormone analyses.
Milk Substrate and Hormone Analyses
Milk lactose, free glucose, and lactate concentrations were determined using enzyme-specific methods (YSI Glucose Analyzer, Yellow Springs, OH). Progesterone and prolactin hormones were measured in milk infranate by electrochemiluminescence using a Roche Elecsys 2010 analyzer (Roche Diagnostics, Indianapolis, IN).
Molecular Analysis
RNA isolation.
Total RNA was isolated from TRIzol-treated milk fat, following the manufacturer's suggested procedures, as we have described previously (29). Total RNA concentration was measured using NanoDrop spectrophotometer (NanoDrop Technologies, Wilmington, DE). RNA quality was assessed using the ExperionTMRNA StdSens Analysis Kit (Bio-Rad Laboratories, Hercules, CA).
cRNA amplification and expression microarray.
The method of sample preparation was identical to that described previously (28, 29). In brief, cRNA amplification and labeling with biotin were performed using Illumina TotalPrep RNA amplification kit (Ambion, Austin, TX) on an aliquot of 1,000 ng of total RNA. In vitro transcription reaction of cDNA to cRNA was performed overnight (14 h), including biotin-11-dUTP for labeling of the cRNA product. cRNA yields were quantified with a NanoDrop spectrophotometer. We hybridized 750 ng of labeled cRNAs to the HumanHT-12 V4 Expression BeadChip (Illumina, San Diego, CA) at 55°C overnight (16 h) following the Illumina Whole-Genome Gene Expression Protocol for Bead Station (doc. no. 111226048, Rev. B, Illumina) and stained them with 1 g/ml streptavidin-Cy3 (Amersham Biosciences, Piscataway, NJ) for visualization (28, 29).
Gene expression analysis was performed using the Sentrix BeadChip and BeadStation system from Illumina. Over the 42-day study, 105 samples [15 time points × 7 subjects (biological replicates)] resulting in 105 microarrays were analyzed. The HumanHT-12 V4 Expression BeadChip contains sequences representing 47,323 curated probes. Quality standards for hybridization, labeling, staining, background signal, and basal level of housekeeping gene expression for each chip were verified. After scanning the probe array, we analyzed the resulting image using the GenomeStudio software, version 1.9.0 (Illumina) (28, 29).
Data Analysis
Raw intensity data were background subtracted and cubic spline normalized using GenomeStudio Software and then exported to GeneSpring GX 11.5.1 (Agilent Technologies, Santa Clara, CA). Signal data were q-spline normalized and filtered based on the criteria that flags for each probe should be present in six of seven subjects in at least one time point of sample collection. Of the 47,323 gene probes, 16,623 were present in the MFG (from hereon called the MFG gene list). These data have been deposited in NCBI's Gene Expression Omnibus (13) and are accessible through GEO Series accession no. GSE36936 (http://www.ncbi.nlm.nih.gov/geo/query/acc.cgi?acc=GSE36936). It was these data that underwent further analyses. The repeated-measures test was used to determine transcripts that differ statistically from the initial milk sample (6 h) by using the Benjamini-Hochberg false discovery rate (B-H FDR) correction for multiple analyses. Out of 16,622 probes, 12,400 were different (<0.05) from the baseline sample (6 h).
The gene ontology (GO) option on GeneSpring GX11.5 was utilized to determine the most significant biological processes (corrected P < 0.05) represented in the MFG transcriptome. The MFG gene list related to the carbohydrate metabolic pathway (438/16,622 probes) containing gene accession numbers and symbols was uploaded into the Ingenuity Pathways Analysis (IPA; Ingenuity Systems; www.ingenuity.com) application. Each identifier was mapped to its corresponding gene object in the Ingenuity knowledge base. Canonical pathway analysis identified pathways from the Ingenuity Pathways Analysis library of canonical pathways that were most significant (P < 0.05) to the data set. The significance of the pathways represented was determined by calculating the number of genes from the data set that met the expression value cutoff that maps to the pathway divided by the total number of genes that exist in the canonical pathway displayed. The B-H FDR multiple testing correction was then used to calculate a P value, determining the probability that the representation of the genes in the data set compared with the canonical pathway is greater than that explained by chance alone. For our analyses, a P value <0.05 was considered significant.
Repeated-measures test was used to determine the changes in milk hormone and substrate concentration overtime using Software program SPSS (version 19; SPSS, Chicago, IL). GraphPad Prism software (version 4; GraphPad Software) was used to generate the figures for hormone and substrate concentrations and fluorescence intensity of the mRNA expression.
RESULTS
Subjects
The average age of the volunteers was 30 ± 1 yr, with a mean prepregnancy height and weight of 165 ± 2 cm and 61 ± 4 kg, respectively, and BMI of 22 ± 1. Of the seven subjects, four were primigravida and three were multiparous.
Milk substrate concentrations.
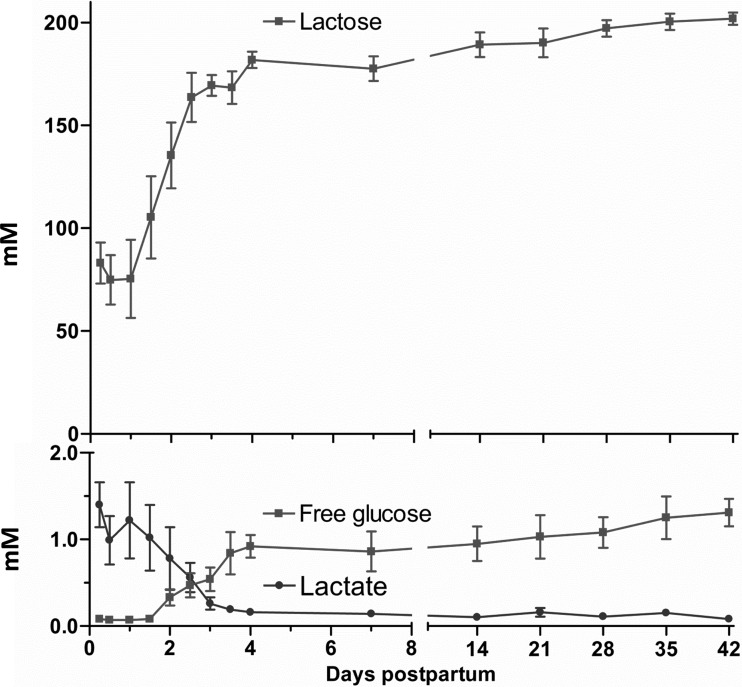
Milk lactose concentration increased 2.5-fold (P < 0.001) from 6 to 96 h, reaching a relative plateau of 185 mM (Fig. 1). Free glucose concentration followed the same pattern as lactose by increasing (P < 0.01) from 0.1 mM at 6 h to 1 mM at 96 h. However, the lactate concentrations decreased (P < 0.01) from 1.25 mM at 6 h to reach a plateau of ∼0.2 mM at 96 h (Fig. 1).
Fig. 1.
Milk lactose, lactate, and free glucose concentrations (mM) from 6 h to 42 days postpartum in 7 normal lactating human volunteers. Values represent means ± SE. P < 0.001 (repeated measures and Bonferroni correction for post hoc) for overall effect of time on lactose, lactate, or glucose concentrations.
Milk hormone concentrations.
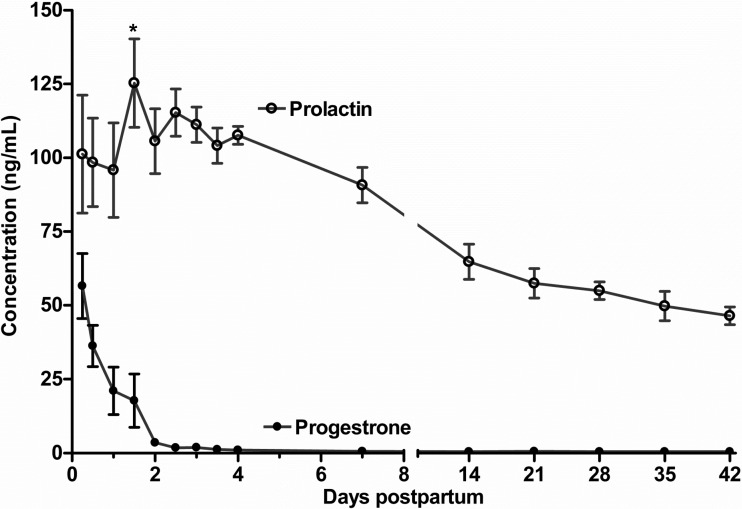
Following the first 24 h, milk prolactin concentration peaked (P = 0.03) at 36 h, with a progressive decrease to ∼50 ng/ml by 42 days. Progesterone declined rapidly (P < 0.01) from 56 ± 16 ng/ml at 6 h to 17.3 ± 9.0 ng/ml at 36 h and declined further to <1 ng/ml by 72 h (Fig. 2).
Fig. 2.
Milk prolactin and progesterone concentrations (ng/ml) from 6 h to 42 days postpartum in 7 normal lactating human volunteers. Values represent means ± SE. P < 0.001 (repeated measures) for overall effect of time on prolactin and progesterone concentration. Following 24 h, milk prolactin concentration increased (*P = 0.03, least significant difference for post hoc) at 36 h, followed by a progressive decrease.
Microarray Data Analysis
Glucose transporter gene expression in MFG.
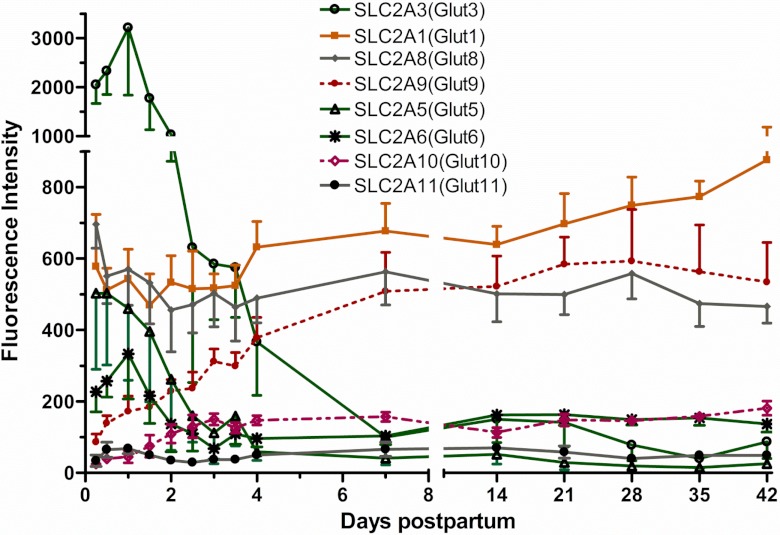
Of the 14 glucose transporter transcripts [SCL2A or glucose transporter (GLUT)] on the array, only eight were present at detectable levels. Of these, GLUT3 had the highest abundance at 6 h, decreasing ∼40-fold on day 4 (P < 0.01). Similarly, GLUT5 and GLUT6 were decreased 12- and threefold (P < 0.01), respectively, by day 4 from the 6-h sample. In contrast, GLUT1 expression at 6 h was high in abundance and increased (P < 0.01) only 1.4-fold by day 7 and afterward. GLUT9 and GLUT10 also increased seven- and eightfold (P < 0.01), respectively, by day 4 from the 6-h sample, whereas GLUT8 and GLUT11 were unchanged with the time (Fig. 3). None of GLUT2, GLUT4, GLUT7, GLUT12, GLUT13, or GLUT14 mRNAs were detected.
Fig. 3.
Fluorescence intensity for the detected glucose transporter (SLC2A or GLUT) gene expression (means ± SE; n = 7) from 6 h to 42 days. P values for repeated-measures analysis after Benjamini-Hochberg false discovery rate (B-H FDR) multiple testing corrections revealed an overall significant decrease (<0.01) in the expression for GLUT3, GLUT5, and GLUT6 and an increase in GLUT1, GLUT9, and GLUT10. GLUT8 and GLUT11 were unchanged over time.
Glycolysis genes.
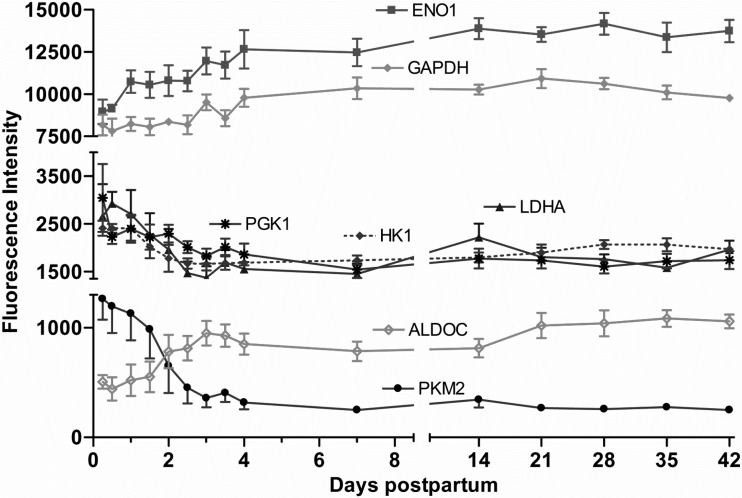
In the glycolytic pathway genes, enolase (ENO1) and glyceraldehyde-3-phosphate dehydrogenase (GAPDH) mRNA were the highest in abundance. Whereas the expression patterns of phosphoglycerate kinase 1 (PGK1), hexokinase 1 (HK1), lactate dehydrogenase A (LDHA), and pyruvate kinase muscle (PKM2) were decreased (P < 0.01) by day 4 (−1.5-, −1.5-, −1.9-, and −4.0-fold, respectively), aldolase C, ENO1, and GAPDH genes were increased (P < 0.01) by day 4 (1.8-, 1.4-, and 1.2-fold, respectively) (Fig. 4).
Fig. 4.
Fluorescence intensity for major glycolytic pathway gene expression (means ± SE; n = 7) from 6 h to 42 days postpartum. P values for repeated-measures analysis after B-H FDR multiple testing corrections. The gene expression of enolase 1 (ENO1), glyceraldehyde-3-phosphate dehydrogenase (GAPDH), and aldolase C (ALDOC) increased (P < 0.01), whereas that of phosphoglycerate kinase 1 (PGK1), hexokinase 1 (HK1), lactate dehydrogenase A (LDHA), and pyruvate kinase muscle (PKM2) decreased (P < 0.01).
Gluconeogenesis genes.
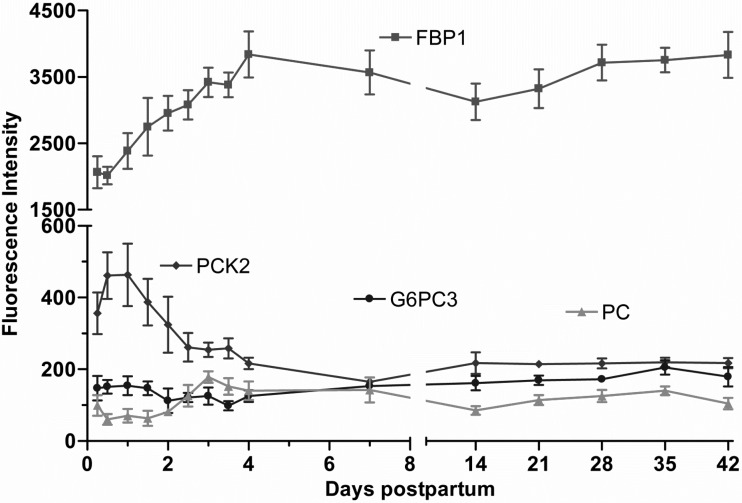
Of the transcripts attributed to the rate-limiting enzymes in gluconeogenesis, fructose-1,6-bisphosphatase 1 (FBP1) was the most abundant gene that increased (P < 0.01), with the time reaching a plateau of 1.9-fold by day 4. The mRNA expression of pyruvate carboxylase (PC) followed a similar pattern and increased twofold (P < 0.01), whereas phosphoenolpyruvate carboxykinase 2 decreased twofold by day 4. However, the mRNA expression glucose-6-phosphatase catalytic 3 did not change over time (Fig. 5).
Fig. 5.
Fluorescence intensity of gene expression for the rate-limiting enzymes in gluconeogenic pathway (means ± SE; n = 7) from 6 h to 42 days postpartum. P values for repeated-measures analysis after B-H FDR multiple testing corrections. Both fructose 1,6-bisphosphatase 1 (FBP1) and pyruvate carboxylase (PC) increased with time (P < 0.01). Phosphoenolpyruvate carboxykinase2 (PCK2) decreased by day 4 (P < 0.01). Glucose-6-phosphatase catalytic 3 (G6PC3) did not change over time.
Pentose phosphate pathway genes.
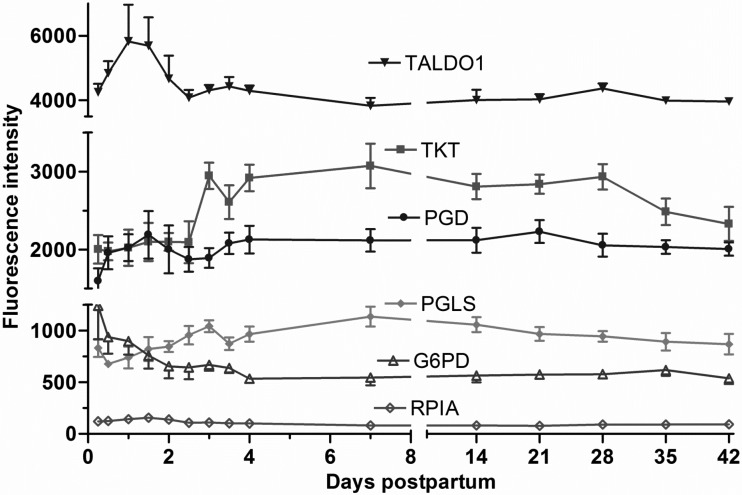
Of the 81 transcripts attributed to the pentose phosphate pathway on the array, 23 were detected. The mRNA expression transketolase and 6-phosphogluconolactonase increased (P < 0.01), reaching a plateau of 1.5-fold change by day 4. However, transaldolase 1 increased (P < 0.05) during the first 24 h then declined, reaching a plateau from day 7 to day 42. Whereas glucose-6-phosphate dehydrogenase decreased (−2-fold; P < 0.01) by day 4, other genes, including phosphogluconate dehydrogenase and ribose 5-phosphate isomerase A, remained unchanged (Fig. 6).
Fig. 6.
Fluorescence intensity of gene expression for the pentose phospahate pathway (means ± SE; n = 7) from 6 h to 42 days postpartum. P values for repeated-measures analysis after B-H FDR multiple testing corrections. Transketolase (TKT) and 6-phosphogluconolactonase (PGLS) increased 1.5-fold (P < 0.01) by day 4 from the 6-h sample. Glucose-6-phosphate dehydrogenase (G6PD) decreased (−2-fold; P < 0.01) by day 4. TALDO1, transaldolase 1; PGD, phosphogluconate dehydrogenase; RPIA, ribose 5-phosphate isomerase A.
Glucose-galactose interconversion and UDP-galactose synthesis and transport.
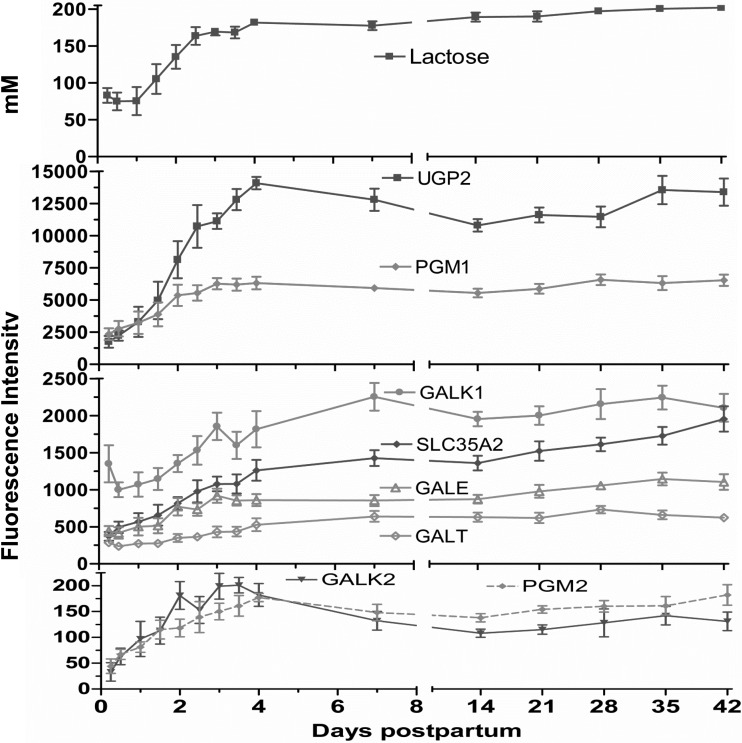
Expression of phosphoglucomutase (PGM)1, PGM2, and UDP-glucose pyrophosphorylase 2 (UGP2) increased progressively from the 6-h milk three-, eight, and 10-fold (P < 0.01), respectively, by day 4 (Fig. 7). Galactokinase (GALK)1, GALK2, UDP-galactose-4-epimerase, UDP-galactose transporter (SLC35A2), and galactose-1-phosphate uridylyltransferase (GALT) were also increased progressively from the 6-h value, reaching a plateau of greater than twofold (Fig. 7).
Fig. 7.
Milk lactose concentrations and fluorescence intensity of gene expression for the enzymes in UDP-galactose synthesis and transport pathway (means ± SE; n = 7) from 6 h to 42 days postpartum. The gene expression data on the following enzymes, including galactokinases 1 and 2 (GALK1 and GALK2), UDP-galactose-4-epimerase (GALE), UDP-galactose transporter (SLC35A2), galactose-1-phosphate uridylyltransferase (GALT), UDP-glucose pyrophosphorylase 2 (UGP2), and phosphoglucomutases 1 and 2 (PGM1 and PGM2) increased severalfold by day 4 (P < 0.001, repeated-measures analysis after H-B multiple testing corrections).
Lactose synthase and α-lactalbumin.
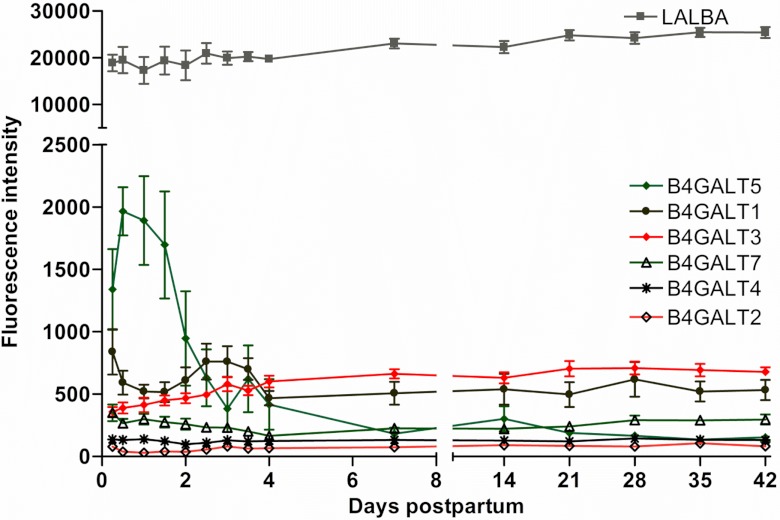
The gene expression of α-lactalbumin (LALBA) was highly expressed (one of the top 10 abundant genes) in the first milk (6 h) but did not change significantly over the course of study (Fig. 8). Out of the seven β-1,4-galactosyltransferase (β4GALT) genes, all of the transcripts of lactose synthase polypeptides were expressed, except for β4GALT6. The mRNA expression of β4GALT2 and β4GALT3 increased (P < 0.01) 1.2- and 1.7-fold on day 4 from the 6-h sample. Whereas the mRNA expression of β4GALT5 and β4GALT7 decreased (−2.0- and −4.5-fold, respectively, P < 0.01) by day 4 from the 6-h sample, β4GALT1 and β4GALT4 were unchanged over time (Fig. 8).
Fig. 8.
The gene expression of α-lactalbumin (LALBA) and lactose synthase (β4-GALT) polypeptide members (means ± SE; n = 7) from 6 h to 42 days postpartum. P values for repeated-measures analysis after B-H FDR multiple testing corrections. β4-GALT5 and β4-GALT7 decreased (P < 0.001); only β4-GALT3 reached 1.7-fold increase (P < 0.05) on day 4 following delivery.
Ingenuity Pathway Analysis
Top significant canonical pathways in carbohydrate-related metabolic genes.
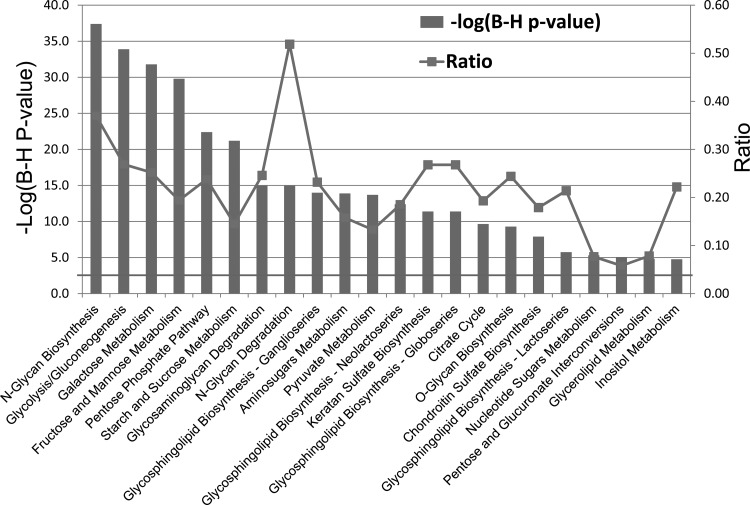
IPA for the 438 transcripts representing the GO of carbohydrate metabolic processes revealed several significant canonical pathways, using B-H FDR for multiple correction. In descending order of the significance [−log (B-H P value)], the pathways included N-glycan biosynthesis (P < 3.89E−38), glycolysis/gluconeogenesis (P < 1.12E−34), galactose metabolism (P < 1.65E−32), fructose and mannose metabolism (P < 1.74E−30), pentose phosphate pathway (P < 3.76E−23), and other pathways identified IPA as being related to carbohydrate metabolism (Fig. 9).
Fig. 9.
Top significant enriched canonical pathways in carbohydrate-related metabolic genes in descending order of the significance, using B-H multiple correction [−log (B-H P value)] as generated by ingenuity pathway analysis. Gray line represents the ratio of genes from the data set divided by the total no. of genes that exist in the canonical pathway displayed.
Galactose metabolic pathway.
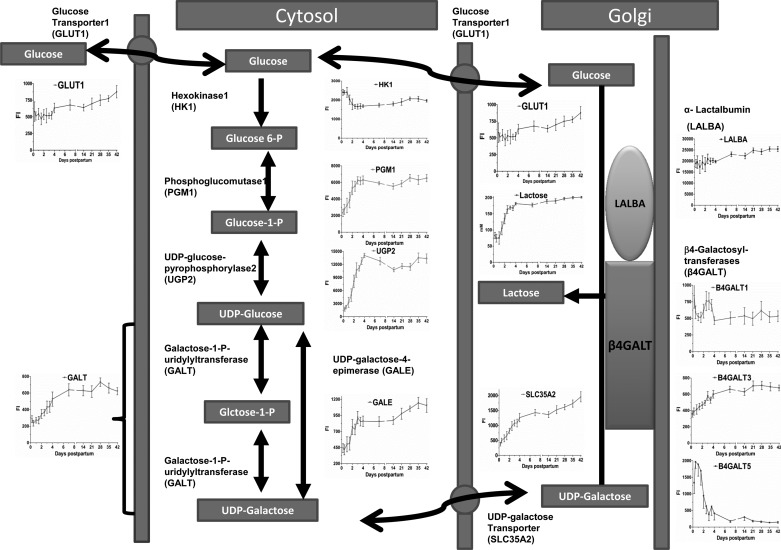
In the canonical pathway of galactose metabolism curated by IPA, 23 of 106 transcripts were detected (P < 1.6 E−24). Figure 10 depicts the synthesis and the transport steps in lactose synthesis and the mRNA expression of each step utilizing the galactose metabolic pathway and knowledge accumulated for lactose synthesis pathway. Accordingly, the transcriptome of enzymes required for the interconversion of glucose to UDP-galactose was upregulated (P < 0.01). The highest transcriptomes (in fold change) are GALK2, UGP2, and PGM complex members 1–3. The known glucose transporter into the cytosol and Golgi compartments (GLUT1) was increased only 1.4-fold on day 7 and afterward, whereas the Golgi UDP-galactose transporter (SLC35A2) was increased 3.5-fold by day 4. HK1, -2, and -3 were downregulated. Lactose synthase polypeptide member3 (B4GALT3) was upregulated (1.7-fold, P < 0.01) after only 72 h, whereas LALBA expression was initially high and did not change (Fig. 10).
Fig. 10.
The transcriptome of genes encoding enzymes and proteins on the lactose synthesis pathway, including GLUT1, HK1, PGM1, UGP2, GALE, GALT, SLC35A2, LALBA, and β4-GALT1, -3, and -5. The transcriptome of enzymes required for the interconversion of glucose to UDP-galactose was upregulated (P < 0.01). The highest transcriptomes in abundance, fold changes, and correlation coefficients with lactose synthesis are UGP2, PGM1, and SLC35A2. GLUT1 was increased only 1.5-fold after day 7. HK1 was downregulated. Only β4-GALT3 was upregulated, whereas LALBA expression was initially high and did not change.
Prolactin signaling pathway.
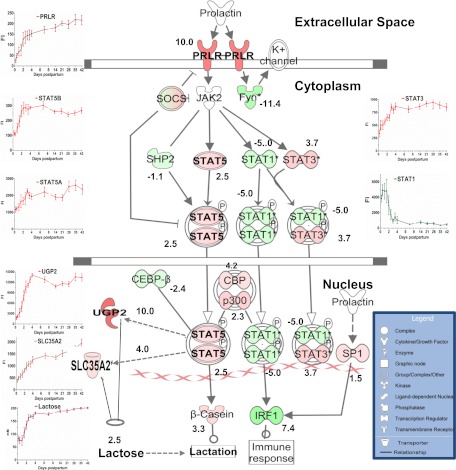
Canonical pathway of prolactin signaling was only significantly (B-H P = 7.11E−5, ratio 0.76 or 61:80) enriched when the entire list of detected transcripts (16,622) was used (Fig. 11). Prolactin receptor was 10-fold upregulated by 72 h. Similarly, signal transducer and activator of transcription (STAT)3, STAT5A, and STAT5B increased (P < 0.01) four-, two-, and 2.5-fold, respectively. However, STAT1, interferon regulatory factor 1, and the protein-tyrosine kinase oncogene family were decreased (P < 0.01) by 72 h (−5-, −11-, and −7-fold, respectively). However, it is of interest that Janus kinase 2 was not detected in our data set (Fig. 11).
Fig. 11.
Proposed model for hormonal control of lactose synthesis utilizing prolactin receptor (PRLR) signaling canonical pathway curated using the ingenuity pathway analysis list and the fluorescence intensity of selected transcripts and lactose concentration. Green nodes indicate downregulated genes, whereas red nodes indicate the upregulated ones, and nos. represent the fold changes at 72 compared with 6 h. PRLR, signal transducer and activator of transcription (STAT1, -2, -3, and -5), the protein-tyrosine kinase oncogene family (FYN), p300-CBP coactivator family (p300-CBP), and interferon regulatory factor 1 (IRF1). According to our model, activation of STAT5 via PRLR leads to induction of mRNA expression of UGP2 and SLC35A2 (dashed lines) and consequently increases lactose synthesis. SOCS, suppressor of cytokine signaling; SHP2, SH2-containing protein tyrosine phosphatase 2; CEBP-β, CCAAT enhancer-binding protein-β; CBP, cAMP response element-binding protein binding protein; SP1, specificity protein 1.
DISCUSSION
Since lactose, as the primary osmotic agent, is the major determinant of milk volume (18), its synthesis is a predominant influence on the milk yield and to an indirect extent the concentration of other components in the milk whose synthesis is independent of those of lactose. Consistent with this widely held belief, milk lactose concentration increased 2.5-fold from 6 to 96 h in the present study, reaching a relative plateau of ∼200 mM over the next 5 wk. Our observations are similar to those reported previously (1, 40, 42, 52). Although milk volume was not measured in our study, it is well documented that milk volume increases from postpartum day 1 to day 4 from >100 to 500 ml/day (1, 40, 42, 52). By extrapolation, we would estimate that the lactose synthesis rate (daily volume × concentration) increased >10-fold from day 1 to day 4 (from ∼8 to 90 mmol/day), which is in a agreement with previous studies (40, 42). It has been reported that tight junction closure occurs about 24 h in advance of the postpartum increase in milk volume (40). With the decrease in influx of sodium and chloride during this period, lactose concentration rises to balance the osmolarity of the secreted product in the lumen (40).
In the current study, we focused on the temporal changes in gene expression in the carbohydrate metabolic pathways, with primary attention toward the lactose synthesis pathway. On the basis of our expression data (and not on protein concentrations or activities), we have strong molecular evidence that the control of secretory activation lies along the UDP-galactose synthesis pathway and believe that we have identified a number of other sites that seem less likely to be crossover or pointing to control in lactogenesis, such as proteins responsible for substrate transport, interconversion, and the ultimate synthesis of lactose.
Since plasma glucose gives rise to the vast majority of the monosaccharides of lactose, whether in animal or human models (4, 24, 32, 33), one might reasonably expect that glucose availability could control lactose synthesis. Up to 85% of the carbon in lactose is derived from plasma glucose whether lactose synthesis represents 85% of the glucose turnover in cows (4), 30% of the glucose turnover in rats (8), or 35% of the glucose turnover in humans (32, 56). One of the characteristic features of the lactating mammary alveolar cell is its high cytoplasmic glucose concentration. As first shown in rats (24) and later in women (41), the concentration of glucose in the milk is thought to be the same as that of the mammary alveolar cell. In women, milk glucose concentration increases from 0.30 to 1.5 mM during secretory activation (1) and decreases in proportion to milk volume during gradual weaning (41). In our present study, free glucose concentration followed a similar pattern, increasing from 0.1 mM at 6 h to 1.3 mM on day 4. Thus, these and other data (58) suggest that glucose transport could be rate limiting for lactose synthesis.
Our data showed that of the 14 known glucose transporter transcripts, eight were detected in human MFG. Only GLUT1 from the GLUT family has been reported in lactating mammary gland of rodents. However, other GLUT family members (GLUT6 and GLUT8) have been reported in a mammary carcinoma cell line from mice (60). In bovine mammary gland, the mRNAs of GLUT1, GLUT3, GLUT4, GLUT5, GLUT8, and GLUT12 and their respective proteins had been reported. The patterns and relative expression among these different transporters were highly correlated with the beginning of milk production (61). Whereas mRNA expression of GLUT1 increased 280% in rodents (2) and a few hundred-fold in bovine (61) mammary epithelial cells (MEC) during the secretory activation, we observed that GLUT1 increased only 1.4-fold by day 7 and afterward. It should be pointed out that GLUT1 expression was among the most abundant glucose transporters at 6 h postpartum and the most abundant following day 4, suggesting that it had achieved near-maximum expression prior to delivery and, therefore, was an unlikely rate-limiting step in lactogenesis. Since GLUT1 is considered to be the main extracellular and intercellular (Golgi membrane) glucose transporter in the MEC (37), it is not feasible for us to distinguish between the expression of extracellular and Golgi transporters.
GLUT3, which is known as a major brain neuronal glucose transporter (54), was highest in abundance during the first 3 days but declined sharply (−40-fold) by day 7. Similarly, GLUT5 and GLUT6 were downregulated (−17- and −5-fold, respectively) by day 3. The fall in expression of these transporters during the first few days following delivery indicates that these transporters may play a role during the antepartum but not the postpartum period. GLUT4 was not detected, supporting other studies that insulin is not involved in glucose transport in the MEC (9, 61). It is of interest to note that GLUT8, which is found to be responsible for insulin-stimulated glucose uptake in the blastocyst (10), was equally expressed as GLUT1 between days 1 and 4 and remained unchanged afterward. This finding is in good agreement with the detected mRNA expression pattern of GLUT8 in bovine mammary tissue (61). However, the role and function of GLUT8 remains to be determined in the MEC. Only GLUT9 [found primarily in the kidney and liver (46)] and GLUT10 [found in liver and pancreas (31)] increased in our study (>5-fold) by day 4. Our findings are unique in that GLUT9 and GLUT10 have not been reported previously in any mammary tissues. However, the role of the changes in all glucose transporters and their specific roles remain to be elucidated. The lack of a truly parallel relationship between the expression of glucose transporters (5/8) and the increase in lactose synthesis suggests that glucose transport per se is not a rate-limiting step for lactose synthesis in humans. Although glucose availability may be critical only in animals with high demand for lactation (e.g., rodents), this may not be the case in humans, because the relative demand is low and women have significant potential reserves (diet, glycogen, hexoneogenesis, and gluconeogenesis) (15, 32).
Were there significant contributions of glucose from gluconeogenesis traditionally known to occur mainly in the liver or glucose and galactose in the mammary gland (55), then one might anticipate an increase in the mRNA of all four of the rate-limiting enzymes in gluconeogenesis. Two factors make this unlikely. 1) Of the expression data of the four unidirectional gluconeogenic enzymes, only those of FBP1 and PC increased, whereas of the two others, one did not change and the other decreased with time; and 2) the nearly exclusive contribution of plasma glucose to glucose moiety in the lactose carbon gluconeogenesis would have little contribution to the glucose source for lactose synthesis but could potentially be limiting to the de novo synthesis of the galactose moiety via availability of glucose 1-phosphate. The relatively constant expression of the genes for the glycolytic enzymes and pentose phosphate pathway suggests continued utilization of glucose consistent with glucose carbon being the source of other milk constituents (4, 8) and as an energy source for mammary cell metabolic activity.
Another potential controlling step for glucose availability for lactose synthesis is that of hexokinase (HK). In bovine studies, the affinity and maximal activity of HK are such that it exerts 80% of the control of glucose metabolism to either lactose or oxidation, and transport of glucose exerts the remaining 20% (59). In rodents HK1 is expressed in the mammary gland throughout pregnancy and lactation, whereas HK2 is expressed only following parturition (21). The authors speculate that the presence of both HK1 and HK2 during lactation may lead to both an increase in free glucose for lactose synthesis and increased activity of the pentose phosphate shunt (2). These observations suggest that a primary regulatory step would be HK activity (59). Extrapolating from our expression data, HK1, HK2, and HK3 were detected in colostrum and subsequently downregulated following delivery. These expression data are inversely correlated with lactose synthesis and make HK an unlikely target as a rate-limiting step in lactose synthesis in humans.
Lactose synthesis paralleled the induction of gene expression of the proteins involved in UDP-galactose synthesis and its transport across the Golgi membrane, suggesting that one or more of these could be rate-limiting steps in lactose synthesis and thus milk production. In addition, we observed that the transcription of PGM1 and UGP2 increased progressively over the first 4 days before plateauing at changes of three- and 10-fold, respectively, above the 6-h baseline value. Additionally, the expression of these two genes (UGP2 and PGM1) specifically had the strongest correlation coefficients (r = 0.86 and 0.83, P < 0.001), with lactose concentration among all of the 438 genes studied representing the carbohydrate metabolic pathway. Similarly, gene expression of the Golgi UDP-galactose transporter (SLC35A2) increased severalfold and strongly correlated with lactose concentration (r = 0.75, P < 0.001).
The biosynthetic pathway of lactose involves the combination of free glucose and UDP-galactose catalyzed by lactose synthase system (57). This enzyme complex is composed primarily of β4GALT and LALBA (57). At very high concentrations of glucose, β4GALT can synthesize lactose; however, in the presences of LALBA, a mammary-specific protein, the Km for the reaction is lowered into the physiological range of MEC glucose concentrations (47). Although LALBA is required for lactose synthesis, as determined by knockout murine models, it may not be rate limiting under the normal induction of secretory activation (12–18). In this study, we observed that the gene expression patterns of the 4/6-detected β4GALT peptides did not correlate with lactose synthesis. This may negate, at least in humans, the role of β4GALT expression as a limiting factor for lactose synthesis, as has been described in mouse mammary gland explants (19). Gene expression of LALBA was high in the initial milk samples and remained constant throughout the 42 days of study. This observation together with our previous data (28–30) provide reasonably strong evidence that LALBA has little to do with the induction or change in human milk production in the week following parturition (although it is absolutely required for lactose synthesis).
Using ingenuity pathway analysis for the 438 genes related to the carbohydrate metabolic pathway, several significant canonical pathways were identified, including those associated with N-glycan biosynthesis, glycolysis/gluconeogenesis, galactose metabolism, fructose and mannose metabolism, pentose phosphate pathway, and others of known relevance to carbohydrate metabolic processes. However, it is worth mentioning that since we used the list of genes that were both up- and downregulated, the functional directionality of these pathways was not defined. The galactose pathway reveals that genes coding for the enzymes on the pathway for conversion of glucose to UDP-galactose, including GALK2, UGP2, and PGM complex, are upregulated the most. We believe that it is this pathway that regulates the synthesis of lactose at the initiation of the secretory phase of lactation. Yet it is possible that the transcriptional signal from other genes/pathways and/or translation and activation of the translated proteins may have an equal importance for lactose synthesis. A large change in transcriptional message is not always required to greatly influence the expression of a gene target or a biological function.
It is interesting to note that GALK1 and GALK2 were expressed and upregulated during the secretory activation. These enzymes convert galactose to galctose 1-phosphate, which is then converted to UDP-galactose. Whether free galactose is formed within or transported to the mammary epithelial cell after being synthesized in other tissues (e.g., liver) to feed lactose synthesis is still unclear. However, the expression pattern of the GALK may imply the presence of the free galactose. We have previously detected circulating free galactose concentration in the micromole range, which was approximately twofold higher in the lactating mothers compared with the nonlactating controls (34). Yet these speculations cannot be answered in this study.
Coordination of multiple hormones, including growth hormone, prolactin, insulin, steroid, and thyroid hormones, is necessary to ensure successful lactation (43). We have utilized the hormonal concentration in milk to describe the status and the potential role of the hormones during the initiation of lactation. The withdrawal of progesterone as evidenced by the precipitous fall in milk progesterone concentrations in conjunction with the increase in prolactin activity that triggers the onset of lactation is in agreement with previous studies (12, 17, 27, 48). The onset of the prolactin stimulation of lactose synthesis has been studied in cultured mouse mammary tissues, in which it was found that in concert with increased lactose synthesis, the activity of β4GALT was enhanced (19) and the tissue accumulation of mRNAs for both LALBA and β4GALT increased (16). Another postulated mechanism for prolactin control on lactose synthesis was through stimulation of the expression of GLUT1 in rats (15). However, these observations from cultured mouse tissue or rats did not support our findings, as we explained above.
For obvious reasons, of the limited number of transcripts involved in the GO related to carbohydrate metabolic process compared with the total that were significantly different from the baseline sample, (6 h; 438/16,622), IPA did not reveal a significant canonical pathway for prolactin signaling. We then explored the canonical pathways using the entire set of detected (16,622) transcripts. Accordingly, the ingenuity diagrams for the prolactin signaling pathway were utilized and overlaid with the expression values of the MFG gene list (Fig. 11). In the prolactin pathway, the gene expression of prolactin receptor increased severalfold by day 2. STAT5A and -B, one of the downstreams of PRL signaling, was upregulated. Therefore, activation of the prolactin pathway, not by increasing the plasma concentrations of prolactin but by increasing the cellular signaling as a result of increasing the receptor number, may play a key role in the secretory activation. Our findings suggest that STAT5 activation via prolactin could play a primary role in the increased expression of UGP2 and Golgi UDP-galactose transporter (SLC35A2), which we believe to be rate limiting for UDP-galactose synthesis and transport and thus lactose synthesis. Very interestingly, UGP2 has been shown to be one of the most upregulated genes as a result of STAT5 signaling in human hematopoietic stem cells (14). Similarly, the gene SLC35A2 was among several genes that showed decreased expression in the mice models of failed secretory activation and increased expression in response to prolactin via STAT5 activation in mouse MEC culture model (36).
In summary, we have demonstrated that genes controlling conversion of glucose to UDP-galactose (UGP2 and PGM1) and UDP-galactose transport into the Golgi (SLC35A2) may be rate limiting in the lactose synthesis. Progesterone withdrawal may be the signal that triggers a sharp increase in the expression of the prolactin receptor and thus prolactin signaling. STAT5 is downstream of the prolactin receptor, which may in turn induce UGP2 and SLC35A2 expression.
GRANTS
This project was supported by National Institutes of Health Grants RO1-DK-55478, HD-37857, MO1-RR-00188, and USDA/ARS 6250-5100. This work is a publication of the US Department of Agriculture/Agricultural Research Service Children's Nutrition Research Center, Department of Pediatrics, Baylor College of Medicine (Houston, TX). The contents of this publication do not necessarily reflect the views of policies of the US Department of Agriculture, nor does the mention of trade names, commercial products, or organizations imply endorsement from the US Government.
DISCLOSURES
The authors declare that there is no conflict of interest that would prejudice the impartiality of the scientific work. M. A. Mahmoud and D. L. Hadsell have nothing to declare. M. W. Haymond received an NIH-NIDDK-RO1 award for this study.
AUTHOR CONTRIBUTIONS
M.A.M., D.L.H., and M.W.H. did the conception and design of the research; M.A.M. performed the experiments; M.A.M. analyzed the data; M.A.M., D.L.H., and M.W.H. interpreted the results of the experiments; M.A.M. and M.W.H. prepared the figures; M.A.M. drafted the manuscript; M.A.M., D.L.H., and M.W.H. edited and revised the manuscript; M.A.M., D.L.H., and M.W.H. approved the final version of the manuscript.
ACKNOWLEDGMENTS
We thank the volunteers whose participation made this study possible. We gratefully acknowledge and thank our laboratory manager Dr. Susan Sharma, our research coordinators (Janette Gonzalez and Shawn Asphall), and our secretary Renee Elawar, who greatly facilitated the execution of these studies.
REFERENCES
- 1. Allen JC, Keller RP, Archer P, Neville MC. Studies in human lactation: milk composition and daily secretion rates of macronutrients in the first year of lactation. Am J Clin Nutr 54: 69– 80, 1991 [DOI] [PubMed] [Google Scholar]
- 2. Anderson SM, Rudolph MC, McManaman JL, Neville MC. Key stages in mammary gland development. Secretory activation in the mammary gland: it's not just about milk protein synthesis! Breast Cancer Res 9: 204, 2007 [DOI] [PMC free article] [PubMed] [Google Scholar]
- 3. Bartley JC, Abraham S, Chaikoff IL. Biosynthesis of lactose by mammary gland slices from the lactating rat. J Biol Chem 241: 1132– 1137, 1966 [PubMed] [Google Scholar]
- 4. Bickerstaffe R, Annison EF, Linzell JL. The metabolism of glucose, acetate, lipids and amino acids in lactating dairy cows. J Agric Sci 82: 71– 85, 1974 [Google Scholar]
- 5. Bionaz M, Loor JJ. Gene networks driving bovine mammary protein synthesis during the lactation cycle. Bioinform Biol Insights 5: 83– 98, 2011 [DOI] [PMC free article] [PubMed] [Google Scholar]
- 6. Brew K. Secretion of alpha-lactalbumin into milk and its relevance to the organization and control of lactose synthetase. Nature 222: 671– 672, 1969 [DOI] [PubMed] [Google Scholar]
- 7. Brew K, Vanaman TC, Hill RL. Comparison of the amino acid sequence of bovine alpha-lactalbumin and hens egg white lysozyme. J Biol Chem 242: 3747– 3749, 1967 [PubMed] [Google Scholar]
- 8. Bussmann LE, Ward S, Kuhn NJ. Lactose and fatty acid synthesis in lactating-rat mammary gland. Effects of starvation, re-feeding, and administration of insulin, adrenaline, streptozotocin and 2-bromo-alpha-ergocryptine. Biochem J 219: 173– 180, 1984 [DOI] [PMC free article] [PubMed] [Google Scholar]
- 9. Camps M, Vilaro S, Testar X, Palacin M, Zorzano A. High and polarized expression of GLUT1 glucose transporters in epithelial cells from mammary gland: acute down-regulation of GLUT1 carriers by weaning. Endocrinology 134: 924– 934, 1994 [DOI] [PubMed] [Google Scholar]
- 10. Carayannopoulos MO, Chi MM, Cui Y, Pingsterhaus JM, McKnight RA, Mueckler M, Devaskar SU, Moley KH. GLUT8 is a glucose transporter responsible for insulin-stimulated glucose uptake in the blastocyst. Proc Natl Acad Sci USA 97: 7313– 7318, 2000 [DOI] [PMC free article] [PubMed] [Google Scholar]
- 11. Casey TM, Plaut K. The role of glucocorticoids in secretory activation and milk secretion, a historical perspective. J Mammary Gland Biol Neoplasia 12: 293– 304, 2007 [DOI] [PubMed] [Google Scholar]
- 12. Deis RP, Delouis C. Lactogenesis induced by ovariectomy in pregnant rats and its regulation by oestrogen and progesterone. J Steroid Biochem 18: 687– 690, 1983 [DOI] [PubMed] [Google Scholar]
- 13. Edgar R, Domrachev M, Lash AE. Gene Expression Omnibus: NCBI gene expression and hybridization array data repository. Nucleic Acids Res 30: 207– 210, 2002 [DOI] [PMC free article] [PubMed] [Google Scholar]
- 14. Fatrai S, Wierenga AT, Daenen SM, Vellenga E, Schuringa JJ. Identification of HIF2alpha as an important STAT5 target gene in human hematopoietic stem cells. Blood 117: 3320– 3330, 2011 [DOI] [PubMed] [Google Scholar]
- 15. Fawcett HA, Baldwin SA, Flint DJ. Hormonal regulation of the glucose transporter GLUT I in the lactating rat mammary gland. Biochem Soc Trans 20: 17S, 1992 [DOI] [PubMed] [Google Scholar]
- 16. Golden KL, Rillema JA. Effects of prolactin on galactosyl transferase and alpha-lactalbumin mRNA accumulation in mouse mammary gland explants. Proc Soc Exp Biol Med 209: 392– 396, 1995 [DOI] [PubMed] [Google Scholar]
- 17. Hartmann PE, Trevethan P, Shelton JN. Progesterone and oestrogen and the initiation of lactation in ewes. J Endocrinol 59: 249– 259, 1973 [DOI] [PubMed] [Google Scholar]
- 18. Holt C. Swelling of Golgi vesicles in mammary secretory cells and its relation to the yield and quantitative composition of milk. J Theor Biol 101: 247– 261, 1983 [DOI] [PubMed] [Google Scholar]
- 19. Jagoda CA, Rillema JA. Temporal effect of prolactin on the activities of lactose synthetase, alpha-lactalbumin, and galactosyl transferase in mouse mammary gland explants. Proc Soc Exp Biol Med 197: 431– 434, 1991 [DOI] [PubMed] [Google Scholar]
- 20. Jones EA. Studies on the particulate lactose synthetase of mouse mammary gland and the role of -lactalbumin in the initiation of lactose synthesis. Biochem J 126: 67– 78, 1972 [DOI] [PMC free article] [PubMed] [Google Scholar]
- 21. Kaselonis GL, McCabe ER, Gray SM. Expression of hexokinase 1 and hexokinase 2 in mammary tissue of nonlactating and lactating rats: evaluation by RT-PCR. Mol Genet Metab 68: 371– 374, 1999 [DOI] [PubMed] [Google Scholar]
- 22. Kuhn NJ. Progesterone withdrawal as the lactogenic trigger in the rat. J Endocrinol 44: 39– 54, 1969 [DOI] [PubMed] [Google Scholar]
- 23. Kuhn NJ, Carrick DT, Wilde CJ. Lactose synthesis: the possibilities of regulation. J Dairy Sci 63: 328– 336, 1980 [DOI] [PubMed] [Google Scholar]
- 24. Kuhn NJ, White A. Milk glucose as an index of the intracellular glucose concentration of rat mammary gland. Biochem J 152: 153– 155, 1975 [DOI] [PMC free article] [PubMed] [Google Scholar]
- 25. Kuhn NJ, White A. The topography of lactose synthesis. Biochem J 148: 77– 84, 1975 [DOI] [PMC free article] [PubMed] [Google Scholar]
- 26. Linzell JL, Peaker M. Changes in mammary gland permeability at the onset of lactation in the goat: an effect on tight junctions? J Physiol 230: 13P– 14P, 1973 [PMC free article] [PubMed] [Google Scholar]
- 27. Loizzi RF. Progesterone withdrawal stimulates mammary gland tubulin polymerization in pregnant rats. Endocrinology 116: 2543– 2547, 1985 [DOI] [PubMed] [Google Scholar]
- 28. Maningat PD, Sen P, Rijnkels M, Hadsell DL, Bray MS, Haymond MW. Short-term administration of rhGH increases markers of cellular proliferation but not milk protein gene expression in normal lactating women. Physiol Genomics 43: 381– 391, 2011 [DOI] [PMC free article] [PubMed] [Google Scholar]
- 29. Maningat PD, Sen P, Rijnkels M, Sunehag AL, Hadsell DL, Bray M, Haymond MW. Gene expression in the human mammary epithelium during lactation: the milk fat globule transcriptome. Physiol Genomics 37: 12– 22, 2009 [DOI] [PMC free article] [PubMed] [Google Scholar]
- 30. Maningat PD, Sen P, Sunehag AL, Hadsell DL, Haymond MW. Regulation of gene expression in human mammary epithelium: effect of breast pumping. J Endocrinol 195: 503– 511, 2007 [DOI] [PubMed] [Google Scholar]
- 31. McVie-Wylie AJ, Lamson DR, Chen YT. Molecular cloning of a novel member of the GLUT family of transporters, SLC2a10 (GLUT10), localized on chromosome 20q13.1: a candidate gene for NIDDM susceptibility. Genomics 72: 113– 117, 2001 [DOI] [PubMed] [Google Scholar]
- 32. Mohammad MA, Sunehag AL, Chacko SK, Pontius AS, Maningat PD, Haymond MW. Mechanisms to conserve glucose in lactating women during a 42-h fast. Am J Physiol Endocrinol Metab 297: E879– E888, 2009 [DOI] [PMC free article] [PubMed] [Google Scholar]
- 33. Mohammad MA, Sunehag AL, Haymond MW. Effect of dietary macronutrient composition under moderate hypocaloric intake on maternal adaptation during lactation. Am J Clin Nutr 89: 1821– 1827, 2009 [DOI] [PMC free article] [PubMed] [Google Scholar]
- 34. Mohammad MA, Sunehag AL, Rodriguez LA, Haymond MW. Galactose promotes fat mobilization in obese lactating and nonlactating women. Am J Clin Nutr 93: 374– 381, 2010 [DOI] [PMC free article] [PubMed] [Google Scholar]
- 35. Murphy G, Ariyanayagam AD, Kuhn NJ. Progesterone and the metabolic control of the lactose biosynthetic pathway during lactogenesis in the rat. Biochem J 136: 1105– 1116, 1973 [DOI] [PMC free article] [PubMed] [Google Scholar]
- 36. Naylor MJ, Oakes SR, Gardiner-Garden M, Harris J, Blazek K, Ho TW, Li FC, Wynick D, Walker AM, Ormandy CJ. Transcriptional changes underlying the secretory activation phase of mammary gland development. Mol Endocrinol 19: 1868– 1883, 2005 [DOI] [PubMed] [Google Scholar]
- 37. Nemeth BA, Tsang SW, Geske RS, Haney PM. Golgi targeting of the GLUT1 glucose transporter in lactating mouse mammary gland. Pediatr Res 47: 444– 450, 2000 [DOI] [PubMed] [Google Scholar]
- 38. Neville MC. Introduction: alpha-lactalbumin, a multifunctional protein that specifies lactose synthesis in the Golgi. J Mammary Gland Biol Neoplasia 14: 211– 212, 2009 [DOI] [PubMed] [Google Scholar]
- 39. Neville MC. Introduction: tight junctions and secretory activation in the mammary gland. J Mammary Gland Biol Neoplasia 14: 269– 270, 2009 [DOI] [PubMed] [Google Scholar]
- 40. Neville MC, Allen JC, Archer PC, Casey CE, Seacat J, Keller RP, Lutes V, Rasbach J, Neifert M. Studies in human lactation: milk volume and nutrient composition during weaning and lactogenesis. Am J Clin Nutr 54: 81– 92, 1991 [DOI] [PubMed] [Google Scholar]
- 41. Neville MC, Hay WW, Jr, Fennessey P. Physiological significance of the concentration of human milk glucose. Protoplasma 159: 118– 128, 1990 [Google Scholar]
- 42. Neville MC, Keller R, Seacat J, Lutes V, Neifert M, Casey C, Allen J, Archer P. Studies in human lactation: milk volumes in lactating women during the onset of lactation and full lactation. Am J Clin Nutr 48: 1375– 1386, 1988 [DOI] [PubMed] [Google Scholar]
- 43. Neville MC, McFadden TB, Forsyth I. Hormonal regulation of mammary differentiation and milk secretion. J Mammary Gland Biol Neoplasia 7: 49– 66, 2002 [DOI] [PubMed] [Google Scholar]
- 44. Nguyen DA, Parlow AF, Neville MC. Hormonal regulation of tight junction closure in the mouse mammary epithelium during the transition from pregnancy to lactation. J Endocrinol 170: 347– 356, 2001 [DOI] [PubMed] [Google Scholar]
- 45. Nicholas KR, Hartmann PE. Progressive changes in plasma progesterone, prolactin and corticosteroid levels during late pregnancy and the initiation of lactose synthesis in the rat. Aust J Biol Sci 34: 445– 454, 1981 [DOI] [PubMed] [Google Scholar]
- 46. Phay JE, Hussain HB, Moley JF. Cloning and expression analysis of a novel member of the facilitative glucose transporter family, SLC2A9 (GLUT9). Genomics 66: 217– 220, 2000 [DOI] [PubMed] [Google Scholar]
- 47. Powell JT, Brew K. On the interaction of alpha-lactalbumin and galactosyltransferase during lactose synthesis. J Biol Chem 250: 6337– 6343, 1975 [PubMed] [Google Scholar]
- 48. Rosen JM, O'Neal DL, McHugh JE, Comstock JP. Progesterone-mediated inhibition of casein mRNA and polysomal casein synthesis in the rat mammary gland during pregnancy. Biochemistry 17: 290– 297, 1978 [DOI] [PubMed] [Google Scholar]
- 49. Rudolph MC, McManaman JL, Hunter L, Phang T, Neville MC. Functional development of the mammary gland: use of expression profiling and trajectory clustering to reveal changes in gene expression during pregnancy, lactation, and involution. J Mammary Gland Biol Neoplasia 8: 287– 307, 2003 [DOI] [PubMed] [Google Scholar]
- 50. Rudolph MC, McManaman JL, Phang T, Russell T, Kominsky DJ, Serkova NJ, Stein T, Anderson SM, Neville MC. Metabolic regulation in the lactating mammary gland: a lipid synthesizing machine. Physiol Genomics 28: 323– 336, 2007 [DOI] [PubMed] [Google Scholar]
- 51. Rudolph MC, Russell TD, Webb P, Neville MC, Anderson SM. Prolactin-mediated regulation of lipid biosynthesis genes in vivo in the lactating mammary epithelial cell. Am J Physiol Endocrinol Metab 300: E1059– E1068, 2011 [DOI] [PMC free article] [PubMed] [Google Scholar]
- 52. Saint L, Smith M, Hartmann PE. The yield and nutrient content of colostrum and milk of women from giving birth to 1 month post-partum. Br J Nutr 52: 87– 95, 1984 [DOI] [PubMed] [Google Scholar]
- 53. Scott RA, Beuman DE, Clark JH. Cellular gluconeogenesis by lactating bovine mammary tissue. J Dairy Sci 59: 50– 56, 1976 [DOI] [PubMed] [Google Scholar]
- 54. Shepherd PR, Gould GW, Colville CA, McCoid SC, Gibbs EM, Kahn BB. Distribution of GLUT3 glucose transporter protein in human tissues. Biochem Biophys Res Commun 188: 149– 154, 1992 [DOI] [PubMed] [Google Scholar]
- 55. Sunehag AL, Louie K, Bier JL, Tigas S, Haymond MW. Hexoneogenesis in the human breast during lactation. J Clin Endocrinol Metab 87: 297– 301, 2002 [DOI] [PubMed] [Google Scholar]
- 56. Tigas S, Sunehag A, Haymond MW. Metabolic adaptation to feeding and fasting during lactation in humans. J Clin Endocrinol Metab 87: 302– 307, 2002 [DOI] [PubMed] [Google Scholar]
- 57. Watkins WM, Hassid WZ. Synthesis of Lactose by Particulate Enzyme Preparations from Guinea Pig and Bovine Mammary Glands. Science 136: 329, 1962 [DOI] [PubMed] [Google Scholar]
- 58. Wilde CJ, Kuhn NJ. Lactose synthesis and the utilisation of glucose by rat mammary acini. Int J Biochem 13: 311– 316, 1981 [DOI] [PubMed] [Google Scholar]
- 59. Xiao CT, Cant JP. Relationship between glucose transport and metabolism in isolated bovine mammary epithelial cells. J Dairy Sci 88: 2794– 2805, 2005 [DOI] [PubMed] [Google Scholar]
- 60. Young CD, Lewis AS, Rudolph MC, Ruehle MD, Jackman MR, Yun UJ, Ilkun O, Pereira R, Abel ED, Anderson SM. Modulation of glucose transporter 1 (GLUT1) expression levels alters mouse mammary tumor cell growth in vitro and in vivo. PLoS One 6: e23205, 2011 [DOI] [PMC free article] [PubMed] [Google Scholar]
- 61. Zhao FQ, Keating AF. Expression and regulation of glucose transporters in the bovine mammary gland. J Dairy Sci 90, Suppl 1: E76– E86, 2007 [DOI] [PubMed] [Google Scholar]


