

Abstract
Objective
To analyze the impact of hospital mergers on treatment intensity and health outcomes.
Data
Hospital inpatient data from California for 1990 through 2006, encompassing 40 mergers.
Study Design
I used a geographic-based IV approach to determine the effect of a zip code's exposure to a merger. The merged facility's market share represents exposure, instrumented with combined premerge shares. Additional specifications include Herfindahl Index (HHI), instrumented with predicted change in HHI.
Results
The primary specification results indicate that merger completion is associated with a 3.7 percent increase in the utilization of bypass surgery and angioplasty and a 1.7 percent increase in inpatient mortality above averages in 2000 for the average zip code. Isolating the competition mechanism mutes the treatment intensity result slightly, but it more than doubles the merger exposure effect on inpatient mortality to a 3.9 percent increase. The competition mechanism is associated with a sizeable increase in number of procedures.
Conclusions
Unlike previous studies, this analysis finds that hospital mergers are associated with increased treatment intensity and higher inpatient mortality rates among heart disease patients. Access to additional outcome measures such as 30-day mortality and readmission rates might shed additional light on whether the relationship between these outcomes is causal.
Keywords: Hospitals, mergers, quality
Consolidation is a common response to financial and competitive pressures in many markets. The primary concern is often financial: will the merger increase prices? The health care sector involves additional complications. For example, both dimensions of demand for health care services are affected by third parties: treatments are prescribed by physicians while health insurance shields consumers from the full costs of care. Prices do not reflect their demand curve but are instead set by the insurer for public insurance plans or through negotiations between the insurer and providers in private insurance plans. Because of these factors, the implications of price changes on consumers may be more difficult to disentangle. Additionally, the quality of health care services is important for both survival and quality of life. Thus, the impact of consolidation in health care markets on nonprice dimensions, such as quality, may be at least as important as its impact on price.
I define a hospital merger as the consolidation of two facilities into a single legal entity. The license-relinquishing facility becomes a satellite campus of the license-retaining facility and hospital boards and physician and nursing staffs are unified. Despite the intensity of this transaction, the average rate of hospital mergers doubled from 12 per year in the mid-1980s to 24 per year in the early 1990s (Bazzoli et al. 2002). Pressures along both price and quantity dimensions may have contributed to this wave of mergers. Average Medicare hospital prices fell initially with the institution of the Prospective Payment System in 1984 and again in 1988 with a strengthening in the requirements for elevated payments (Coulam and Gaumer 1991). The advent of managed care in the 1990s reduced hospital prices within the private insurance market (Cutler, McClellan, and Newhouse 2000; Dor, Grossman, and Koroukian 2004; Shen and Melnick 2006). This fall in average prices coincided with a reduction in demand for hospital services. Vogt and Town (2006) suggest that technological advances created an excess capacity through shifting many inpatient procedures to an outpatient setting and reducing length of stay for others. By creating a single legal entity, a merger enables capacity reduction through consolidating services between two facilities without being subject to state regulations (Dranove and Lindrooth 2003).
Hospital mergers have the potential to affect quality of care through several mechanisms. If a merger creates financial benefits, the consolidated hospital may reinvest these gains into quality improvement. Likewise, service consolidation may increase procedure volume and consequently enhance care provision. However, reducing competition may reduce the incentive to improve quality to attract patients. Finally, the disruption caused by unifying two independent facilities may negatively affect quality, particularly in the immediate aftermath of the merger.
Financial Impacts
Hospital mergers may create financial gains both through achieving economies of scale and negotiating higher prices. The literature suggests that hospital mergers, particularly facility-level mergers, are capable of attaining substantial cost savings (Connor et al. 1997; Dranove and Lindrooth 2003). In addition, both anecdotal and empirical evidence suggests that a merged facility has additional leverage to negotiate larger reimbursements from private insurance companies (Capps, Dranove, and Satterthwaite 2003; Devers et al. 2003; Dafny 2009). The combination of cost efficiencies and higher prices provides a merged facility with more resources. While these resources may not be invested in quality improvements, they are unlikely to reduce quality. Thus, the financial impact of a merger on quality should be, at worst, neutral.
Volume-Outcome Relationship
Hospital mergers often involve service consolidation. At minimum, physician and nursing staffs are unified between the facilities. If gained experience and shared expertise improve outcomes, then mergers have the potential to improve outcomes and quality through this channel as well. Gaynor (2006) provides a review of the recent volume-outcome studies within the economics literature. Several studies find that outcomes improve when surgeons perform more of a particular procedure (Ho 2002; Gaynor, Seider, and Vogt 2004, 2005; Gowrisankaran, Ho, and Town 2006). Overall, this literature suggests that the service consolidation generated by many mergers and the resulting increase in volume at service-retaining facilities (including nonmerging facilities) are likely to improve surgical outcomes.
Competition and Quality
There are several theories that suggest hospital quality should increase with competition. In general, the mechanism behind this relationship is that consumers face little difference in out-of-pocket expenditures across hospitals, leading hospitals to compete for patients on a quality dimension instead. Several of these theories are reviewed in Gaynor (2006).
Most of the recent empirical research on hospital competition and quality is consistent with these theories. A seminal paper on this topic, Kessler and McClellan (2000), uses Medicare heart attack data and a patient choice model, and finds that hospitals facing more competition have a lower incidence of adverse health events. Several researchers have built upon this foundation and have largely corroborated the linkage between competition and quality (Sari 2002; Gowrisankaran and Town 2003; Kessler and Geppert 2005). To the extent that the competition-quality relationship is causal, these findings suggest that this channel would offset the effect of the financial and volume-outcome channels.
Consolidation and Quality
To date, two papers investigate the direct impact of hospital mergers on measures of quality (Ho and Hamilton 2000; Capps 2005). These studies use similar methodology: both analyze the difference in quality measures before and after a merger as compared to nonmerging hospitals. Both study 10–11 mergers across a 5-year time period. Neither finds mergers to have a significant effect on quality, though the relatively small number of mergers and short time period studied may have reduced the power of their analyses. One concern with this hospital-based approach is that comparing merging hospitals to nonmerging hospitals requires assuming that nonmerging hospitals do not respond to the neighboring merger. The evidence that nonmerging hospitals raise prices in response to nearby mergers (Dafny 2009) suggests that they may respond along the quality dimension as well. Another concern with this approach is the potential change in patient composition. If perceived changes in quality affect postmerger patient choices, then this approach may produce biased estimates.
This paper builds upon the previous literature in a number of ways. I address many of the concerns detailed above with a geographic approach: I measure health outcomes by zip code. By exploiting the variation in exposure to a merger across zip codes, I identify the average impact of a merger on all patients affected by the merger. Exposure is measured as the share of patients in the zip code who are discharged by the merged facility. While this method cannot disentangle the effects of changes in the merged facility from changes in nonmerging facilities or patient sorting, it will capture the full market-level impact.
Forty mergers transpired throughout California from 1990 to 2005. This analysis utilizes inpatient discharge data through 2006 to study the impact of these mergers on inpatient mortality and treatment intensity among heart disease patients. I extend this analysis by isolating the competition mechanism from overall exposure to a merger. Finally, I will replicate the hospital-based analysis with this larger panel of mergers to compare its results with those from the geographic approach.
Data and Methods
Data
California's Office of Statewide Health Planning and Development (OSHPD) provided the annual inpatient discharge dataset for this project. The data includes patient-level data on demographic characteristics, payment, diagnoses, and procedures performed for every inpatient discharge. I limit my sample to discharges from general acute facilities because treatment at long-term care facilities likely consists of post-treatment rehabilitative care.
I restrict my analysis to patients with heart disease, allowing me to construct relevant outcome variables and comorbidity factors to use as control variables. Limiting my analysis to patients with a heart attack (acute myocardial infarction, AMI) might be ideal because AMI requires immediate hospitalization, minimizing potential selection bias in admission decisions. However, there are too few zip codes with enough AMI discharges in all quarters. Instead, I include all individuals with a chronic or acute diagnosis of ischemic heart disease (IHD)6 and create a balanced panel of 697 zip codes with at least 15 IHD discharges in all 68 quarters. Ninety percent of these zip codes are exposed to a merger during the study period. As IHD varies in severity, hospitals may have varying decision rules for admitting a heart disease patient. This issue should not be problematic unless a merger induces a change in admission criteria. I demonstrate below that mergers do not appear to impact the admission criteria for IHD patients.
Table 1 reports descriptive statistics for IHD patients and their hospital experiences. This subset of discharges is disproportionately male, older, and covered by Medicare. Additionally, the percentage of discharges covered by private insurance fell by 25 percent. These statistics suggest conflicting implications for cardiac quality provision. Hospitals had a smaller share of patients for whom they could negotiate higher prices to fund quality investments, yet they faced stronger competitive pressures to provide quality from the Medicare market. Dafny (2005), however, found evidence that hospitals optimize quality decisions across all services rather than considering each diagnostic category as a separate market in which to compete.
Table 1.
Descriptive Statistics for All Ischemic Heart Disease Diagnoses for Selected Years
| Year | 1990 | 1995 | 2000 | 2005 |
|---|---|---|---|---|
| % With the following demographic characteristics | ||||
| Male | 58.2 | 58.4 | 57.2 | 58.4 |
| Black | 6.6 | 6.7 | 6.5 | 7.2 |
| Hispanic | 9.0 | 11.4 | 11.5 | 14.5 |
| Ages 60–74 | 43.6 | 41.7 | 36.9 | 35.1 |
| Ages 75+ | 31.1 | 34.7 | 40.8 | 41.6 |
| % With the following expected payer | ||||
| Medicare | 57.2 | 58.3 | 61.7 | 62.9 |
| Private | 30.5 | 28.9 | 25.8 | 22.9 |
| Average number of procedures | 2.9 | 2.8 | 2.8 | 3.0 |
| Average length of stay (days) | 6.2 | 5.1 | 4.6 | 4.4 |
| Average charges ($) | 17,395 | 25,431 | 42,557 | 66,389 |
| Average charges (1990$) | 17,395 | 21,810 | 32,301 | 44,430 |
| % Received bypass surgery or angioplasty | 22.4 | 25.8 | 27.3 | 27.9 |
| % Treat within 1 day | 53.8 | 52.7 | 47.3 | 47.9 |
| % With the following comorbidity diagnoses | ||||
| Heart attack | 25.5 | 25.9 | 26.4 | 24.2 |
| Pneumonia | 2.0 | 2.6 | 3.3 | 4.7 |
| Diabetes | 21.2 | 27.0 | 32.8 | 38.4 |
| Heart failure | 25.8 | 31.2 | 32.6 | 36.8 |
| Hypertension | 34.2 | 49.4 | 60.3 | 72.0 |
| % With the following admission and discharge characteristics | ||||
| Admitted from (own) ER | 55.2 | 53.6 | 59.3 | 61.6 |
| Discharged home | 73.0 | 68.5 | 67.1 | 67.1 |
| Die | 4.6 | 4.0 | 3.7 | 3.2 |
| Average no. of ischemic discharges | 1,122 | 1,303 | 1,523 | 1,555 |
| Average no. of ischemic discharges (unweighted) | 508 | 588 | 695 | 713 |
| No. of hospitals | 461 | 448 | 408 | 382 |
| No. of mergers completed (cumulative) | 4 | 14 | 31 | 40 |
Notes. All averages are weighted by number of discharges unless otherwise specified. The data sample includes all discharges with a major diagnostic category of “circulatory system, diseases & disorders” (5) and any diagnostic code of “Ischemic Heart Disease” (ICD-9 codes 410–414) in relevant hospitals. Numbers of hospitals and mergers are as of the end of the calendar year.
Illness severity and treatment intensity both increased over the study period. The prevalence of diabetes, hypertension, and heart failure rose substantially, as did the likelihood of receiving bypass surgery or angioplasty. Average charges more than tripled, though these represent list prices rather than transaction prices. Inpatient mortality and average length of stay fell by 30 percent. It is notable that the number of hospitals treating IHD patients fell by nearly 20 percent, while average IHD patient volume rose by 40 percent. These changes were likely driven by both hospital closures and mergers over the time period.
Background on California Hospital Mergers
Forty hospital mergers occurred between 1990 and 2005. I used the discharge data appendix on consolidations and Internet research to identify and confirm each merger. Twenty-seven of these mergers involved nonprofit hospitals, 10 involved for-profit hospitals, and 3 involved county or district hospitals. Mergers were more likely to take place in urban areas such as Los Angeles or San Francisco, particularly during the 1990s. Merging hospitals were often within close proximity: 25 pairs were located within 5 miles of each other, with nearly all of the remainder within 15 miles. The one exception involved a rural hospital in danger of closing. Nearly, one-third of mergers occurred simultaneously with ownership consolidation. Ten mergers transpired within 5 years of ownership consolidation. The remainder involved hospitals under the same ownership for over 5 years or since 1990.5
An annual financial dataset provided by OSHPD suggests that consolidating facilities may consolidate services as well (see Table S1). For example, merged hospitals average 397 beds, while average premerge parent hospitals and satellites average 264 and 168, respectively. Likewise, several diagnostic and other service offerings overlap. Roughly one-half of parents and one-quarter of satellites offer neonatal intensive care units, compared to 65 percent of merged hospitals. Two-thirds of merged facilities offered MRI services, compared to 54 percent of parents and 43 percent of satellites. This pattern suggests that hospitals may reduce overlapped service provision to reduce costs.
The effect of a merger on the local competitive landscape varies. The Eden Medical Center/San Leandro Hospital merger in 2004 had little impact on concentration because of limited overlap in the two facilities’ markets. Despite individual shares above 10 percent in several zip codes, the greatest change in the Herfindahl Index (HHI), or sum of squared market shares, was from 0.12 to 0.20. The St. Joseph Hospital-Eureka/General Hospital of Eureka merger in 2000, however, greatly increased local concentration. Several zip codes experienced HHI increases >0.15, resulting in HHIs of 0.88 and market shares of 94 percent. The competitive impact of other mergers fell between these two examples.
Empirical Framework
Identifying the causal impact of a merger within a hospital is difficult because it may induce patient reallocation, confounding the identification of outcome or treatment changes. Figure 1 demonstrates the varied responses to hospital mergers in two communities. Some mergers result in widespread decline in merged shares, as illustrated by the Eden Medical Center/San Leandro Hospital merger in 2004. Others induce a more varied response, such as the 1999 Fresno Community Hospital/Valley Medical Center merger. This heterogeneity is unlikely to be entirely random, suggesting that patient composition changes could bias a hospital-based analysis.
Figure 1.
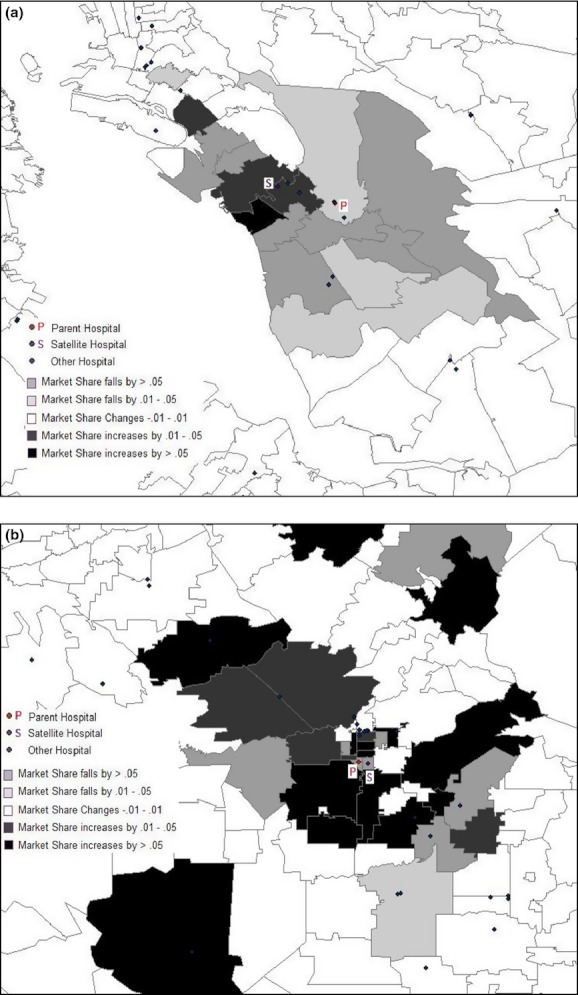
Changes in Merged Share of the Market over 1 Year. (A) Merger of Eden Medical Center and San Leandro Hospital in San Leandro. (B) Merger of Fresno Community Hospital and Valley Medical Center in Fresno. Note: Merged share of the market is the market share of the merged facility in a zip code exposed to a merger. Only zip codes with at least 15 heart disease discharges in the merging quarter are shaded
Reallocation could stem from two sources. The closest facility offering a needed service may no longer be one of the merged facilities, or the public's perception of a merged facility's quality relative to other local hospitals could change. Sicker patients might be willing to travel farther for quality care, causing a negative correlation between perceived quality change and average patient health at a merged facility. While the first scenario is unlikely to bias hospital-based analyses, the latter could bias quality change estimates.
I analyze outcomes within geographic areas because their population is unlikely to respond to a merger. Previous hospital merger research has used geographic areas such as counties or incorporated overlapping fixed radius market definitions. Both of these methods have drawbacks. Counties are large enough that individuals on opposite ends of the market face a different set of nearby hospital choices. Individuals near a market border may also be closer to a hospital in another market. Fixed radius definitions are difficult to establish because hospitals of different sizes and service offerings have different geographic reaches.
I instead utilize a zip code–level analysis. Zip codes are generally small enough that all individuals face a similar set of relevant hospital choices, and patient choices determine the relevant hospitals. Exposure to a merger is measured as the share of patients within a zip code discharged from a merged facility. This methodology exploits the heterogeneity of exposure to a merger to measure its effect. Merger effects on quality or treatment practices should be more visible in zip codes with higher merged facility shares. And because mergers are unlikely to induce changes in residence, I can compare premerger and postmerger outcomes for plausibly similar populations.
The extent to which outside factors may affect both hospital mergers and outcomes represents a limitation to this approach. For example, a shift to managed care or consolidation in the local insurance market may result in lower negotiated reimbursement rates. The resulting reduction in revenue might lead to both additional hospital mergers and less intensive treatment if these services become less profitable. Similarly, a physician or nursing shortage could make mergers more appealing to enable consolidation while simultaneously leading to less intensive treatment and worse quality if resources are stretched too thinly. However, while such factors might be anticipated, these types of local market conditions would likely predate a merger to induce it to occur, and would thus also cause changes in the outcome variables before the merger. I provide evidence below that merger exposure is not associated with changes in outcome variables until after the merger is completed.
A zip code–level analysis also does not isolate changes at the merged facility from the merger's ripple effects, such as nonmerging hospital responses to changes in the competitive landscape and patient responses to relative changes in quality. The zip code approach does, however, allow me to investigate the merger's market-level impact.
Relying on merged market shares is also subject to selection bias because shares respond to hospital choice. I use a solution similar to the approach used by Town et al. (2006) and predict postmerger shares with the sum of merging facility shares from 1 year before the merger.4 Even if merger discussions had begun 1 year before, it is unlikely that this information would be publicized, rendering patient choices unaffected by the impending merger. This predicted exposure variable equals zero before a merger has transpired and accumulates as mergers affect a zip code.3 Thus, the IV estimates will only use the variation in postmerge shares that comes from the expected impact of the merger ex ante, alleviating the selection bias concern.
My analysis examines the impact of hospital mergers on treatment intensity, the likelihood of receiving treatment within 1 day, and inpatient mortality. The primary intensity measure is the percentage of patients receiving bypass surgery or angioplasty. Hospital mergers may increase use of these intensive heart surgeries if they become more accessible after the merger. Eighteen merging pairs offered cardiac surgery services, 2 with overlapping cardiac surgery capabilities and 16 without. Consolidation of all cardiology services for these 16 facilities would make these procedures more accessible to those who would have otherwise chosen the nonoffering facility. While a patient may be more likely to choose a hospital with these capabilities when she expects to need them, distance to the hospital may sometimes be a greater priority.
The number of procedures is another measure of treatment intensity, while the likelihood of receiving treatment within 1 day could reflect quality in that delays may be associated with treatment by less-qualified physicians (Doyle, Ewer, and Wagner 2008), overcrowding, or understaffing. Inpatient mortality is the final outcome measure. While it is a low probability and extreme adverse event, it is also the clearest measure of poor outcomes. Because discharge practices may affect inpatient mortality, I include average length of stay as a companion outcome.
I control for several demographic characteristics such as average age and the percentage of zip code discharges in categories for race, gender, and insurance status. I include the percentage of discharges with comorbidity diagnoses such as diabetes, heart failure, and pneumonia. I also include quarter and zip code fixed effects, and some specifications include hospital referral region (HRR)-specific trends to account for differing trends in local treatment and health patterns. Standard errors are clustered by zip code.
This model is identified on four main assumptions. First, while the specific hospitals that merge are endogenous, merger timing is not. As described above, completing a merger involves a complex negotiation process. Thus, it is difficult to predict when a merger will be finalized, regardless of when negotiations begin. Second, the merger does not affect the composition of patients residing within a zip code. While available hospitals and their quality may affect housing choices, a merger is unlikely to induce a widespread decision to relocate. The third assumption is that premerge shares of discharges are not affected by the impending merger. As a robustness check, I performed the same analysis using shares from 2 years before the merger. The results from this analysis are very similar in magnitude and significance to those detailed below.
The fourth assumption is that merging hospitals do not change their admission criteria for IHD patients. I test this assumption by regressing the share of nondiscretionary admissions on premerge shares. Nondiscretionary admissions, by definition, should not be affected by a change in admission policies. Thus, their share of admissions would rise with a tightening of admission criteria and vice versa. I approximate nondiscretionary admissions with AMI admissions and admissions through the ER. Results are mixed without HRR trends, as percent AMI yields a statistically significant coefficient of 0.023 and percent admitted through the ER yields a statistically insignificant coefficient of −0.007. However, controlling for local trends yields statistically insignificant coefficients of 0.008 and 0.011.2 In aggregate, these results suggest that admission practices at merged facilities changed little, if at all, after a merger.
Results
Table 2 reports the first-stage results between predicted and actual merged shares. Columns (1–2) and (5–6) demonstrate that the coefficient on premerge share is a precisely estimated 0.84 with or without trends. The large F-statistics suggest a strong first-stage relationship. Columns (3–4) and (7–8) report the results from interacting the premerge shares with five timing variables. Merged facilities appear to retain most of their market share several years after the merger transpires.
Table 2.
First-Stage Relationship between Merged Share and Premerge Share
| Without Hospital Referral Region Trends | With Hospital Referral Region Trends | |||||||
|---|---|---|---|---|---|---|---|---|
| (1) | (2) | (3) | (4) | (5) | (6) | (7) | (8) | |
| Premerge share | 0.839 (0.020)*** | 0.838 (0.020)*** | 0.834 (0.021)*** | 0.835 (0.021)*** | ||||
| Premerge share × year 1 (post) | 0.823 (0.022)*** | 0.822 (0.021)*** | 0.819 (0.022)*** | 0.818 (0.022)*** | ||||
| Premerge share × year 2 (post) | 0.807 (0.023)*** | 0.805 (0.022)*** | 0.802 (0.024)*** | 0.801 (0.023)*** | ||||
| Premerge share × year 3 (post) | 0.817 (0.022)*** | 0.815 (0.022)*** | 0.812 (0.023)*** | 0.811 (0.023)*** | ||||
| Premerge share × year 4 (post) | 0.807 (0.021)*** | 0.806 (0.021)*** | 0.803 (0.022)*** | 0.802 (0.022)*** | ||||
| Premerge share × year 5+ (post) | 0.794 (0.023)*** | 0.793 (0.023)*** | 0.781 (0.025)*** | 0.782 (0.025)*** | ||||
| R2 | 0.92 | 0.92 | 0.92 | 0.92 | 0.93 | 0.93 | 0.92 | 0.92 |
| F-statistic for instrument(s) | 1730.85 | 1761.39 | 323.86 | 331.03 | 1575.2 | 1600.73 | 296.07 | 301.49 |
| Control variables | X | X | X | X | ||||
| Observations | 47,396 | 47,396 | 47,396 | 47,396 | 47,396 | 47,396 | 47,396 | 47,396 |
Notes. Robust standard errors in parentheses.
Significant at 10%;
Significant at 5%;
Significant at 1%.
Zip codes are only included if they have 15 or more discharges in every quarter. All regressions include quarter and zip code fixed effects and are weighted by the number of heart disease discharges. Standard errors are clustered by zip code. Control variables include the percentage of discharges with demographic characteristics such as race, gender, and age categories; with expected payer such as Medicare and private insurance; with comorbidities such as hypertension, diabetes, and heart failure; admission through the ER; and a constant.
Table 3 reports the OLS and IV regression results for each of the five dependent variables. The top two panels report the OLS results, whereas the bottom two panels report the IV results. Columns (1–2) of the first two panels suggest that hospital mergers are associated with increased utilization of intensive heart surgeries, regardless of trend inclusion. The average zip code exposed to a merger has a merged share of 0.204. The coefficient of 0.050 in column (2) of the second panel implies that intensive surgery utilization increased by 1.0 percentage points in this zip code. This point estimate represents a 3.7 percent increase above the 2000 average of 27.3 percent. Zip codes with larger exposure to a merger were affected proportionally to their share.
Table 3.
Regression Results
| % Received Intensive Treatment | % Treated Within 1 Day | Average No. of Procedures | % Die in Hospital | Average Length of Stay | ||||||
|---|---|---|---|---|---|---|---|---|---|---|
| (1) | (2) | (3) | (4) | (5) | (6) | (7) | (8) | (9) | (10) | |
| Panel 1: OLS without hospital referral region trends | ||||||||||
| Merged share | 0.048 (0.010)*** | 0.043 (0.009)*** | 0.084 (0.018)*** | 0.077 (0.018)*** | 0.522 (0.122) *** | 0.452 (0.122) *** | 0.005 (0.001) *** | 0.002 (0.001)* | 0.230 (0.145) | 0.054 (0.102) |
| R2 | 0.6 | 0.68 | 0.48 | 0.52 | 0.48 | 0.52 | 0.11 | 0.16 | 0.69 | 0.69 |
| Panel 2: OLS with hospital referral region trends | ||||||||||
| Merged share | 0.048 (0.008)*** | 0.050 (0.008)*** | 0.013 (0.021) | 0.016 (0.022) | 0.285 (0.120)** | 0.276 (0.121)** | 0.003 (0.002)* | 0.002 (0.001) | 0.277 (0.126)** | 0.221 (0.119)* |
| R2 | 0.62 | 0.69 | 0.52 | 0.55 | 0.53 | 0.56 | 0.11 | 0.16 | 0.69 | 0.7 |
| Panel 3: IV without hospital referral region trends | ||||||||||
| Merged share | 0.043 (0.009)*** | 0.041 (0.008)*** | 0.109 (0.019)*** | 0.106 (0.018)*** | 0.593 (0.122)*** | 0.533 (0.119)*** | 0.007 (0.002)*** | 0.003 (0.001)** | 0.330 (0.155)** | 0.195 (0.144) |
| R2 | 0.6 | 0.68 | 0.48 | 0.52 | 0.48 | 0.52 | 0.11 | 0.16 | 0.69 | 0.69 |
| Panel 4: IV with hospital referral region trends | ||||||||||
| Merged share | 0.045 (0.010)*** | 0.050 (0.008)*** | 0.029 (0.022) | 0.035 (0.022) | 0.395 (0.125)*** | 0.392 (0.124)*** | 0.005 (0.002)*** | 0.003 (0.002)* | 0.414 (0.124)*** | 0.300 (0.116)*** |
| R2 | 0.62 | 0.69 | 0.52 | 0.55 | 0.53 | 0.56 | 0.11 | 0.16 | 0.69 | 0.7 |
| Control variables | X | X | X | X | X | |||||
| Observations | 47,396 | 47,396 | 47,396 | 47,396 | 47,396 | 47,396 | 47,396 | 47,396 | 47,396 | 47,396 |
Notes. Robust standard errors in parentheses.
Significant at 10%;
Significant at 5%;
Significant at 1%.
Zip codes are only included if they have 15 or more discharges in every quarter. All regressions include quarter and zip code fixed effects and are weighted by the number of heart disease discharges. Standard errors are clustered by zip code. Control variables include the percentage of discharges with demographic characteristics such as race, gender, and age categories; with expected payer such as Medicare and private insurance; with comorbidities such as hypertension, diabetes, and heart failure; admission through the ER; and a constant.
The next four columns in Table 3 list the coefficients for receiving primary treatment within 1 day and the average number of procedures. Both coefficients are statistically significant in the specifications without trends yet fall substantially once trends are included. For the average zip code, the specifications with trends suggest that individuals are no more likely to receive treatment within 1 day and they receive 2.0 percent more procedures.
The final two outcomes, inpatient mortality and average length of stay, are listed in the remaining columns. These outcomes are discussed together because hospital discharge practices could affect inpatient mortality rates. A decrease in inpatient mortality might be dubious coupled with a decrease in average length of stay. The OLS results suggest a minimal and marginally statistically significant effect on inpatient mortality and average length of stay. These point estimates suggest a 1.1 percent increase in inpatient mortality and less than a 1 percent increase in average length of stay for the average zip code, though neither estimate is precise.
OLS results may be biased if individuals respond to a perceived quality change. The last two panels of Table 3 report the IV specification results. The IV specifications suggest a similar or slightly larger increase in treatment intensity. The coefficients for surgical utilization remain the same, though the coefficients for receiving treatment within 1 day and number of procedures are larger. For example, the coefficient of 0.392 in column (6) of panel 4 suggests that the average number of procedures rises by 2.9 percent for the mean zip code. Since surgery utilization increases 28 percent more than the number of procedures, the increase in surgeries is likely replacing less intensive procedures in some cases and adding to them in others.
The difference between OLS- and IV-estimated inpatient mortality coefficients is more striking. The coefficient on merged share increases by 50 percent to 0.003 with and without trends, though it is not quite significant at the 5 percent level in the latter. For the average zip code, this point estimate suggests an increase in inpatient mortality of 0.0006 percentage points, or a 1.7 percent increase above the 2000 average of 3.7 percent. The coefficients for average length of stay increase as well, and the specification with trends suggests that length of stay increases by 1.3 percent and may contribute to some of the increase in inpatient mortality.
As a specification check, I estimated a reduced form model in which the instrument, premerge share, was interacted with timing dummy variables for premerger and postmerger time periods. Table S2 suggests that the changes associated with a merger are not transitory, nor do outcomes change before the merger transpires. The one exception is for the likelihood of receiving treatment within 1 day. In these specifications, as in the OLS and IV specifications, the coefficients for the timing interacted share variables fall by half or more and lose statistical significance when trends are included.
Isolating the Competition Mechanism
The main specification does not allow for attributing outcomes to any particular causal mechanism. To explore the effects of changes in the competitive environment on hospital outcomes, I add HHI as an explanatory variable, instrumented with predicted change in HHI. Predicted change in HHI is constructed by calculating the change in HHI from combining premerge shares into a single entity. The strength of the instruments remains strong with this addition; the F-statistics are well above 10 for each of the relevant first-stage regressions, and their predictive power continues in the years following the merger (see Table S3).
The first two panels of Table 4 report the results from these IV specifications without and with trends. These results suggest that overall exposure drives the intensive surgery result, while increased concentration drives the increase in procedures. These specifications also suggest a much larger impact on number of procedures. The mean HHI in a zip code affected by a merger is 0.285, so the coefficient of 3.298 implies an increase of 0.9 procedures—a 34 percent increase.
Table 4.
Alternate Specifications
| % Received Intensive Treatment | % Treated within 1 Day | Average No. of Procedures | % Die in Hospital | Average Length of Stay | ||||||
|---|---|---|---|---|---|---|---|---|---|---|
| (1) | (2) | (3) | (4) | (5) | (6) | (7) | (8) | (9) | (10) | |
| Panel 1: IV with HHI; without hospital referral region time trends | ||||||||||
| Merged share | 0.037 (0.012)*** | 0.023 (0.010)** | 0.086 (0.029)*** | 0.065 (0.028)** | 0.332 (0.171)* | 0.167 (0.169) | 0.009 (0.003)*** | 0.006 (0.002)*** | 0.322 (0.225) | 0.198 (0.206) |
| HHI | 0.045 (0.077) | 0.136 (0.070)* | 0.163 (0.179) | 0.317 (0.200) | 1.853 (0.925)** | 2.772 (1.054)*** | −0.013 (0.015) | −0.020 (0.015) | 0.055 (1.025) | −0.024 (0.951) |
| R2 | 0.60 | 0.68 | 0.47 | 0.49 | 0.46 | 0.49 | 0.11 | 0.16 | 0.69 | 0.69 |
| Panel 2: IV with HHI; with hospital referral region time trends | ||||||||||
| Merged share | 0.056 (0.015)*** | 0.040 (0.013)*** | −0.052 (0.033) | −0.067 (0.034)* | −0.106 (0.185) | −0.207 (0.190) | 0.005 (0.003) | 0.007 (0.003)** | 0.396 (0.238)* | 0.321 (0.218) |
| HHI | −0.061 (0.079) | 0.053 (0.068) | 0.438 (0.171)** | 0.563 (0.186)*** | 2.703 (0.786)*** | 3.298 (0.843)*** | 0.000 (0.016) | −0.020 (0.016) | 0.096 (1.039) | −0.118 (0.983) |
| R2 | 0.61 | 0.70 | 0.47 | 0.49 | 0.49 | 0.52 | 0.11 | 0.16 | 0.69 | 0.70 |
| Observations | 47,396 | 47,396 | 47,396 | 47,396 | 47,396 | 47,396 | 47,396 | 47,396 | 47,396 | 47,396 |
| Panel 3: Hospital-level without hospital-specific time trends | ||||||||||
| Merged share | 0.058 (0.024)** | 0.059 (0.020)*** | 0.032 (0.015)** | 0.029 (0.015)* | 0.378 (0.191)** | 0.371 (0.189)* | −0.001 (0.003) | −0.001 (0.003) | 0.250 (0.185) | 0.265 (0.171) |
| R2 | 0.22 | 0.33 | 0.04 | 0.08 | 0.16 | 0.23 | 0.01 | 0.06 | 0.09 | 0.12 |
| Panel 4: Hospital-level with hospital-specific time trends | ||||||||||
| Merged share | 0.016 (0.021) | 0.021 (0.019) | 0.004 (0.014) | 0.006 (0.014) | 0.087 (0.157) | 0.122 (0.153) | 0.000 (0.003) | 0.000 (0.003) | 0.094 (0.148) | 0.186 (0.138) |
| R2 | 0.23 | 0.34 | 0.05 | 0.09 | 0.18 | 0.25 | 0.01 | 0.06 | 0.14 | 0.16 |
| Observations | 203,139 | 203,139 | 146,765 | 146,765 | 203,139 | 203,139 | 203,139 | 203,139 | 200,296 | 200,296 |
| Control variables | X | X | X | X | X | |||||
Notes. Robust standard errors in parentheses.
Significant at 10%;
Significant at 5%;
Significant at 1%.
All regressions include quarter and zip code or hospital fixed effects as applicable. Because satellite facilities cannot be tracked separately from the parent postmerger, facility pairs that merge in future are treated as a single facility for fixed effect purposes. Standard errors are clustered by zip code or hospital as applicable. Control variables include the percentage of discharges with demographic characteristics such as race, gender, and age categories; with expected payer such as Medicare and private insurance; with comorbidities such as hypertension, diabetes, and heart failure; admission through the ER; and a constant.
The mortality results in these specifications are especially striking. The coefficient on merged share is a solidly statistically significant 0.007, while the coefficient on HHI is a statistically insignificant −0.02. Noncompetitive mechanisms appear to drive mortality increases, while consolidation may reduce mortality. The merged share coefficient suggests a 3.9 percent increase in mortality. These specifications suggest that average length of stay is unaffected.
Hospital-Based Analysis
Thus far, the source of the differences between the inpatient mortality results reported above and those reported in the previous literature is unclear. I have asserted that the geographical approach enables me to avoid bias from patient composition changes and to capture how nonmerging hospitals respond to a merger. However, the larger dataset in this study could allow for more precision outside of any methodological differences. To explore this issue, I follow the approach used by Ho and Hamilton (2000). The outcome variables are regressed on the same set of control variables, and a binary variable identifies discharges from a merged facility. Hospital fixed effects and trends replace zip code fixed effects and HRR trends.1 While these are individual-level specifications, I label this approach “hospital-based” because results are driven by differences between merging and nonmerging hospitals.
In this analysis, continuous variables such as length of stay are discharge-specific, and binary variables such as inpatient mortality are indicator variables. Following the Ho and Hamilton analysis, I also control for hospital volume. Computing limitations restrict me to a 5 percent sample of IHD discharges.
The last two panels of Table 4 report these results. Without hospital trends, merged facilities appear to increase treatment intensity and promptness relative to nonmerging hospitals. However, the inclusion of trends substantially reduces the magnitude and statistical significance of these effects. In both cases, the mortality coefficients are small and statistically insignificant. Thus, the longer time span and additional mergers do not yield similar results between the hospital-based and geographic approaches, particularly for the mortality results.
Discussion
The results detailed above suggest that hospital mergers are associated with greater treatment intensity, both in the type of treatment utilized and in the number of procedures received during a hospital stay. The competition mechanism appears to drive the increase in procedures, while general merger exposure appears to drive the increased utilization of intensive surgeries. Mergers are also associated with increased inpatient mortality, particularly when the competition channel is isolated. As the empirical methodology does not isolate all the channels through which mergers might affect outcomes, I can only hypothesize about the full set of the mechanisms in play. Merger-induced price increases may lead to infrastructure expansion and, consequently, increased treatment intensity. However, mergers also allow for cost cutting in the form of infrastructure consolidation, requiring some patients to travel farther for care. Additional travel time, even in urban and hospital-dense areas, has been found to increase mortality from heart attacks (Buchmueller, Jacobson, and Wold 2006). These results differ from those found in the previous literature in that I find statistically significant increases in inpatient mortality. The results in the last section suggest that the larger dataset is not driving the difference in results. I believe the difference is, instead, driven by some combination of not comparing merging facilities to affected nonmerging facilities and estimating models that are less susceptible to bias from changes in patient composition.
It is difficult to discern from the results listed above whether the increases in treatment intensity enhance or reduce welfare. Increased provision of heart surgeries may improve the length or quality of life for some individuals, and the volume-outcome literature suggests that performing additional surgeries yields improved outcomes. However, any improvements must be weighed against the additional cost of providing the surgeries. Additionally, some previous research has found a negative relationship between more intensive treatment and quality for heart attack patients (Fisher et al. 2003). Furthermore, it is possible that increases in treatment intensity are related to increases in mortality. Access to readmission rates and 30-day mortality rates may shed further light on this question, though it would remain difficult to weigh improvements in quality against the costs of more intensive treatments. This question requires further investigation.
Acknowledgments
Joint Acknowledgment/Disclosure Statement: I am especially grateful to Mark Duggan for his excellent guidance. I would like to thank Darrell Gaskin, Judy Hellerstein, Ginger Jin, Melissa Kearney, Soohyung Lee, Greg Acs, Jonathan Schwabish, seminar participants at the University of Maryland, and two anonymous referees for many helpful comments and suggestions. I would also like to thank the California Office of Statewide Health Planning and Development for giving me access to the data. The views expressed in this paper are those of the author and should not be interpreted as those of the Congressional Budget Office.
Disclosures: None.
Disclaimer: None.
Notes
I further restrict the sample to IHD discharges with a cardiac major diagnosis code; I assume that a noncardiac admission with IHD includes those for whom heart disease is merely a complicating factor and those who develop an AMI in response to complications from another disease or procedure. Both groups are likely to be distinctly different from those included in this sample.
Eight mergers were completed before 1995 without an ownership change after 1990. As my data begin in 1990, I cannot track ownership changes for earlier years.
The earliest possible quarter is used for the four mergers that were completed <1 year into the study period.
All share variables are based on heart disease diagnoses. Using shares of all discharges yields similar results.
Regressions using the share of population discharged (overall and aged 65+) as the dependent variable yield similar results.
The same fixed effects were used for the two hospitals in a merging pair because the data do not distinguish between the two hospitals postmerger.
SUPPORTING INFORMATION
Additional supporting information may be found in the online version of this article:
Table S1: Comparing Merging and Nonmerging Hospitals—An Overview.
Table S2: Regressions on Timing Interacted Premerge Share.
Table S3: First-Stage Relationship between HHI, Merged Share and Predicted Change in HHI, Premerge Share.
Please note: Wiley-Blackwell is not responsible for the content or functionality of any supporting materials supplied by the authors. Any queries (other than missing material) should be directed to the corresponding author for the article.
References
- Bazzoli G, LoSasso A, Arnould R, Shalowitz M. Hospital Reorganization and Restructuring Achieved through Merger. Health Care Management Review. 2002;27(1):7–20. doi: 10.1097/00004010-200201000-00002. [DOI] [PubMed] [Google Scholar]
- Buchmueller T, Jacobson M, Wold C. How Far to the Hospital? The Effect of Hospital Closures on Access to Care. Journal of Health Economics. 2006;25(4):740–61. doi: 10.1016/j.jhealeco.2005.10.006. [DOI] [PubMed] [Google Scholar]
- Capps C. 2005. The Quality Effects of Hospital Mergers Department of Justice, Economic Analysis Group Discussion Paper 05-6.
- Capps C, Dranove D, Satterthwaite M. Competition and Market Power in Option Demand Markets. RAND Journal of Economics. 2003;34(4):737–63. [PubMed] [Google Scholar]
- Connor R, Feldman R, Dowd B, Radcliff T. Which Types of Hospital Mergers Save Consumers Money? Health Affairs. 1997;16(6):62–74. doi: 10.1377/hlthaff.16.6.62. [DOI] [PubMed] [Google Scholar]
- Coulam R, Gaumer G. Medicare's Prospective Payment System: A Critical Appraisal. Health Care Financing Review, Annual Supplement. 1991:45–77. [PubMed] [Google Scholar]
- Cutler D, McClellan M, Newhouse J. How Does Managed Care Do It? RAND Journal of Economics. 2000;31(3):526–48. [PubMed] [Google Scholar]
- Dafny L. How Do Hospitals Respond to Price Changes? American Economic Review. 2005;95(5):1525–47. doi: 10.1257/000282805775014236. [DOI] [PubMed] [Google Scholar]
- Dafny L. Estimation and Identification of Merger Effects: An Application to Hospital Mergers. Journal of Law & Economics. 2009;52:523–50. [Google Scholar]
- Devers K, Casalino L, Rudell L, Stoddard J, Brewster L, Lake T. Hospitals’ Negotiating Leverage with Health Plans: How and Why Has It Changed? Health Services Research. 2003;38(1):419–46. doi: 10.1111/1475-6773.00123. [DOI] [PMC free article] [PubMed] [Google Scholar]
- Dor A, Grossman M, Koroukian SM. Transaction Prices and Managed Care Discounting For Selected Medical Technologies: A Bargaining Approach. Cambridge, MA: National Bureau of Economic Research; 2004. NBER Working Paper 10377. [DOI] [PubMed] [Google Scholar]
- Doyle J, Ewer S, Wagner T. Returns to Physical Human Capital: Analyzing Patients Randomized to Physician Teams. Cambridge, MA: National Bureau of Economic Research; 2008. NBER Working Paper 14174. [Google Scholar]
- Dranove D, Lindrooth R. Hospital Consolidation and Costs: Another Look at the Evidence. Journal of Health Economics. 2003;22(6):983–97. doi: 10.1016/j.jhealeco.2003.05.001. [DOI] [PubMed] [Google Scholar]
- Fisher E, Wennberg D, Stukel T, Gottlieb D, Lucas F, Pinder E. The Implications of Regional Variations in Medicare Spending. Part 1: The Content, Quality, and Accessibility of Care. Annals of Internal Medicine. 2003;138(4):273–87. doi: 10.7326/0003-4819-138-4-200302180-00006. [DOI] [PubMed] [Google Scholar]
- Gaynor M. What Do We Know about Competition and Quality in Health Care Markets? Foundations and Trends in Microeconomics. 2006;2(6):441–508. [Google Scholar]
- Gaynor M, Seider H, Vogt W. Volume-Outcome and Antitrust in U.S. Health Care Markets Unpublished manuscript. Pittsburgh, PA: Carnegie-Mellon University; 2004. [Google Scholar]
- Gaynor M, Seider H, Vogt W. The Volume-Outcome Effect, Scale Economies, and Learning-by-Doing. American Economic Review Papers and Proceedings. 2005;95(2):243–7. [Google Scholar]
- Gowrisankaran G, Ho V, Town RJ. Causality, Learning and Forgetting in Surgery. Minneapolis: University of Minnesota; 2006. Working Paper. [Google Scholar]
- Gowrisankaran G, Town RJ. Competition, Payers, and Hospital Quality. Health Services Research. 2003;38(6):1403–22. doi: 10.1111/j.1475-6773.2003.00185.x. [DOI] [PMC free article] [PubMed] [Google Scholar]
- Ho V. Learning and the Evolution of Medical Technologies: The Diffusion of Coronary Angioplasty. Journal of Health Economics. 2002;21(5):873–85. doi: 10.1016/s0167-6296(02)00057-7. [DOI] [PubMed] [Google Scholar]
- Ho V, Hamilton B. Hospital Mergers and Acquisitions: Does Market Consolidation Harm Patients? Journal of Health Economics. 2000;19(5):767–91. doi: 10.1016/s0167-6296(00)00052-7. [DOI] [PubMed] [Google Scholar]
- Kessler D, Geppert J. The Effects of Competition on Variation in the Quality and Cost of Medical Care. Journal of Economics & Management Strategy. 2005;14(3):575–89. [Google Scholar]
- Kessler D, McClellan M. Is Hospital Competition Socially Wasteful? Quarterly Journal of Economics. 2000;115(2):577–615. [Google Scholar]
- Sari N. Do Competition and Managed Care Improve Quality? Health Economics. 2002;11(7):571–84. doi: 10.1002/hec.726. [DOI] [PubMed] [Google Scholar]
- Shen Y, Melnick G. Is Managed Care Still an Effective Cost Containment Device? Forum for Health Economics & Policy (Frontiers in Health Policy Research) 2006;9(1):1–22. Article 3. [Google Scholar]
- Town RJRWholey,RFeldman, Burns L. The Welfare Consequences of Hospital Mergers. NBER Working Paper 12244. Cambridge, MA: National Bureau of Economic Research; 2006. [Google Scholar]
- Vogt W, Town R. Princeton, NJ: Robert Wood Johnson Foundation; 2006. “How Has Hospital Consolidation Affected the Price and Quality of Hospital Care?”. Robert Wood Johnson Foundation, Research Synthesis Report No. 9. [PubMed] [Google Scholar]
Associated Data
This section collects any data citations, data availability statements, or supplementary materials included in this article.