Abstract
We investigated the structure, properties and dynamics of the actin filament branch junction formed by Arp2/3 complex using all-atom molecular dynamics simulations based on a model fit to a reconstruction from electron tomograms. Simulations of the entire structure consisting of 31 protein subunits together with solvent molecules contained ~3 million atoms were performed for an aggregate time of 175 ns. One 75 ns simulation of the original reconstruction was compared to two 50 ns simulations of alternate structures, showing that the hypothesized branch junction structure is very stable. Our simulations revealed that the interface between Arp2/3 complex and the mother actin filament features a large number of salt bridges and hydrophobic contacts, many of which are dynamic and formed/broken on the timescale of the simulation. The simulations suggest that the DNase binding loops in Arp3, and possibly Arp2, form stabilizing contacts with the mother filament. Unbiased comparison of models sampled from the MD simulation trajectory with the primary experimental electron tomography data identified regions were snapshots from the simulation provide atomic details of the model structures and also pinpoints regions where the initial modeling based on the electron tomogram reconstruction may be sub-optimal.
Keywords: actin, cytoskeleton, Arp2/3 complex, molecular dynamics
Introduction
The dynamics of self-assembled networks of actin filaments are crucial to a wide range of biological processes, generally encompassing a variety of motility, trafficking and structural activities. A common structural feature of actin networks is the actin related protein (Arp) 2/3 complex, which forms a geometrically regular junction between two actin filaments.1 The Arp2/3 complex is a complex of seven proteins with five unique subunits (ARPC1-5) supporting a dimer of two Arps (actin related proteins Arp2 and Arp3). Free Arp2/3 complex is inactive and does not nucleate a new filament. However, cooperative interactions with ATP, nucleation promoting factors and the side of an actin filament activate Arp2/3 complex through rotation and translation of Arp2 into a position where Arp2 and Arp3 can initiate a new actin filament.2-4
The structure of inactive Arp2/3 complex is well established by x-ray crystallography.3,5-8 Subdomains (SD) 1 and 2 of Arp2 (using standard definitions of SD1—SD4 of actin) are disordered except in crystals crosslinked with glutaraldehyde, but the structures of the other subunits have been determined at 2.0 Å resolution. Electron microscopy (EM) and two-dimensional reconstruction of the branch junction established the general architecture and orientation of Arp2/3 complex within the branch junction.9,10 Electron tomography produced a three-dimensional reconstruction of the branch junction at 26 Å resolution and constrained fitting of crystal structures of Arp2/3 complex subunits and actin subunits of both the mother filament and daughter filaments into the density.11 Further structural details of the interface between the mother actin filament and subunits ARPC2 and ARPC4 were identified in a study that combined mutagenesis with computational docking and molecular dynamics (MD) to allow for structural relaxation.12
In the model of the branch junction based on electron tomography ~ 9,000 Å2 of surface area is buried in broad region of protein-protein interfacial interactions between Arp2/3 complex and the actin mother filament.11 To fit the mother actin filament into the experimental density it was necessary to remodel two of the actin subunits that bind Arp2/3 complex, by extending their subdomains 2 radially away from the center of the mother filament. These structural changes strengthened the contact between Arp2/3 complex and the mother filament.
This EM model of the branch junction has allowed us to ask a number of new questions about the molecular level detail of the binding surface between both Arp2/3 complex and the mother filament, as well as Arp2/3 complex and the daughter filament. We used molecular dynamics (MD) simulation with high-performance supercomputing resources to test the overall stability and validity of the structure proposed by Rouiller et al.11, as well as to add atomistic insights where appropriate. This new work is an extension of previous MD simulations that contributed to molecularly detailed explanations for the dynamics and function of actin and Arp2/3 complex. MD has helped clarify the role of ATP hydrolysis in regulating the structure monomeric actin as well as in the Arp3 and Arp2 subunits.13-19 Additionally, MD simulations of the actin filament have provided insight into the mechanism of ATP hydrolysis by polymerized actin and its influence on actin filament dynamics and structure.13,17,20,21
To provide atomistic insight into the structure and dynamics of the Arp2/3 complex branch junction, we performed large-scale MD simulations of the system in a fully solvated environment. Each system contained an actin mother filament with 13 ADP-actin subunits (to employ periodicity along the filament axis), Arp2/3 complex and a daughter filament with 11 additional ADP-actin subunits – 31 protein subunits in total. We investigated two different branch junction models, and each system had ~3 million atoms (including proteins, nucleotides, ions and water). Simulations of the full system totaling 175 ns were performed, making this the most ambitious MD simulation of an actin-based system to date. Three unique systems were simulated in order to systematically test 1) the reproducibility of two simulations initiated with identical active Arp2/3 complexes and binding interfaces and 2) test the effects on the branch junction stability if the Arp2/3 complex active structure is constructed by a different method24. We investigated the structural and dynamical properties of the branch junction under these different conditions and characterized the relaxation of the system as well as the properties of the structure from the equilibrated MD simulation. The simulation results agree structurally with the experimentally derived 26-Å resolution density map of the branch junction from electron tomography11, allowing a detailed analysis of the local differences between the original electron tomography-based experimental structure and the details that emerged from the MD simulation.
Results
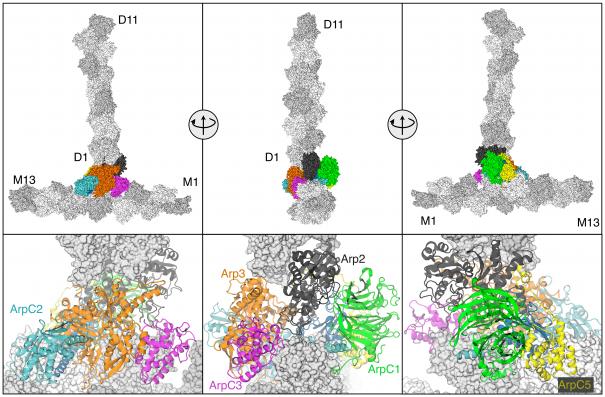
This section summarizes our findings from the simulations. All properties reported were calculated based on the last 25 ns of each simulation unless otherwise noted. The Methods section provides detailed descriptions for the preparation of both model systems simulated as well as the equilibration criteria. Most of the results presented here are based on two simulations of a 3D model of the branch junction based on crystal structures of the protein subunits and reconstructions of electron tomograms11 Our MD simulations started with lower resolution structures than most MD simulations of proteins, which typically come from high-resolution X-ray crystallography. The first (75 ns) simulation (Branch08 hereafter) was constructed directly from the structure obtained by the fitting procedure described in ref 11. The second (50 ns) simulation (called Branch10 hereafter) used the same Arp2/3 branch junction complex with modified mother filament subunits M6 and M8 binding Arp2/3 complex but with the other subunits in the mother filament and daughter filament based on the 2010 filament model of Namba et al.22 Figure 1 shows the starting structure of the Branch08 model with Arp2/3 complex subunits in standard colors.1 The actin mother filament subunits are named M1-13 with M1 at the pointed end. Likewise, D1-D11 refer to the daughter filament subunits with D1 and D2 at the pointed end as the first two subunits that interface with Arp2/3 complex.
Fig. 1.
Starting structure for the simulation of the Arp2/3 complex branch junction. The top portion shows three views with protein subunits in surface representation and with mother (M1 to M13) and daughter filaments (D1 to D11) colored grey. Arp2/3 complex subunits are colored and labeled using a common coloring scheme expect for Arp2 in black. The pointed ends of the actin filaments are at subunits M1 and D1. The bottom portion are close up views of the active Arp2/3 complex with labels. Each view is rotated 90°. Note that ARPC4 (dark blue) is only scarcely visible as it is mostly buried at the Arp2/3—actin interface. Subunit M8 is removed in the bottom center panel to enhance viewing of the Arp2/3 complex.
In general, the MD simulation trajectories, although short compared to experimental timescales, did not reveal significant differences between the Branch08 and Branch10 models. The different simulation times reflect the fact that the Branch08 model required an additional 25 ns for equilibration of the properties of interest.
Structure and dynamics of the branch junction
We first characterized the overall stability of the EM-based starting structure and compared it to previous studies of actin filaments and Arp2/3 complex. We used the root mean-squared deviation (RMSD) from the initial starting structure as a metric to assess the overall stability of the structure and to assess the convergence of our simulations. The RMSD of just the Arp2/3 complex part of the branch junction was ~4.3±0.2 Å (for Branch08 and Branch10) when measured over the last 25 ns of the simulation. With both starting models, reaching this plateau RMSD value took most of the first 25 ns, suggesting 25 ns is the minimum required to achieve reasonable structural equilibration. The equilibrium RMSD was similar to the measured RMSD of 3.7 Å of inactive Arp2/3 complex in solution in previous simulations.16 As expected, these RMSD values were higher for larger structural components of the junction. For the mother filament and Arp2/3 complex the value was 5.8±0.4 Å (both models), and for the entire branch junction the RMSD was 8.0±0.7 Å (Branch08) and 6.5±0.5 (Branch10). Fig. S1 shows the RMSD vs time for the full branch junction. These values are within the range of 5.6—8.3 Å measured for a 13-subunit actin filament.21 The comparably low RMSD of the full branch junction, which is over twice as large as previously simulated actin filaments, supports the quality of the initial experimental structure.
During the simulations of both Branch 08 and Branch10 the angle between the mother filament and daughter filament varied over a range of ~4.3°, similar to the range of ±2° observed by microscopy.11 The consensus value of this angle measured by microscopy was ~80°.9,11,23 We computed this angle during simulation of the branch junction from the dot product of the vectors along the axes of the mother and daughter filaments (Figure S2A). The initial value with our procedure was 84°, which is slightly larger than the values derived from experimental imaging techniques. However, our value is based only on 11 daughter-filament subunits, and it is possible that this initial segment could have a different angle than the larger segment of the branch junction that is used for experimental characterization. For such a large system there are certainly relevant slow modes with characteristic time scales far longer than we were able to simulate; however, agreement between the simulation and experiment is encouraging given the timescale currently accessible with MD.
The branch junction remained relatively planar throughout the course of the simulation for both systems (Figure S2B). We measured the planarity as azimuthal orientation of the daughter filament relative to the long axis of the mother filament as depicted graphically in the inset of Fig. S2B. For each snapshot of the simulation, we aligned the mother filament atoms of the branch junction to the initial structure and calculated the angle between the daughter filament and the initial daughter filament (projected on to the x-y plane) to detect any deviation from the initial vertical orientation of the daughter filaments relative to the mother filament.
As a control, we compared the stability of the starting structure based on EM tomography with an model of the branch junction based on MD simulations of the activation of Arp2/3 complex24 in which a spring-like force was used to move Arp2 and associated subunits into the position next to Arp3 observed in the model of the branch junction based on EM tomography in the Branch08 configuration. We chose the result of an 8 ns simulation with a spring constant of 10.0 kcal/mol/Å2, where a clash of subdomain 2 of Arp2 of Arp3 precluded its full movement into the target position. The alternate active Arp2/3 complex was substituted for Arp2/3 complex in the EM model by alignment of the backbones of the two structures and subsequent removal of a steric clash in the Arp3 D-loop region. The alternate system was simulated for 50 ns. The RMSD of this model was higher than the main simulation based on the EM structure with a value of 10.1 Å over the last 10 ns (compared to 7.8 Å in Branch08 and or 6.5 Å in Branch10).
Mother filament structure
The simulated behavior of the mother filament starting with either of the branch junction model was similar to simulations of isolated actin filaments.21 The equilibrium filament geometries were very similar, including the equilibrium value of the periodic cell dimension along the mother filament axis: 363±1.5 Å (Branch08) and 360±0.7 Å (Branch10) in the branch junction compare well with 357— 366 Å for ADP-bound filaments.21 The overall stabilities were similar as well with an RMSD of 5.6±0.3 Å (Branch08) and 4.6±0.3 Å (Branch10) for the branch junction mother filament compared to 5.6-8.2 for filaments of ADP-actin subunits.21
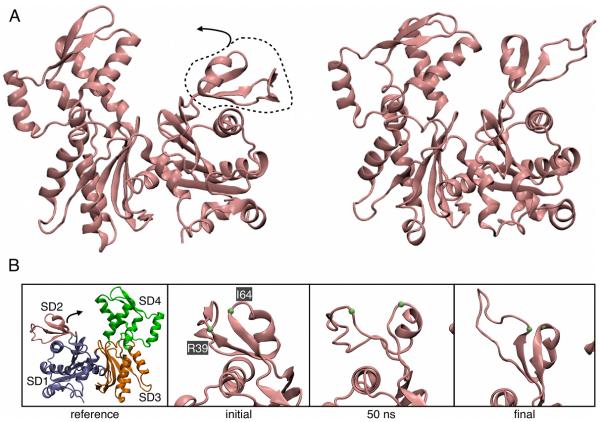
To fit crystal structures into the EM-reconstruction of the branch junction, two of the actin subunits in the mother filament (subunits M6 and M8) were modified from the ADP-actin structure in the rest of the filaments.11 The structural modifications to both subunits were in subdomain 2 (residues 33—69), which contains the DNase-I binding (D-loop). The largest modification was a radial movement of SD2 of subunit M6 away from the axis of the filament (Fig. S3-A). In the starting structure of both Branch08 and Branch10 O(I64) of subunit M6 was separated by 4.1 Å from N(R39), 1.2 Å more than in the monomeric actin crystal structure (Fig. 2B). Movement of the D-loop toward Arp2/3 complex during construction of the EM model separated these residues, exposing hydrogen bonds to water and leading to fraying of these strands and loss of secondary structure (Fig. 2B, center).
Fig. 2.
Changes in mother actin filament subunit M6 during the MD simulation. (A) Ribbon diagrams of initial and final views of the front side of subunit M6 with SD2 circled and the direction of SD2’s relaxation identified with an arrow. (B) Close-up views of the back side of subunit M6’s SD2 region with the Cα atoms of R39 and I64 labeled. Left, reference actin subunit structure identifying SD1—4. Mid-left, initial structure from the EM model. Mid-right, 50 ns of simulation. Right, 75 ns of simulation.
During the simulations of both the Branch08 and Branch10 models subunit M6 relaxed with the core of SD2 moving back into a position that resembles crystal structures of actin (Fig. S3-B), while the D-loop retained a number of contacts with Arp2/3 complex (A). Over the first few nanoseconds of simulation this relaxation moved SD4 and SD2 of actin subunit M6 closer together, but not as close as SD4 and SD2 of subunits M8 or M3, a representative mother filament subunit away from the binding site (Figure. S3-C). Mechanistically, this movement of SD2 occurred in two steps in subunit M6 (Fig. 2B). In the first step the anti-parallel β-sheet that allowed the D-loop to bind Arp2/3 complex weakened. During the second step the D-loop and the frayed strands followed the movement of the “top half” of SD2 toward SD4, ultimately leading to recovery of the β-sheet (Fig. 2B, mid-right.) These changes occurred at one of the positions farthest from the surface of the branch junction where structural information is most difficult to obtain by electron microscopy. Furthermore, the total RMSD of the change observed in the simulations was less than the reported resolution of the EM structure. In both Branch08 and Branch10 simulations, only SD2 of subunit M6 exhibited this behavior out of the 24 actin subunits. Subunit M8 behaved somewhat differently in the Branch08 and Branch10 simulations (Figure S3-C). In the Branch10 simulation the distance between SD2 and SD4 increased slightly due to extension of the M8 D-loop into the Arp2/3 binding interface, but this change was not observed in the more stable M8 subunit of Branch08.
Atomistic properties of the Arp2/3 complex binding interface
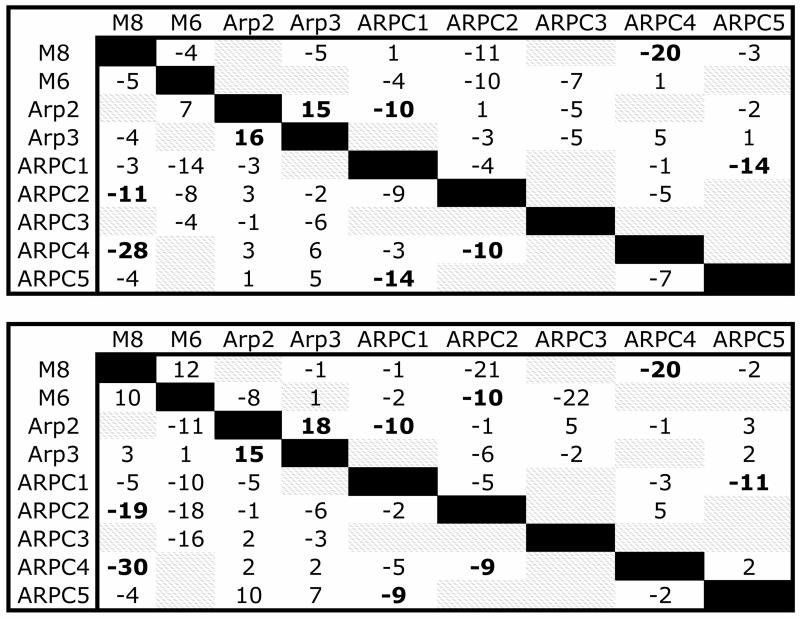
Our MD simulations provide direct access to an atomistically detailed view of the binding interface and its dynamics. During the simulation the Arp2/3 complex and neighboring actin subunits had a relatively low RMSD, while the binding interface was dynamic. We first characterized the overall changes coarsely, using the aggregate change in the number of contacts between subunits as a measure of the subunit-subunit interactions in Arp2/3 complex and the binding interface. A single contact was defined as two alpha carbons from different subunits located within 10.0 Å of each other. The average number of subunit-subunit contacts during the last 25 ns of the simulation was then compared to the initial number of contacts to create a “difference contact map” for the Arp2/3 complex and its binding interface (Fig. 3). The difference contact map shows the changes in the number of contacts compared with the initial structure: negative values indicate regions of loss, and positive values show areas of increased contact. Although lower in resolution than standard contact maps, this contact map documents the overall structural relaxation of the branch point during our simulations. During both the Branch08 and Branch10 simulations contacts are lost between the ARPC2/ARPC4 dimer and the mother filament and are gained between Arp2 and Arp3. Within the approximation of a discrete definition of a contact we do observe a net loss of contacts between the Arp2/3 complex and the mother filament during structural relaxation. Specifics regarding the protein/protein interactions are further described below.
Fig. 3.
Subunit-level “difference contact map” for the mother filament and Arp2/3 complex for both filament simulations (Branch08 is on top, Branch 11 on bottom). The matrix elements show the net change in contacts between subunits represented in the rows and column. The map considers both the contacts on subunit i due to subunit j as well as the contacts on subunit j due to contact with i. In the lower diagonal portion of the map the row is the subunit where contacts are counted and the column is the contacting subunit. In the upper diagonal portion of the map the column is the subunit where contacts are counted and the row is the contacting subunit. For example, M6 loses 5 of its initial contacts with M8, but M8 loses only 4 of its initial contacts with M6. Difference values in bold indicate similar changes for both the Branch08 and Branch10 simulations.
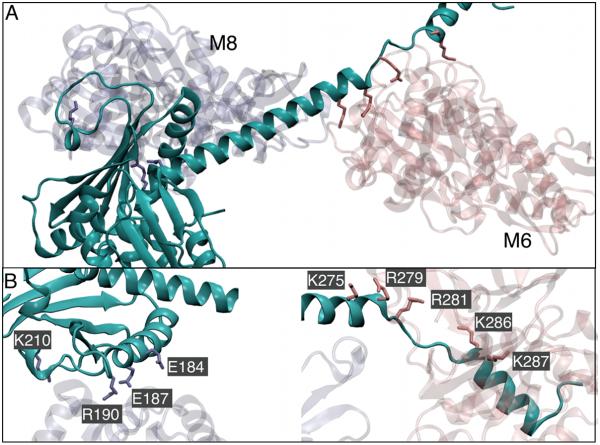
We tracked salt bridges in the interface between Arp2/3 complex and the mother filament using the Salt Bridges plugin of VMD25 with the default criterion of 3.2 Å between the oxygen atoms of an acidic and nitrogen atom of basic residues (Table 1). The total number of salt bridges that were observed during the simulations of both Branch08 and Branch10 (stable and unstable) was greater than 40, which reflects the large number of changes during the approach to equilibrium. Four salt bridges were present and stable in both systems at the end of each simulation (Table 1). Salt bridges between ARPC2 and the mother filament subunits M6 and M6 are assumed to be important to stabilize the binding interface. The binding interface shown in Figure 4 may help explain the underlying reasons for this. One of the globular domains of ARPC2 contains four residues implicated in salt bridges with M6 (Fig. 4B, Table 1) whereas the ARPC2 C-terminal helix extends across the mother filament mass and forms salt bridges with subunit M6 on the opposite side of the mother filament long pitch helix (Fig. 4A, C). Binding in this fashion, ARPC2 forms a clamp, which stabilizes the branch junction interface. Four of the 13 residues that may form salt-bridges between the ARPC2/ARPC4 dimer and the mother filament [ARPC2-(E184, E187, R190) & ARPC4 -(K150)] have been mutated to alanine and found to cause severe biochemical defects.12 The other nine residues forming salt-bridges at the mother filament – Arp2/3 interface are also likely to be strong determinants of interfacial structure and dynamics and are therefore excellent targets for mutagenesis.
Table 1.
Salt bridges between Arp2/3 complex subunits and actin mother filament. The amino acid group for each side chain is identified as well as whether or not the salt bridge is present at the end of each of simulation for each branch model. Salt bridges that exist at the end of both simulations are marked with bold italics.
| Subunit pairs | Branch08 | Branch10 | |
|---|---|---|---|
| M8 | ArpC2 | ||
| K118 | E187 | Y | Y |
| E364 | K210 | Y | N |
| E117 | R190 | Y | N |
| K118 | E184 | N | Y |
| M6 | ArpC2 | ||
| E364 | K275 | Y | Y |
| E361 | K275 | Y | N |
| D3 | R281 | Y | N |
| D25 | K287 | Y | N |
| E361 | R279 | Y | N |
| E4 | K286 | Y | N |
| D1 | K286 | N | Y |
| M8 | ArpC4 | ||
| D80 | R158 | Y | N |
| E83 | K150 | Y | N |
| K84 | E184 | N | Y |
| K50 | E145 | N | Y |
| M6 | ArpC1 | ||
| E167 | K308 | Y | Y |
| M6 | Arp2 | ||
| E99 | R65 | Y | N |
| M6 | Arp3 | ||
| E224 | R50 | Y | N |
| E224 | K42 | Y | N |
| D222 | K42 | Y | N |
| Arp3 | ArpC3 | ||
| D246 | K50 | Y | N |
| D270 | K158 | Y | N |
| E212 | K158 | Y | Y |
| D210 | K165 | Y | N |
Fig. 4.
Ribbon diagrams showing the possible salt-bridge forming residues in ARPC2 (cyan) and mother filament subunits M8 (transparent, left) and M6 (transparent, right) that were identified during MD simulations. Panel A shows the ARPC2 clamp spanning M6/M8 dimer. Panel B shows a close up of the possible salt-bridge forming residues with subunits M8 (left) and M6 (right). Side chains of residues forming salt bridges are labeled and drawn with licorice representation.
We determined the extent and nature of hydrophobic contacts in the binding interface, defined as the centers-of-mass of hydrophobic side chains within 6.0 Å (Table 2). The 9 consensus hydrophobic contacts stably formed during simulations of both Branch08 and Branch10 included significant regions between the D-loop of mother filament subunits M6 (with ARPC3), M8 (with ARPC3) and Arp2 (with subunit M6). Interactions of subunit ARPC1 with M6 also involved a large number of hydrophobic contacts.
Table 2.
Consensus hydrophobic contacts at the Arp2/3 complex mother filament interface that are present in both Branch08 and Branch10 at the end of the simulation. To be considered in contact the center of mass of the side chains must be within 6.0 Å
| M8 | ArpC2 |
|---|---|
| VAL45 | ALA268 |
| M8 | ArpC1 |
| MET47 | ALA310 |
| VAL43 | ALA310 |
| M6 | ArpC3 |
| MET44 | PRO109 |
| VAL45 | PRO109 |
| M6 | ArpC1 |
| MET355 | ALA309 |
| MET355 | ALA310 |
| PHE375 | ALA309 |
| M6 | Arp2 |
| VAL45 | VAL47 |
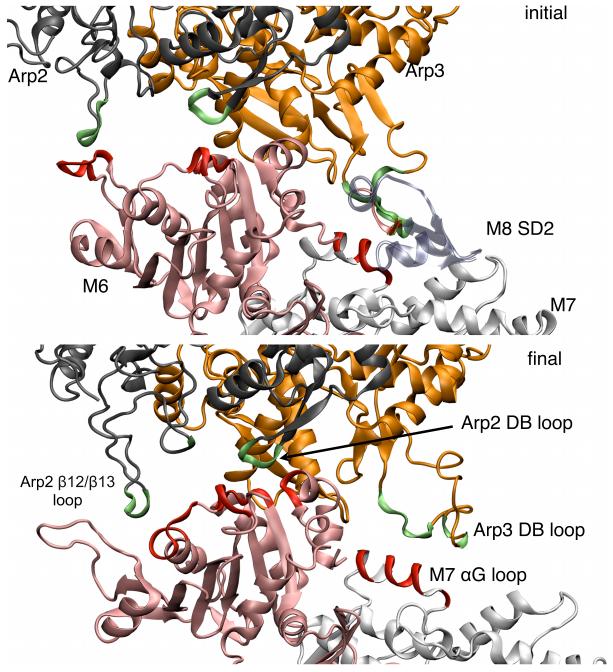
In the starting branch junction structure, the D-loops at the pointed ends of Arp2 and Arp3 interact with the actin mother filament (Figs. 5). The initial diffuse contacts between Arp3 and mother filament subunits M7 and M8 matured during both the Branch08 and Branch10 simulations to a stable contacts between the αG helix of Arp3 and subdomain 4 of the M7 actin subunit. In the Branch08 simulation the Arp2 D-loop orβ12/β13 loop formed all of the contact points with the M6 subunit of the mother filament, but the Arp2 D-loop lost its initial contacts with the mother filament subunit M6 in simulation Branch10. This behavior of SD2 of the Arp2 subunit is difficult to interpret, because it has not resolved in any crystal structures and modeled by inference from actin structures. This behavior of the D-loop and β12/β13 of Arp3 and Arp2 was interesting given that these structural features were very dynamic in simulations of Arp3.15
Fig. 5.
Ribbon diagrams comparing contacts between Arp2 and Arp3 with subunits in the mother filament in the branch junction. Top, initial EM model. Bottom, final structure at the end of the MD simulation. Arp2 is black, Arp3 is orange, mother filament subunit M6 is pink and other mother filament subunits are grey, except for important structural features that are labeled and colored red or lime. Arp2 and Arp3 residues in contact with mother filament residues are shown in lime and mother filament residues in contact with Arp2 or Arp3 are shown in red. Subunit M8 is not shown in the final snapshot as it does not form any contacts with Arp2 or Arp3. These snapshots are based on the Branch08 simulation as described in the main text.
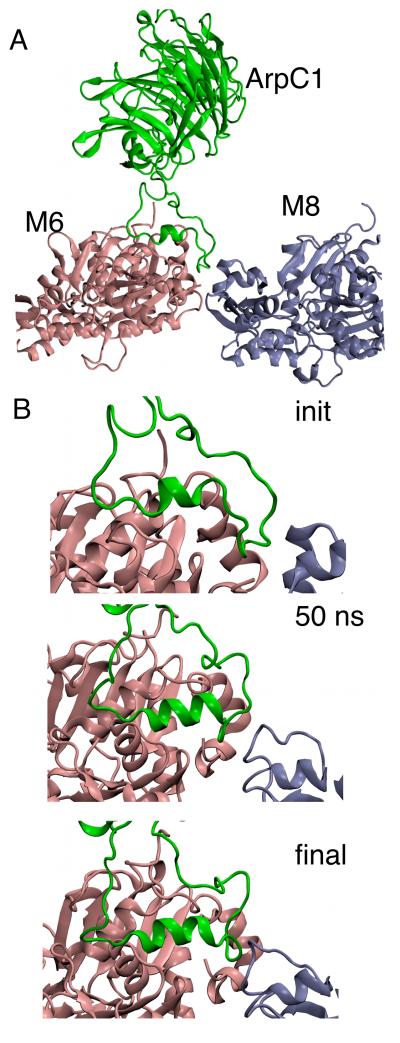
The model of the branch structure based on EM tomography11 proposed that ARPC1 residues 288-322 make an extended series of contacts with mother filament subunits M6 and M8 (Fig. 6), including insertion of an alpha helix in the barbed-end groove of subunit M6. In the crystals of Arp2/3 complex this “insert helix” binds to the hydrophobic groove at the barbed end of Arp3 from an adjacent complex. Since ARPC1 residues 288-322 were not resolved in the experimental EM tomography density, it was interesting that both Branch08 and Branch10 simulation(s) added an alpha helical turn to the insert helix with hydrophobic contacts with the mother filament (Fig. 6B). This outcome provides some evidence that this interaction between ARPC1 and the mother filament is meaningful.
Fig. 6.
Ribbon diagrams showing detailed views of the interface between ARPC1 and the mother filament. The other subunits of Arp2/3 complex and the mother filament are omitted for clarity. (A) Initial configuration of all three subunits from the model based on EM tomography with the loop consisting of ARPC1 residues 288-322 in contact with the mother filament. (B) Close-up views of the ARPC1 loop bound to the mother filament at the initial, 50 ns and final points of the simulation. An additional alpha helical turn in ARPC1 insert helix formed by 50 ns and was very stable after that point. The snapshots shown from Branch08 because it came from a longer simulation time, however the stability of the helix was also observed in Branch10.
The ARPC3 subunit contacts only Arp3 in crystal structures and makes few contacts with the mother filament in EM model of the branch junction. During both the Branch08 and Branch10 simulations, the overall contact surfaces between ARPC3 and both the mother filament and Arp3 were relatively stable (Fig. 3) in spite of the entire ARPC3 subunit rotating radially away from the filament. The radial distance between the center of ARPC3 the mother filament axis increased by 11.5 Å in Branch10 and 5 Å in Branch08. The flexibility of M6 D-loop and Arp3 αG helix compensated for the rotation of ARPC3, so the overall binding interface between ARPC3 and the branch junction was only minimally disrupted. More contacts between M6 and ARPC3 were lost in the Branch10 simulation than the Branch08 simulation (Fig. 3). ARPC3’s role is still not fully understood11, however the subunit is not essential for function.26
Daughter filament and Arp2/3 complex daughter filament interface
The binding interface between the Arp2/3 complex and the subunits D1 and D2 of the daughter filament is a key structural feature of the branch junction (Fig. 1). The current consensus is that Arp2 and Arp3 form the first two subunits in the helical daughter filament. This interface becomes plausible only after Arp2 30 Å moves into the proper position for actin binding. We characterized the structure and dynamics of the binding interface between Arp2/Arp3 and D1/D2, including the relaxation from the initial structure as well as the equilibrium fluctuations during the final portion of the simulations.
Overall the unit consisting of Arp2, Arp3 and actin subunits D1 and D2 at the base of the daughter filament was very stable during the simulations. The RMSD from the initial structure (aligned only using the 4 subunits) reached a stable equilibrium value of 4.3 Å (Branch08) and 4.0 Å (Branch10) after only 25 ns owing to a significant increase in contact density between the four subunits. The interface between Arp2/3 complex and the daughter filament had significantly more contacts than other pairs of subunits in the mother filament and daughter filaments (Fig. S4). The larger binding surface resulted from 1) movement of the Arp3 αK helix to form extended contacts with subunit D1 and 2) an extended network of contacts between the D-loop of subunit D2 and Arp2 in both filament simulations.
Comparison of the MD trajectory with the reconstruction from electron micrographs
To compare the MD simulations with the EM reconstruction, we fit 1000 representative models from the last 25 ns of the Branch10 simulation individually into the EM density map, using the same algorithms used to make the original model from crystal structures.11,27,28 The fitting procedure allows statistical evaluation of the MD models compared with the EM-based starting model.29 During the Branch10 simulation, the scores of the MD models drifted far outside the range of the 99.9% confidence interval of the original fit (Figure 7), indicating that the individual MD models did not fit the reconstruction as well as the EM-based model. This is not necessarily surprising: the reconstruction of the branch junction from electron micrographs is an average structure whereas the individual MD models represent distinct time points that are likely to fit considerably less well into the time-averaged map than a dedicated average model. The facts that 1) the variability of the MD scores is larger than the width of the 99.9% confidence interval and 2) that the confidence interval is within the sampling range of the MD trajectory are both consistent with this interpretation. Additionally, we note that the deviation between the computed EM density maps over the last 25 ns (Figure 7) and RMSD values over the same period (Figure S1) are computed with active Arp2/3 complex and surrounding few actin subu nits (EM density calculation) and entire branch junction (RMSD calculation). Therefore quantitative comparison should be performed with caution.
Fig. 7.
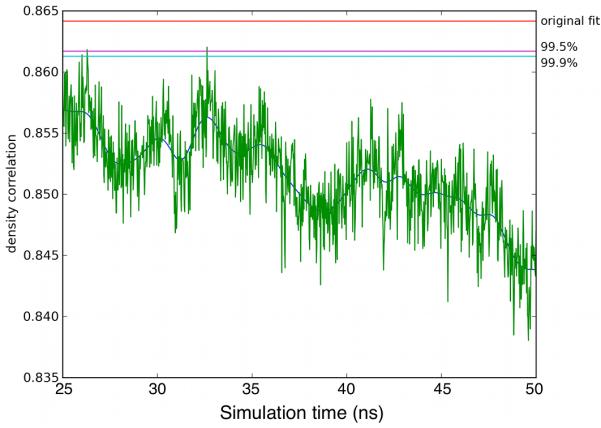
The time series showing the correlation of models extracted from the 25-50ns of the MD trajectory with the density map of the branch junction reconstructed from experimental electron-tomograms (green). The correlation of the original docking-based model is marked in red; the 99.5% and 99.9% confidence limits are marked in cyan and magenta respectively.
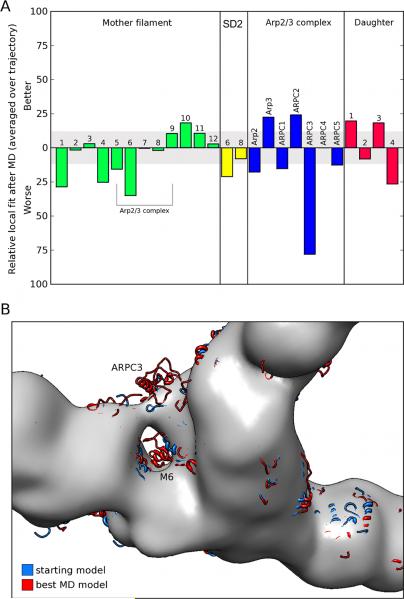
Comparison of the fits of individual branch junction subunits with those of the EM-based model revealed highly localized differences (Figure 8A). In spite of not being constrained by the EM-model the simulations improved the fits of 5 subunits (subdomains 3 and 4 of Arp3, ARPC2, daughter filament subunits D1 and D3 and mother filament subunit M10). The simulations had no significant effect on 9 subunits, but moved parts of 8 subunits out of the EM-density (Figure 8B) with largest deviations in mother filament subunit M6 (in particular SD2) and ARPC3. Consistent with the observations in the density fit, the largest average coordinate differences within the Arp2/3 complex itself between the EM-based structure and the snapshots from the MD trajectory occurred in ARPC3 (Figure 9B). Within the mother filament, SD2 of M6 moved back into its original location, a region devoid of density in the reconstruction, generating a large average coordinate difference in this region (Figure A). In principle, the lack of density for SD2 might be explained by high structural flexibility. However, SD2 of actin subunit M6 was just as stable as the rest of M6 during the end of the simulation, arguing against this possibility.
Fig. 8.
Local changes in fit of the equilibrated molecular dynamics (MD) model and the EM-based model to the density map constructed from EM tomography. (A) Changes in number of alpha carbons inside the density (contour level as in B). (B) Direct visual comparison between the density map constructed from EM tomography (gray surface representation) and the EM-based model (starting model, blue) and the best-fitting MD model (red) in the region occupied by the Arp2/3 complex.
Fig. 9.
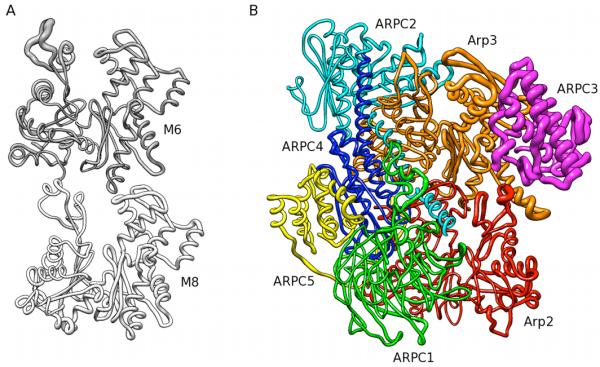
Root-mean-square differences (RMSD) mapped onto cartoon representations of mother filament subunits M6 and M8 and Arp2/3 complex. The thickness of the backbone traces is proportional to RMSD. (A) RMSD between representatives of the snapshots from the MD simulation mapped onto mother filament subunits M6 and M8. (B) RMSD between the original EM-based model and the best-fitting model of the MD trajectory mapped onto the Arp2/3 complex. The RMSD magnitude was scaled by 0.5 with respect to A.
Discussion
Our simulations of the full Arp2/3 complex-actin branch junction, involving ~3 million atoms for an aggregate simulation time of 175 ns, have explored the branch structure and atomistic details of the binding interfaces of Arp2/3 complex with both mother and daughter filament. One significant outcome of this work is improved understanding of how to combine effectively MD simulations of large supramolecular complexes with low-resolution structural data. Our approach, which filters the production phase of the MD trajectory using the experimentally derived density map, provides a new method to give unbiased comparison between simulation and experiment. Importantly, filtering the MD simulations with experimentally measured structural data is an effective way to overcome the timescale challenge for extremely large MD simulations (i.e., greater than a million atoms), wherein performing simulations alone may raise concerns about equilibration. Physics-based simulations such as MD can also serve as a control to test structural modifications introduced during fitting procedures in the determination of complex biological structures.
The 3D model of the branch junction proposed by Rouiller et al.11 was very stable during our simulations with two alternative mother filament models: the RMSD of the complex was less than the reported resolution of the structure. Given the (relatively) large size of the complex, comprising over 31 individual protein subunits, the low RMSD we observed during simulation is a sign of the overall quality of the structured proposed by Rouiller et al. The present simulations have a comparable or even slightly smaller total RMSD from the starting structure compared to previous MD simulations of actin filaments21 and ADF/cofilin-bound actin filaments30 over similar timescales. This adds further support to the idea that timescales accessible to million-atom simulations can be sufficiently equilibrated and used for determining atomistic structural detail. Moreover, using the MD-derived RMSD as a signature of stability, we were able to discriminate between two different models of the active Arp2/3 complex (a less than optimal steered-MD simulation of Arp2/3 complex vs. experiment) as well as two different models of the active complex bound to the actin mother filament (Branch08 vs. Branch10).
The comparison between the experimental data and the MD simulations showed that both the structure of subunit M6 (which binds Arp2/3 in the branch junction) and the relative position of ARPC3 in the branch junction merit further investigation. The relatively fast relaxation of both of these subunits during the first few hundred ps of MD simulation indicate that these features of the structure started high on the energetic landscape defined by our force fields. We do not know whether this response is a limitation of MD force fields per-se or if the conservative modeling approach (rigid-body movements only), chosen for the EM study to minimize overfitting at limited resolution, was too coarse to move these structural elements into the radius of convergence associated with MD methodology. The combination of the MD simulations and experimentally measured density map pinpointed specific areas that need attention in future studies.
The simulations revealed an extensive network of salt bridges in the interface between the actin mother filament and Arp2/3 complex in the branch junction. Substitution mutations of some of charged residues contributing to these salt bridges have established their functional importance.12 The cumulative effect of these contacts is strong binding between Arp2/3 complex and the mother filament, which is able to withstand and transmit significant force during cell motility. A large number of contacts between hydrophobic residues on Arp2/3 complex and the mother filament further strengthen the binding interface. Although the total number of hydrophobic contacts declined during the simulation, with significant loss at the ARPC2/ARPC4 dimer interface, the large number of stable and nonspecific interactions may point to a secondary mechanism that stabilizes Arp2/3 complex binding. The contact points identified in this work (both salt-bridge and hydrophobic contacts) will provide targets for expanded experimental studies of the contact architecture of the branch junction.
Our simulations also helped to clarify the roles of the D-loops in actin, Arp3 and possibly Arp2 as stabilizing structural features in three regions of the branch junction. First, extended contacts of the D-loops of both Arp2 and Arp3 stabilize the interface with the mother filament, which links the daughter filament and mother filament mechanically. Second, strong contacts between the D-loops of daughter filament subunits D1 and D2 with Arp2/3 complex create a dense and compact binding interface at the base of the daughter filament. Third, the D-loops of mother filament subunits M6 and M8 were stabilized in an extended or slightly extended conformation radially away from the center of the filament. This radial movement of SD2 is suggestive of the mechanism by which cofilin alters the mechanical properties of actin filaments30 or a recently proposed mechanism by which the D-loop can modulate actin’s dynamics31, and provides further clues regarding the role of SD2 in filament structure and function. The MD simulations also suggest that interactions with the mother filament stabilizes an additional turn in the “insert helix” in 228-322 loop of ARPC1. This augmented insert helix is the only postulated contact between ARPC1 and the mother filament and. offers a target for future experimental studies.
Methods
All input structures for MD simulations were created using the structure of Rouiller et al. based on electron tomography as a starting point.11 The model referred to as Branch08 is based on the original tomography structure, which used a Holmes-like filament conformation32,33 and modified subunits M6/M8 from their starting conformation during the original fitting procedure. The model referred to as Branch10 uses the active Arp2/3 complex and M6/M8 dimer from Rouiller et al. in combination with the recent Namba et al. filament model22 for the remaining mother filament subunits and the entire daughter filament. Thus, the two models have identical active Arp2/3 complexes, but the Branch10 model has filament subunits reflecting the previously observed flattening of actin in three-dimensional reconstructions of the filament from electron micrographs.32,34 All MD calculations were performed using NAMD35 in conjunction with the CHARM22+CMAP force field.36,37 We used Visual Molecular Dynamics (VMD)25 to analyze the MD calculations and created figures of the proteins. Error estimates are based on the fluctuation of the observables over the production period (last 25 ns) of the simulations.
The missing subdomains of the Arp2 subunit were modeled in a similar manner as previously reported.16 The branch junction was prepared with ADP/Ca2+ bound to all actin subunits except Arp3, which had bound ATP/Ca2+. The choice of calcium for the divalent was motivated to have consistency with our previous filament simulation results and the subunit x-ray structures from which our starting structures were derived and should not affect our observations related to branch junction structural features. The DNase I binding (D-loop) of all actin subunits was placed in a helical conformation according to the structure proposed by Otterbein et al.38 The D-loop of subunit M6 had an unfolded and extended to achieve the best fit with the observed tomography data. The 11 daughter filament subunits (numbered D1-11 with D1 starting at the pointed end) were all placed in two different types of filament conformations as described in the main text. Water molecules were placed in the nucleotide binding pocket similar to the those found in ADP monomeric actin structures.25,38 The system was ionized with and placed in a box of explicit TIP3P39 water molecules using the standard plugins in VMD. A distance of at least 15 Å was maintained between the protein surface and the edge of the periodic cell, and the distance between the edge of the daughter filament and the ‘bottom’ of the mother filament (Fig. 1) was even larger to ensure that any movement by the daughter filament could not interfere with the mother filament dynamics. The total simulation environment contained 2.97 million atoms.
All MD calculations were performed using NAMD35 using the CHARM22+CMAP36,37 force field in conjunction with the particle mesh Ewald sum method40 for calculating electrostatic interactions. Before starting the simulation, an extensive minimization procedure was performed wherein three consecutive conjugate gradient minimization simulations (non-water molecules fixed, protein fixed, all free) were performed for 15,000 steps each. During MD simulations, we achieved good scaling on up to 4,000 processes on the Kraken XT5 supercomputer at the National Institute for Computational Science (NICS.) However, to maximize throughput and minimize the total cost of CPU hours per ns of MD simulation, we performed the full MD simulation using only 1,800 processors.
All intramolecular hydrogen bonds were constrained using the SHAKE41 algorithm, allowing for an integration timestep of 2 fs. After heating the system to 310 K, a 100 ps equilibration was performed in the canonical ensemble by velocity rescaling. Following this, the simulations were continued in the isobaric-isothermal (constant NPT) ensemble (310 K, 1.01325 bar) through the use of Langevin dynamics and the Langevin piston method via its implementation in NAMD.42,43 The damping coefficient used for Langevin dynamics was 0.5 ps−1 and the Langevin piston was controlled using a piston period decay of 2 ps. The simulation was continued for an additional simulation time of 75 ns. The strategy we employed was to run the NPT simulation until the box length along the mother filament axis stabilized, and then continued for an additional 25 ns “production phase.” Unless otherwise noted, results reported from MD simulations are based on the last 25 ns. The unit cell length and the total RMSD (calculated by alignment to the initial structure) of the complex were the slowest properties to equilibrate and therefore a good signature of when ensemble data could be collected. However, for all of the other individual properties we characterized and reported in this work, we took extra care to make sure their values were flat during the final 25 ns production phase. Overall, that the evidence supports that our simulation has reached the extent of equilibrium that is possible for such a large system on the timescales currently accessible via MD simulation.
Docking of representative models from the last 25 ns of the simulation was performed with CoAn software.27,28 First, we extracted from the MD models the subunits that were represented by the density derived from electron-tomography: 12 mother filament subunits; 4 daughter filament subunits; and Arp2/3 complex. Each of these pruned models was docked optimally into the experimental density as a complete rigid body. The resulting maximized correlation coefficient was then compared to the confidence interval of the correlation coefficient as derived from the original experimental data.11,29 Local comparisons of the fits were based on changes in the number of alpha-carbons inside the density map at the contour level that represents best the expected volume of the branch junction.
Supplementary Material
Acknowledgments
This work was supported in part by National Science Foundation International Research Fellows Program (OISE-0700080) (to JP) and National Institutes of Health research grant GM066311 (to D.H., N.V. and T.D.P.). Computational support was provided by NSF Teragrid resources at the National Institute for Computational Sciences. The authors thank Patrick Burney for his assistance in visualization tools.
Footnotes
Publisher's Disclaimer: This is a PDF file of an unedited manuscript that has been accepted for publication. As a service to our customers we are providing this early version of the manuscript. The manuscript will undergo copyediting, typesetting, and review of the resulting proof before it is published in its final citable form. Please note that during the production process errors may be discovered which could affect the content, and all legal disclaimers that apply to the journal pertain.
References
- 1.Pollard TD. Regulation of actin filament assembly by Arp2/3 complex and formins. Annu. Rev. Biophys. Biomol. Struct. 2007;36:451–477. doi: 10.1146/annurev.biophys.35.040405.101936. [DOI] [PubMed] [Google Scholar]
- 2.Dayel MJ, Holleran EA, Mullins RD. Arp2/3 complex requires hydrolyzable ATP for nucleation of new actin filaments. Proc. Natl. Acad. Sci. 2001;98:14871–14876. doi: 10.1073/pnas.261419298. [DOI] [PMC free article] [PubMed] [Google Scholar]
- 3.Nolen BJ, Pollard TD. Insights into the influence of nucleotides on actin family proteins from seven structures of Arp2/3 complex. Mol. Cell. 2007;26:449–457. doi: 10.1016/j.molcel.2007.04.017. [DOI] [PMC free article] [PubMed] [Google Scholar]
- 4.Kiselar JG, Mahaffy R, Pollard TD, Almo SC. Visualizing Arp2/3 complex activation mediated by binding of ATP and WASp using structural mass spectrometry. Proc. Natl. Acad. Sci. 2007;104:1552–1557. doi: 10.1073/pnas.0605380104. [DOI] [PMC free article] [PubMed] [Google Scholar]
- 5.Robinson RC, Turbedsky K, Kaiser DA, Marchand JB, Higgs HN, Choe S, Pollard TD. Crystal structure of Arp2/3 complex. Science. 2001;294:1679–1684. doi: 10.1126/science.1066333. [DOI] [PubMed] [Google Scholar]
- 6.Nolen BJ, Littlefield RS, Pollard TD. Crystal structures of actin-related protein 2/3 complex with bound ATP or ADP. Proc. Natl. Acad. Sci. 2004;101:15627–15632. doi: 10.1073/pnas.0407149101. [DOI] [PMC free article] [PubMed] [Google Scholar]
- 7.Nolen BJ, Pollard TD. Structure and biochemical properties of fission yeast Arp2/3 complex lacking the Arp2 subunit. J Biol Chem. 2008;283:26490–26498. doi: 10.1074/jbc.M802607200. [DOI] [PMC free article] [PubMed] [Google Scholar]
- 8.Nolen BJ, Tomasevic N, Russell A, Pierce DW, Jia Z, McCormick CD, Hartman J, Sakowicz R, Pollard TD. Characterization of two classes of small molecule inhibitors of Arp2/3 complex. Nature. 2009;460:1031–1034. doi: 10.1038/nature08231. [DOI] [PMC free article] [PubMed] [Google Scholar]
- 9.Volkmann N, Amann KJ, Stoilova-McPhie S, Egile C, Winter DC, Hazelwood L, Heuser JE, Li R, Pollard TD, Hanein D. Structure of Arp2/3 complex in its activated state and in actin filament branch junctions. Science. 2001;293:2456–2459. doi: 10.1126/science.1063025. [DOI] [PubMed] [Google Scholar]
- 10.Egile C, Rouiller I, Xu XP, Volkmann N, Li R, Hanein D. Mechanism of filament nucleation and branch stability revealed by the structure of the Arp2/3 complex at actin branch junctions. PLoS Biol. 2005;3:1902–1909. doi: 10.1371/journal.pbio.0030383. [DOI] [PMC free article] [PubMed] [Google Scholar]
- 11.Rouiller I, Xu X, Amann KJ, Egile C, Nickell S, Nicastro D, Li R, Pollard TD, Volkmann N, Hanein D. The structural basis of actin filament branching by the Arp2/3 complex. J. Cell Biol. 2008;180:887–895. doi: 10.1083/jcb.200709092. [DOI] [PMC free article] [PubMed] [Google Scholar]
- 12.Goley ED, Rammohan A, Znameroski EA, Firat-Karalar EN, Sept D, Welch MD. An actin-filament-binding interface on the Arp2/3 complex is critical for nucleation and branch stability. Proceedings of the National Academy of Sciences. 2010;107:8159–8164. doi: 10.1073/pnas.0911668107. [DOI] [PMC free article] [PubMed] [Google Scholar]
- 13.Chu JW, Voth GA. Allostery of actin filaments: Molecular dynamics simulations and coarse-grained analysis. Proc. Natl. Acad. Sci. USA. 2005;102:13111–13116. doi: 10.1073/pnas.0503732102. [DOI] [PMC free article] [PubMed] [Google Scholar]
- 14.Zheng X, Diraviyam K, Sept D. Nucleotide effects on the structure and dynamics of actin. Biophys. J. 2007;93:1277–1283. doi: 10.1529/biophysj.107.109215. [DOI] [PMC free article] [PubMed] [Google Scholar]
- 15.Dalhaimer P, Pollard TD, Nolen BJ. Nucleotide-mediated conformational changes of monomeric actin and Arp3 studied by molecular dynamics simulations. J. Mol. Biol. 2008;376:166–183. doi: 10.1016/j.jmb.2007.11.068. [DOI] [PMC free article] [PubMed] [Google Scholar]
- 16.Pfaendtner J, Voth GA. Molecular dynamics simulation and coarse-grained analysis of the Arp2/3 complex. Biophys. J. 2008;95:5324–5333. doi: 10.1529/biophysj.108.143313. [DOI] [PMC free article] [PubMed] [Google Scholar]
- 17.Pfaendtner J, Branduardi D, Parrinello M, Pollard TD, Voth GA. Nucleotide-dependent conformational states of actin. Proc. Natl. Acad. Sci. 2009;106:12723–12728. doi: 10.1073/pnas.0902092106. [DOI] [PMC free article] [PubMed] [Google Scholar]
- 18.Splettstoesser T, Noe F, Oda T, Smith JC. Nucleotide-dependence of G-actin conformation from multiple molecular dynamics simulations and observation of a putatively polymerization-competent superclosed state. Proteins. 2009;76:353–364. doi: 10.1002/prot.22350. [DOI] [PubMed] [Google Scholar]
- 19.Chu JW, Voth GA. Coarse-grained modeling of the actin filament derived from atomistic-scale simulations. Biophys. J. 2006;90:1572–1582. doi: 10.1529/biophysj.105.073924. [DOI] [PMC free article] [PubMed] [Google Scholar]
- 20.Oztug Durer ZA, Diraviyam K, Sept D, Kudryashov DS, Reisler E. F-actin structure destabilization and DNase I binding loop fluctuations: mutational cross-linking and electron microscopy analysis of loop states and effects on F-actin. J. Mol. Biol. 2010;395:544–557. doi: 10.1016/j.jmb.2009.11.001. [DOI] [PMC free article] [PubMed] [Google Scholar]
- 21.Pfaendtner J, Lyman E, Pollard TD, Voth GA. Structure and dynamics of the actin filament. J. Mol. Biol. 2010;396:252–263. doi: 10.1016/j.jmb.2009.11.034. [DOI] [PMC free article] [PubMed] [Google Scholar]
- 22.Fujii T, Iwane AH, Yanagida T, Namba K. Direct visualization of secondary structures of F-actin by electron cryomicroscopy. Nature. 2010;467:724–728. doi: 10.1038/nature09372. [DOI] [PubMed] [Google Scholar]
- 23.Blanchoin L, Amann KJ, Higgs HN, Marchand J-B, Kaiser DA, Pollard TD. Direct observation of dendritic actin filament networks nucleated by Arp2/3 complex and WASP/Scar proteins. Nature. 2000;404:1007–1011. doi: 10.1038/35010008. [DOI] [PubMed] [Google Scholar]
- 24.Dalhaimer P, Pollard TD. Molecular Dynamics Simulations of Arp2/3 complex Activation. Biophys. J. 2010;99:2568–2576. doi: 10.1016/j.bpj.2010.08.027. [DOI] [PMC free article] [PubMed] [Google Scholar]
- 25.Humphrey W, Dalke A, Schulten K. VMD: Visual molecular dynamics. J. Mol. Graphics. 1996;14:33–38. doi: 10.1016/0263-7855(96)00018-5. [DOI] [PubMed] [Google Scholar]
- 26.Gournier H, Goley ED, Niederstrasser H, Trinh T, Welch MD. Reconstitution of human Arp2/3 complex reveals critical roles of individual subunits in complex structure and activity. Mol Cell. 2001;8:1041–1052. doi: 10.1016/s1097-2765(01)00393-8. [DOI] [PubMed] [Google Scholar]
- 27.Volkmann N, Hanein D. Quantitative fitting of atomic models into observed densities derived by electron microscopy. Journal of Structural Biology. 1999;125:176–184. doi: 10.1006/jsbi.1998.4074. [DOI] [PubMed] [Google Scholar]
- 28.Volkmann N, Hanein D. Docking of atomic models into reconstructions from electron microscopy. Methods Enzymol. 2003;374:204–225. doi: 10.1016/S0076-6879(03)74010-5. [DOI] [PubMed] [Google Scholar]
- 29.Volkmann N. Confidence intervals for fitting of atomic models into low-resolution densities. Acta Crystallogr D Biol Crystallogr. 2009;65:679–689. doi: 10.1107/S0907444909012876. [DOI] [PMC free article] [PubMed] [Google Scholar]
- 30.Pfaendtner J, De La Cruz E, Voth GA. Actin filament remodeling by cofilin. Proc. Natl. Acad. Sci. 2010;107:7299–7304. doi: 10.1073/pnas.0911675107. [DOI] [PMC free article] [PubMed] [Google Scholar]
- 31.Narita A, Oda T, Maeda Y. Structural basis for the slow dynamics of the actin filament pointed end. Embo J. 2011;30:1230–1237. doi: 10.1038/emboj.2011.48. [DOI] [PMC free article] [PubMed] [Google Scholar]
- 32.Volkmann N, Liu H, Hazelwood L, Krementsova EB, Lowey S, Trybus KM, Hanein D. The structural basis of myosin V processive movement as revealed by electron cryomicroscopy. Mol. Cell. 2005;19:595–605. doi: 10.1016/j.molcel.2005.07.015. [DOI] [PubMed] [Google Scholar]
- 33.Holmes KC, Popp D, Gebhard W, Kabsch W. Atomic model of the actin filament. Nature. 1990;347:44–49. doi: 10.1038/347044a0. [DOI] [PubMed] [Google Scholar]
- 34.Oda T, Iwasa M, Aihara T, Maeda Y, Narita A. The nature of the globular- to fibrous-actin transition. Nature. 2009;457:441–445. doi: 10.1038/nature07685. [DOI] [PubMed] [Google Scholar]
- 35.Phillips JC, Braun R, Wang W, Gumbart J. Scalable molecular dynamics with NAMD. J. Comput. Chem. 2005;26:1781–1802. doi: 10.1002/jcc.20289. [DOI] [PMC free article] [PubMed] [Google Scholar]
- 36.MacKerell AD, Bashford D, Bellott M, Dunbrack RL, Evanseck JD, Field MJ, Fischer S, Gao J, Guo H, Ha S, Joseph-McCarthy D, Kuchnir L, Kuczera K, Lau FTK, Mattos C, Michnick S, Ngo T, Nguyen DT, Prodhom B, Reiher WE, Roux B, Schlenkrich M, Smith JC, Stote R, Straub J, Watanabe M, Wiorkiewicz-Kuczera J, Yin D, Karplus M. All-atom empirical potential for molecular modeling and dynamics studies of proteins. J. Phys. Chem. B. 1998;102:3586–3616. doi: 10.1021/jp973084f. [DOI] [PubMed] [Google Scholar]
- 37.Mackerell AD, Jr., Feig M, Brooks CL., 3rd Extending the treatment of backbone energetics in protein force fields: limitations of gas-phase quantum mechanics in reproducing protein conformational distributions in molecular dynamics simulations. J Comput Chem. 2004;25:1400–1415. doi: 10.1002/jcc.20065. [DOI] [PubMed] [Google Scholar]
- 38.Otterbein LR, Graceffa P, Dominguez R. The crystal structure of uncomplexed actin in the ADP state. Science. 2001;293:708–711. doi: 10.1126/science.1059700. [DOI] [PubMed] [Google Scholar]
- 39.Jorgensen WL, Chandrasekhar J, Madura JD, Impey RW, Klein ML. Comparison of simple potential functions for simulating liquid water. J. Chem. Phys. 1983;79:926–935. [Google Scholar]
- 40.Darden T, York D, Pedersen L. Particle mesh Ewald: an N·log(N) method for ewald sums in large systems. J. Chem. Phys. 1993;98:10089–10092. [Google Scholar]
- 41.Ryckaert JP, Ciccotti G, Berendsen HJC. Numerical integration of cartesian equations of motion of a system with constraints: molecular-dynamics of n-alkanes. J. Comput. Phys. 1977;23:327–341. [Google Scholar]
- 42.Feller SE, Zhang YH, Pastor RW, Brooks BR. Constant-pressure molecular-dynamics simulation - the Langevin piston method. J. Chem. Phys. 1995;103:4613–4621. [Google Scholar]
- 43.Martyna GJ, Tobias DJ, Klein ML. Constant-pressure molecular-dynamics algorithms. J. Chem. Phys. 1994;101:4177–4189. [Google Scholar]
Associated Data
This section collects any data citations, data availability statements, or supplementary materials included in this article.


