

Abstract
BACKGROUND AND PURPOSE
Imatinib, a cytochrome P450 2C8 (CYP2C8) and CYP3A4 substrate, markedly increases plasma concentrations of the CYP3A4/5 substrate simvastatin and reduces hepatic CYP3A4/5 activity in humans. Because competitive inhibition of CYP3A4/5 does not explain these in vivo interactions, we investigated the reversible and time-dependent inhibitory effects of imatinib and its main metabolite N-desmethylimatinib on CYP2C8 and CYP3A4/5 in vitro.
EXPERIMENTAL APPROACH
Amodiaquine N-deethylation and midazolam 1′-hydroxylation were used as marker reactions for CYP2C8 and CYP3A4/5 activity. Direct, IC50-shift, and time-dependent inhibition were assessed with human liver microsomes.
KEY RESULTS
Inhibition of CYP3A4 activity by imatinib was pre-incubation time-, concentration- and NADPH-dependent, and the time-dependent inactivation variables KI and kinact were 14.3 µM and 0.072 min−1 respectively. In direct inhibition experiments, imatinib and N-desmethylimatinib inhibited amodiaquine N-deethylation with a Ki of 8.4 and 12.8 µM, respectively, and midazolam 1′-hydroxylation with a Ki of 23.3 and 18.1 µM respectively. The time-dependent inhibition effect of imatinib was predicted to cause up to 90% inhibition of hepatic CYP3A4 activity with clinically relevant imatinib concentrations, whereas the direct inhibition was predicted to be negligible in vivo.
CONCLUSIONS AND IMPLICATIONS
Imatinib is a potent mechanism-based inhibitor of CYP3A4 in vitro and this finding explains the imatinib–simvastatin interaction and suggests that imatinib could markedly increase plasma concentrations of other CYP3A4 substrates. Our results also suggest a possibility of autoinhibition of CYP3A4-mediated imatinib metabolism leading to a less significant role for CYP3A4 in imatinib biotransformation in vivo than previously proposed.
Keywords: imatinib, mechanism-based inhibition, CYP3A4, CYP2C8, metabolism
Introduction
Imatinib (Gleevec, Glivec) is the first rationally designed tyrosine kinase inhibitor approved for clinical use, and it has revolutionized the treatment of chronic myelogenous leukaemia (CML), advanced gastrointestinal stromal tumours (GIST) and other haematological and oncological diseases (Kovacsovics and Maziarz, 2006; Duffaud and Le Cesne, 2009; Stegmeier et al., 2010). The compound has favourable pharmacokinetic properties, including a rapid absorption, complete oral bioavailability (>97%) and terminal elimination half-life of 18–20 h (Peng et al., 2004a,b). Imatinib is mainly eliminated via biliary-faecal excretion as unchanged drug and metabolites (Food and Drug Administration, 2001; Gschwind et al., 2005; European Medicines Agency, 2011). Following a single oral dose, the parent drug accounts for 70% of the drug concentration in plasma and about 28% of the excreted drug, whereas the main metabolite N-desmethylimatinib (CGP74588) (Figure 1), which is pharmacologically active, accounts for 10% of the plasma, and 13% of excreted, drug (Gschwind et al., 2005). Imatinib has numerous minor metabolites, including both oxidative metabolites and their N- or O-glucuronides. Imatinib is primarily metabolized by cytochrome P450 3A4 (CYP3A4) (Food and Drug Administration, 2001; Marull and Rochat, 2006; Rochat et al., 2008; European Medicines Agency, 2011; enzyme nomenclature follows Alexander et al., 2011), but a recent in vitro study suggests significant contribution by CYP2C8 to its N-demethylation (Nebot et al., 2010).
Figure 1.
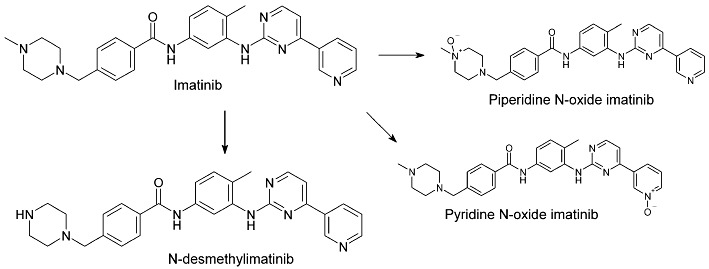
Molecular structures of imatinib, its main metabolite N-desmethylimatinib and two of its minor metabolites, piperidine N-oxide imatinib and pyridine N-oxide imatinib.
According to clinical studies, imatinib is a relatively potent inhibitor of CYP3A4/5-mediated drug metabolism. In an interaction study in CML patients, imatinib 400 mg daily increased the maximal concentration (Cmax) and area under the plasma concentration–time curve (AUC) of the CYP3A4/5 substrate simvastatin 2- and 3.5-fold, respectively, compared with simvastatin alone (O'Brien et al., 2003). In other studies in patients with CML, GIST, and breast cancer, imatinib 400–600 mg daily reduced hepatic CYP3A4/5 activity, as reflected by the erythromycin breath test, by 10–70% (Gurney et al., 2007; Connolly et al., 2011). However, there is little published information on the inhibition of CYP enzymes by imatinib in vitro and the available data does not adequately explain the interactions with CYP3A4/5 substrates. According to reviews provided by the manufacturer of imatinib, both imatinib and N-desmethylimatinib competitively inhibited CYP3A4/5 with inhibition constants (Ki) of 8.0 and 13.7 µM, respectively, in human liver microsomes (HLM) (Food and Drug Administration, 2001). These values greatly exceed the unbound concentrations of imatinib and N-desmethylimatinib in plasma (<1 and <0.1 µM, respectively). In addition, imatinib inhibited CYP2C8 with a Ki value of 34.7 µM and N-desmethylimatinib inhibited it with a half maximal inhibitory concentration (IC50) of 99 µM (Food and Drug Administration, 2001; European Medicines Agency, 2011). Furthermore, imatinib and its main metabolite are competitive inhibitors of CYP2D6 (Ki= 7.5 and 13.5 µM respectively). However, despite similar Ki values of imatinib and N-desmethylimatinib for CYP2D6 and CYP3A4/5; imatinib (400 mg twice daily) affected only marginally (<28% increase in AUC) the pharmacokinetics of the CYP2D6 substrate metoprolol in Chinese CML patients (Wang et al., 2008), indicating that the CYP2D6 inhibition effect was negligible in vivo.
Thus, there seems to be a discrepancy between the in vitro and in vivo studies, suggesting that the CYP3A4/5 inhibitory effects of imatinib documented in humans cannot be explained by the competitive CYP3A4/5 inhibitory effects observed in vitro. Because both CYP2C8 and CYP3A4/5 are involved in the N-demethylation of imatinib in vitro, and because comprehensive documentation of the CYP2C8 and CYP3A4/5 inhibitory effects of imatinib and N-desmethylimatinib is lacking, we carefully evaluated their direct and irreversible inhibitory effects on these enzymes. Our results showed that both imatinib and its N-desmethyl metabolite are only moderately potent direct inhibitors of CYP2C8 and CYP3A4/5, but that parent imatinib is a potent irreversible, mechanism-based CYP3A4 inhibitor, which is more likely to explain the CYP3A4 inhibitory effects of imatinib observed in vivo.
Methods
Incubation conditions
Amodiaquine N-deethylation and midazolam 1′-hydroxylation were used as marker reactions for CYP2C8 and CYP3A4/5 activity respectively. The incubations contained human liver microsomes (HLM; 0.1 mg·mL−1 protein; if not otherwise indicated; BD Biosciences) or recombinant CYP3A4 or CYP3A5 (with protein concentrations of 0.03 and 0.07 mg·mL−1, respectively, leading to activities identical to those in HLM incubations) in 0.1 M sodium phosphate buffer (pH 7.4). Amodiaquine and midazolam concentrations ranged from 0.6 to 20 µM depending on experiment, as described in detail below. To evaluate the inhibitory effects of imatinib and its metabolites N-desmethylimatinib, piperidine N-oxide imatinib (CGP71422) and pyridine N-oxide imatinib (CGP72383) on CYP2C8 and CYP3A4/5 activity, inhibitor concentrations between 0.1 and 500 µM, depending on the experiment, were added to the incubation mixtures. In direct inhibition incubations, inhibitor or buffer control and substrate were premixed with microsomes and buffer for 3 min before addition of 1.0 mM NADPH, which initiated the reactions. In time-dependent inhibition incubations, the inhibitor or buffer control was pre-incubated for 30 min with HLM prior to NADPH addition and substrate was added to the mixture 3 min before NADPH was included to initiate the reaction (slow-binding inhibition experiment), or the inhibitor or buffer control was pre-incubated with HLM for 30 min with NADPH, followed by addition of substrate to initiate the reaction (metabolism-dependent inhibition experiments). The final incubations were performed in a shaking water bath (37°C) for 2 min. Reactions were stopped by moving 100 µL sample to 300 µL mobile phase B solution (see below for composition of mobile phases A and B) containing N-desethylamodiaquine-d5 and triazolam as internal standards. Samples were vortexed and put on ice for at least 10 min. After centrifugation (20 800× g for 10 min), the supernatant was evaporated to dryness under nitrogen in silanized glass tubes, and the residue was reconstituted with 100 µL of a solution containing mobile phase (A)/mobile phase (B) 95/5. The non-specific binding of 0.1 µM imatinib to HLM (0.1 and 0.5 mg·mL−1) was determined with ultrafiltration (centrifugation at 1200× g for 30 min at room temperature). Inhibitor and substrate compounds were dissolved in methanol, and the final solvent concentration in all incubations (including controls) was 1%. Incubations were performed in duplicates or triplicates. The incubation time was in the linear range for the rates of metabolite formation.
Measurement of drug concentrations
N-desethylamodiaquine and 1′-hydroxymidazolam concentrations were quantified by use of an Agilent 1100 series high-performance liquid chromatography system (Agilent Technologies, Waldbronn, Germany) coupled to a SCIEX API 2000 tandem mass spectrometer (MDS Sciex, Concord, ON, Canada) with an atmospheric-pressure chemical ionization source. Samples were separated on an Atlantis T3 column (2.1 × 100 mm, 3 µM; Waters Corporation, Milford, MA) using gradient elution. The mobile phases consisted of 0.3% formic acid in 5 mM ammonium formate (A) and 0.3% formic acid in 90/5/5 acetonitrile/methanol/water (B). The gradient comprised 1 min at 95% (A), 9 min to 60% (A), 4 min to 45% (A), 2 min to 15% (A), 0.1 min to 0% (A), 2.9 min at 0% (A), 0.1 min to 95% (A) and finally 6.9 min at 95% (A). Aliquots of 10 µL were injected at a mobile phase flow rate of 200 µL·min−1. Multiple reaction monitoring was performed in positive ionization mode. The following transitions were evaluated: 356 to 283 for amodiaquine, 328 to 283 for N-desethylamodiaquine, 333 to 283 for N-desethylamodiaquine-d5 (internal standard), 326 to 291 for midazolam, 342 to 324 for 1′-hydroxymidazolam and 343 to 308 for triazolam (internal standard). Retention times and mass spectra of the metabolites formed in the incubations were identical to those of the corresponding authentic standards. Calibration curves were linear (r2 > 0.99) over the ranges 0.001–1.4 µM and 0.002–2.9 µM for N-desethylamodiaquine and 1′-hydroxymidazolam, respectively. The lower limit of quantification was 0.001 µM for N-desethylamodiaquine and 0.002 µM for 1′-hydroxymidazolam. The inter-day coefficient of variation for N-desethylamodiaquine was 18% at 0.001 µM, 9.9% at 0.01 µM and 5.4% at 0.1 µM and for 1′-hydroxymidazolam it was 13% at 0.002 µM, 14% at 0.02 µM and 7.3% at 0.2 µM.
IC50-shift and direct inhibition experiments in HLM incubations
Various concentrations of imatinib (0.25–500 µM), N-desmethylimatinib (0.25–500 µM), piperidine N-oxide imatinib (0.1, 1 or 10 µM), pyridine N-oxide imatinib (0.1, 1 or 10 µM) or buffer control were as follows: (1) simultaneously incubated with 2 µM substrate (direct inhibition); (2) first pre-incubated for 30 min without NADPH, after which 2 µM substrate and NADPH were included as described previously (slow-binding inhibition); or (3) pre-incubated for 30 min with NADPH, after which 2 µM substrate was added to the mixture (metabolism-dependent inhibition). To further investigate direct inhibition by imatinib and N-desmethylimatinib, different inhibitor concentrations (5–30 µM) were simultaneously incubated with amodiaquine or midazolam (0.6–20 µM) for 2 min.
Time-dependent inhibition of CYP3A4 by imatinib
Various imatinib concentrations (2–128 µM) were pre-incubated with 0.5 mg·mL−1 HLM and NADPH for up to 30 min. At determined time points, an aliquot of 15 µL of the pre-incubation solution was moved to another tube containing NADPH and 8 µM midazolam in buffer in a final incubation volume of 300 µL. Thus, the protein and inhibitor concentrations had been diluted 20-fold, and a higher than Km concentration of midazolam was used to minimize direct inhibition by imatinib. To determine the effect of a competitive inhibitor on the time-dependent CYP3A4-inactivation by imatinib, the pre-incubation mixture was prepared as above. However, pre-incubations were carried out with or without ketoconazole (0.01, 0.1 and 1 µM), both in the absence (control) and presence of 16 µM imatinib. The mixture was pre-incubated for 30 min; aliquots were transferred to incubation tubes (20-fold dilution), and the residual midazolam 1′-hydroxylation activity was measured as previously described. To evaluate the effect of dialysis on the inhibitory effect of imatinib, HLM (0.5 mg·mL−1) were pre-incubated with or without 100 µM imatinib and NADPH for 30 min. The samples were immediately dialysed against 0.1 M sodium phosphate buffer (pH 7.4) three times for 2 h in a volume of 2 L at 4°C, which was followed by a 20-fold dilution and measurement of midazolam 1′-hydroxylation as previously explained.
Inhibition of midazolam 1′-hydroxylation by imatinib in recombinant CYP3A4 and CYP3A5 incubations
The effects of imatinib on midazolam 1′-hydroxylation in recombinant CYP3A4 (3.3 pmol·mL−1) and CYP3A5 (6.7 pmol·mL−1) were studied by incubating imatinib (0.1, 1 and 10 µM): (1) simultaneously with 2 µM midazolam; (2) for 30 min without NADPH, after which 2 µM substrate and NADPH was included; and (3) for 30 min with NADPH, after which 2 µM substrate was added to the mixture. The final incubations were conducted as previously described.
Data analysis
The IC50 values were determined by non-linear regression analysis with SigmaPlot software (version 9.01; Systat Software, Inc., San Jose, CA). For determination of direct inhibition Ki values, selection of the best-fit enzyme inhibition model was based on the Akaike information criterion (AIC) and on r2 (primary criteria) and on the examination of different inhibition plots (secondary criterion when AIC and r2 of different models were similar or when these values were conflicting with each other). Ki values were estimated by non-linear regression. For estimation of metabolism-dependent inactivation constants, pre-incubation time-dependent loss of CYP3A4 activity in the absence of imatinib was accounted for by adjusting the observed rate of metabolism with reference to the respective (vehicle) control incubation at each pre-incubation time. The initial rate constant of inactivation of CYP3A4 activity by each inhibitor concentration (Kobs) was determined by linear regression analysis of the natural logarithm of the percentage of activity remaining versus pre-incubation time (Kitz and Wilson, 1962). Thereafter, the Kobs values were used to determine the maximum inactivation rate (kinact) and the inhibitor concentration needed to cause half of kinact (KI). Initial estimates of KI and kinact were obtained from a double-reciprocal plot of the Kobs (y-axis) versus inhibitor concentration [I] (x-axis) (Kitz and Wilson, 1962). Then, the KI and kinact were estimated by non-linear regression using the following equation (Kitz and Wilson, 1962; Jones et al., 1999): Kobs=kinact×[I]/(KI+[I]).
In vivo simulations
For substrates that are metabolized in both intestine and liver, in vitro data describing inhibition can be used to evaluate the potential clinical impact of the inhibition according to the following equations (Rowland and Matin, 1973; Mayhew et al., 2000; Jones and Hall, 2002; Wang et al., 2004; Ito et al., 2005): AUCpo(I)/AUCpo(C)=FG(I)/FG(C)× 1/[fm×fm,CYP/(1 +[I]/Ki) + (1 −fm×fm,CYP)] for direct inhibition and AUCpo(I)/AUCpo(C)=FG(I)/FG(C)× 1/[fm×fm,CYP/(1 +kinact×[I]/[KI×kdeg]) + (1 −fm×fm,CYP)] for mechanism-based inhibition; where AUCpo(I) and AUCpo(C) are the areas under the concentration–time curve of the substrate in the presence and absence of the inhibitor, respectively; FG(I) describes the intestinal bioavailability in the presence of inhibitor; FG(C) is its control value; fm× fm,CYP expresses the fraction of the substrate dose cleared by the CYP enzyme; and kdeg is the rate constant of hepatic CYP degradation in the absence of the inhibitor. In the calculations, Ki and KI values were adjusted for non-specific binding to microsomes. In vivo estimates of average hepatic CYP3A4 half-lives range from 10 to 140 h (Yang et al., 2008), and in our simulations, half-lives of 36 and 72 h were used (corresponding to kdeg values of 0.00032 and 0.00016 min−1, respectively). The simulations were carried out for unbound imatinib concentrations of 0 to 0.70 µM, which corresponds to clinically relevant plasma concentrations. In particular, the simulations were related to steady-state unbound trough (Ctrough) and peak (Cmax) concentrations of imatinib in plasma during once daily dosing of imatinib 400 mg. When assuming a 95% protein binding of imatinib in plasma (Food and Drug Administration, 2001; Kretz et al., 2004), these values approximate to 0.1 and 0.25 µM respectively (Food and Drug Administration, 2001; le Coutre et al., 2004; Peng et al., 2004b; Picard et al., 2007; van Erp et al., 2007).
Furthermore, the unbound Cmax of imatinib in the portal vein was estimated from the following equation (Ito et al., 1998): Cmax,u,portal=fu× (Cmax+D×ka×Fa/Qhep), where fu represents the plasma unbound fraction, ka is the absorption rate constant (1.03 h−1 for imatinib) (Petain et al., 2008), Fa is the fraction absorbed, D represents the dose and Qhep expresses the hepatic blood flow (20.7 mL·min−1·kg−1) (Houston and Galetin, 2008). In the calculations, an imatinib mesilate dose of 400 mg was used, corresponding to an imatinib dose of 335 mg. Complete absorption of imatinib was assumed.
Interaction predictions with simvastatin as a CYP3A4 substrate
On the basis of the in vitro data obtained in the present study and using the equations described above, imatinib interactions with simvastatin were predicted with the assumption that the fraction of simvastatin metabolized by CYP3A4 is about 0.90, because potent CYP3A4 inhibitors have increased its AUC by >10-fold (Lilja et al., 1998; Neuvonen et al., 1998). FG(I)/FG(C) ratios were calculated, using simvastatin FG(C) data from literature (Obach et al., 2006; Gertz et al., 2008), from the following equation (Wang et al., 2004): FG(I)/FG(C)= 1/[FG(C)+ (1 −FG(C)) × (CLint,G(I)/CLint,G(C)) ], where CLint,G(I) and CLint,G(C) represent intestinal intrinsic clearance of the substrate in the presence and absence of an inhibitor respectively. Clearance ratios were calculated from in vitro data obtained in the present study according to the equations (Wang et al., 2004; Obach et al., 2006): CLint,G(I)/CLint,G(C)= 1/(1 +[IG,u]/Ki) for direct inhibition and CLint,G(I)/CLint,G(C)= 1/[1 + (kinact×[IG,u])/(kdeg(G)×[KI+[IG,u]])] for mechanism-based inhibition, where kdeg(G) is the rate constant of intestinal CYP degradation in the absence of inhibitor (0.0005 min−1 for CYP3A4) (Greenblatt et al., 2003; Obach et al., 2007; Yang et al., 2008), and [IG,u] represents the unbound inhibitor (imatinib) concentration in the intestinal wall during the absorption phase. It can be estimated using the unbound fraction of imatinib in plasma (0.05) and the following equation (Rostami-Hodjegan and Tucker, 2004): [IG]= D ×ka×Fa/Qent, where Qent is enterocytic blood flow (0.248 L·min−1) (Obach et al., 2007).
Materials
HLM and recombinant human CYP isoforms (Supersomes®) containing cytochrome b5 protein were obtained from BD Biosciences (Woburn, MA). Centrifree® ultrafiltration devices were purchased from Millipore Ireland Ltd. (Carrigtwohill, Ireland). Imatinib mesilate (mesylate salt) was from Sequoia Research Products Ltd. (Pangbourne, UK). N-desmethylimatinib from Synfine Research Inc. (Richmond Hill, ON, Canada). Amodiaquine dihydrochloride dihydrate, ammonium formate and β-NADPH were from Sigma Aldrich (St Louis, MO). N-desethylamodiaquine hydrochloride, N-desethylamodiaquine-d5, piperidine N-oxide imatinib and pyridine N-oxide imatinib were from Toronto Research Chemicals Inc. (North York, ON, Canada). Midazolam was from Hoffmann-La Roche & Co. Ltd. (Basel, Switzerland). 1′-Hydroxymidazolam was from SPI-Bio (Montigny Le Bretonneux, France). Triazolam was from the Upjohn Company (Kalamazoo, MI). Acetonitrile and methanol were from Rathburn Chemicals Ltd. (Walkerburn, Scotland). Other chemicals were from Merck (Darmstadt, Germany).
Results
Inhibition of CYP2C8 and CYP3A4/5 by imatinib and its metabolites with or without pre-incubation
In direct inhibition experiments, imatinib and N-desmethylimatinib inhibited amodiaquine N-deethylation (CYP2C8 marker reaction) with an IC50 value of 15.7 and 31.3 µM, respectively, and midazolam 1′-hydroxylation (CYP3A4/5 marker reaction) with an IC50 of 53.9 and 35.3 µM, respectively (Figure 2). Compared with direct inhibition, a 30 min pre-incubation of inhibitor with NADPH and HLM did not increase the inhibition of amodiaquine N-deethylation by imatinib and N-desmethylimatinib. Similarly, pre-incubation of N-desmethylimatinib with NADPH did not markedly affect inhibition of midazolam 1′-hydroxylation. However, a 30 min pre-incubation of imatinib in the presence of NADPH increased its CYP3A4/5 inhibitory effect, leading to an eightfold reduction in the IC50 value to 7.1 µM (Figure 2). Pre-incubation of imatinib or N-desmethylimatinib for 30 min in the absence of NADPH (slow-binding inhibition) did not increase their CYP2C8 and CYP3A4/5 inhibitory effects (IC50 data not shown).
Figure 2.
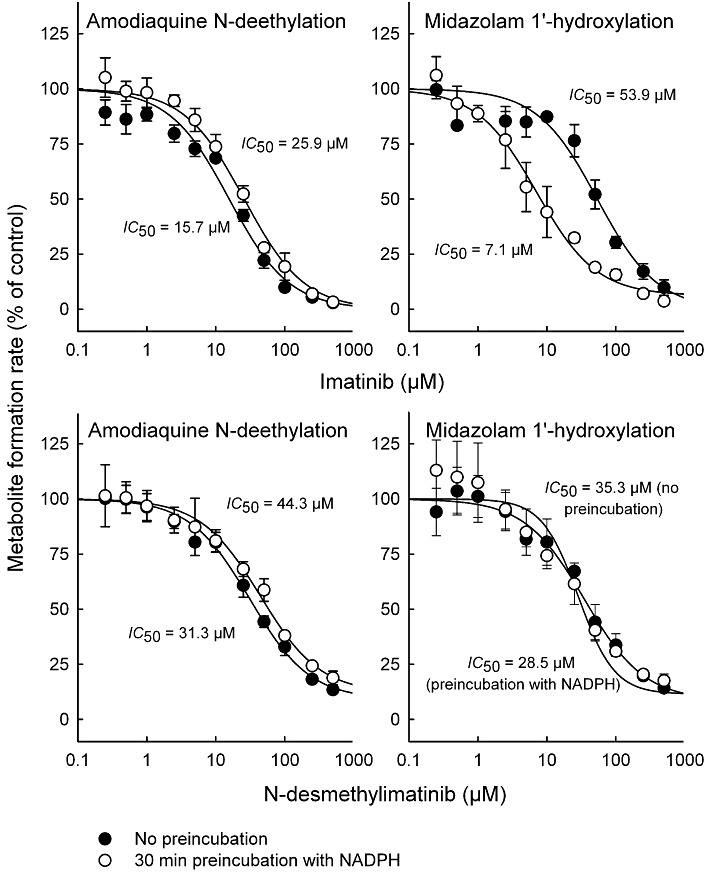
Effects of imatinib and N-desmethylimatinib on amodiaquine N-deethylation (CYP2C8 marker reaction) and midazolam 1′-hydroxylation (CYP3A4/5 marker reaction) with or without a 30 min pre-incubation in the presence of NADPH. Incubations were conducted in HLM incubations (0.1 mg·mL−1 protein) with 2 µM substrate. Pre-incubation of imatinib or N-desmethylimatinib for 30 min without NADPH did not increase the inhibition of the marker reactions (data not shown). Data points are mean ± SD values of triplicate incubations.
Piperidine N-oxide imatinib and pyridine N-oxide imatinib (0.1–10 µM) affected amodiaquine N-deethylation moderately (<38% inhibition), and pre-incubation with or without NADPH did not increase these inhibitory effects (Figure 3; data not shown). In direct inhibition incubations, midazolam 1′-hydroxylation was unaffected by piperidine N-oxide imatinib and pyridine N-oxide imatinib, but pre-incubations with 10 µM of these inhibitors with NADPH led to a weak inhibitory effect (6% and 19% inhibition, respectively; Figure 3). In comparison with direct inhibition data, pre-incubation of 10 µM imatinib with NADPH and recombinant CYP3A4 increased the inhibition of midazolam 1′-hydroxylation. However, pre-incubation did not affect the inhibitory effect in recombinant CYP3A5 incubations (Figure 3), suggesting that imatinib is a time-dependent inhibitor of CYP3A4, but not of CYP3A5.
Figure 3.
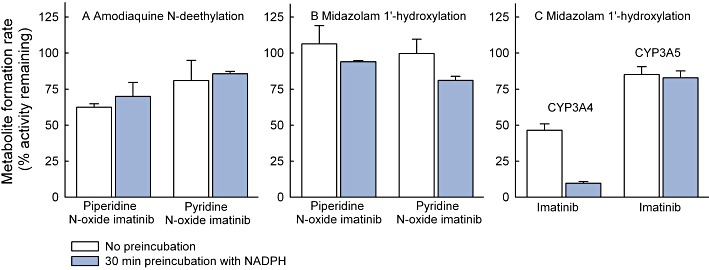
Effects of piperidine N-oxide imatinib (10 µM) and pyridine N-oxide imatinib (10 µM) on N-deethylation of 2 µM amodiaquine (A) and 1′-hydroxylation of 2 µM midazolam (B) in HLM incubations (0.1 mg·mL−1 protein), and the effect of 30 min pre-incubation with NADPH on inhibition of the 1′-hydroxylation of 2 µM midazolam by 10 µM imatinib (C) in recombinant CYP3A4 (3.3 pmol·mL−1) and CYP3A5 (6.7 pmol·mL−1) incubations. The inhibition by lower concentrations of piperidine N-oxide and pyridine N-oxide imatinib (0.1 and 1 µM) on the marker reactions was <15% and is not illustrated. Pre-incubation of imatinib without NADPH did not increase inhibition in CYP3A4 and CYP3A5 incubations. Data points represent mean ± SD values of duplicate incubations.
Direct inhibitory effects of imatinib and N-desmethylimatinib on CYP2C8 and CYP3A4/5
In direct inhibition experiments, imatinib and N-desmethylimatinib inhibited amodiaquine N-deethylation with Ki values of 8.4 and 12.8 µM, respectively, and both inhibition mechanisms were best described by a mixed full inhibition model (Figure 4). Direct inhibition of midazolam 1′-hydroxylation by imatinib was also best described by the mixed full inhibition model (Ki= 23.3 µM), whereas N-desmethylimatinib inhibited CYP3A4/5 activity in a competitive manner with a Ki of 18.1 µM.
Figure 4.
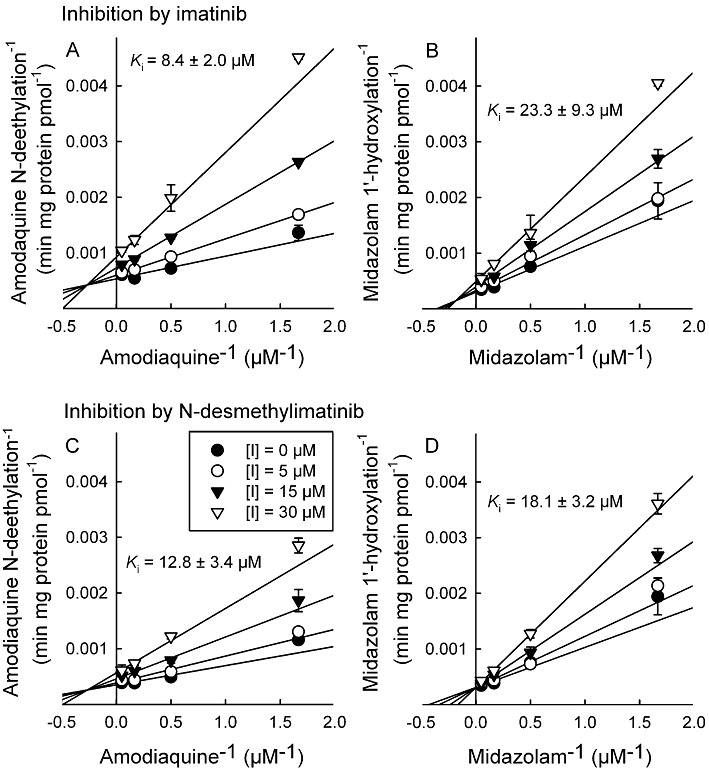
Double reciprocal (Lineweaver–Burk) plots for direct inhibition of amodiaquine N-deethylation and midazolam 1′-hydroxylation by different concentrations of imatinib (A and B, respectively), and by N-desmethylimatinib (C and D, respectively) in HLM incubations (0.1 mg·mL−1 protein). The inhibition of CYP2C8 and CYP3A4/5 activity by imatinib were both best described by a mixed full inhibition mechanism, whereas that by N-desmethylimatinib on CYP2C8 activity was best described by a mixed full inhibition and that on CYP3A4/5 activity by a full competitive inhibition model. Data points are mean ± SD values of duplicate incubations.
Time- and concentration-dependent inactivation of CYP3A4 by imatinib
The inhibition of CYP3A4 activity by imatinib was pre-incubation time- and concentration-dependent (Figure 5). With the non-linear regression method, the inactivation variables KI and kinact for CYP3A4 were 14.3 µM and 0.072 min−1 respectively. The kinact value implies that approximately 7% of CYP3A4 is inactivated each minute when a saturating concentration of imatinib is incubated with HLM. Ketoconazole reduced the imatinib-induced inactivation of CYP3A4 in a concentration-dependent manner (Table 1). Moreover, dialysis of pre-incubated HLM-imatinib solution for 3 × 2 h at 4°C did not abolish the inhibitory effect of imatinib on midazolam 1′-hydroxylation (Table 1).
Figure 5.
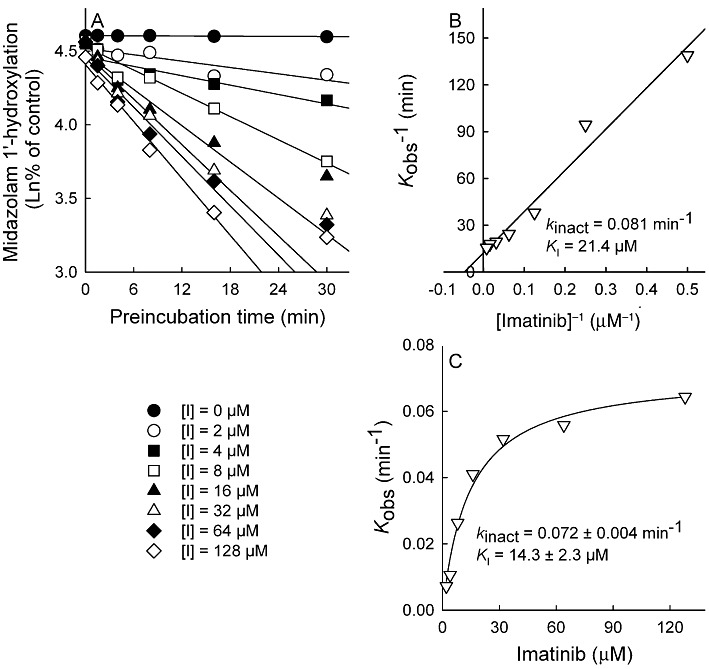
Pre-incubation time- and concentration-dependent inhibition of midazolam 1′-hydroxylation by imatinib (0–128 µM) in HLM incubations (0.5 mg·mL−1). Aliquots were removed from the pre-incubation mixtures at indicated time points and diluted 20-fold for measurement of residual CYP3A4 activity. The rate of inactivation of CYP3A4 activity by each inhibitor concentration (Kobs) was determined by linear regression analysis of the natural logarithm of the percentage of activity remaining versus pre-incubation time data (A). The Ki and kinact were calculated by linear regression of the double-reciprocal plot of the Kobs versus inhibitor concentration [I] (B) and by non-linear regression analysis of the Kobs versus imatinib concentration data according to the equation described in Methods (C). Incubations were conducted in triplicate.
Table 1.
The effect of the competitive inhibitor ketoconazole and dialysis on the pre-incubation-dependent inactivation of CYP3A4 by imatinib
| Variable | Percentage of control |
|---|---|
| Imatinib (16 µM) with ketoconazole | |
| Imatinib alone | 38.0 ± 2.6 |
| Imatinib with ketoconazole (0.01 µM) | 49.5 ± 0.0 |
| Imatinib with ketoconazole (0.1 µM) | 60.2 ± 5.0 |
| Imatinib with ketoconazole (1 µM) | 86.2 ± 7.0 |
| Dialysis of imatinib (100 µM) for 3 × 2 h at 4°C | |
| Imatinib prior to dialysis | 23.3 ± 1.8 |
| Imatinib with dialysis | 21.0 ± 1.4 |
Each experiment is compared with its own control, that is, either pre-incubation without imatinib, pre-incubation with ketoconazole (0.01–1 µM) but without imatinib or pre-incubation without imatinib followed by dialysis.
In the experiments with ketoconazole, 30 min pre-incubations including HLM (0.5 mg·mL−1) and NADPH were carried out with or without ketoconazole (0.01–1 µM), both in the absence (controls) and presence of imatinib, followed by 20-fold dilution for measurement of residual CYP3A4 activity. In dialysis experiments, HLM (0.5 mg·mL−1) and NADPH were pre-incubated with or without imatinib for 30 min. The samples were immediately dialysed against sodium phosphate buffer three times for 2 h, followed by a 20-fold dilution and measurement of CYP3A4 activity. Values are expressed as mean ± SEM. The inhibition and dialysis experiments were carried out in duplicate and triplicate respectively.
Prediction of in vivo drug interactions due to inhibition of hepatic CYP3A4
The predicted fold increase in the AUC of a CYP3A4 substrate with different imatinib concentrations is shown in Figure 6 for drugs with different fractions metabolized by CYP3A4, when mechanism-based inhibition of hepatic CYP3A4 is the only contributing mechanism. For this simulation, the KI value was first adjusted for non-specific binding of imatinib to 0.5 mg·mL−1 HLM protein (20%), yielding an adjusted KI of 11.4 µM. An unbound steady-state Cmax of imatinib in plasma after a 400 mg daily dose, 0.25 µM, was predicted to cause a 3.9-fold increase in the AUC of a drug for which the fm× fmCYP3A4 is 0.90 when the CYP3A4 degradation half-life was 36 h, and a 5.4-fold increase, when the CYP3A4 degradation half-life was 72 h. The respective increases with the unbound steady-state Ctrough of imatinib were 2.5-fold and 3.5-fold.
Figure 6.
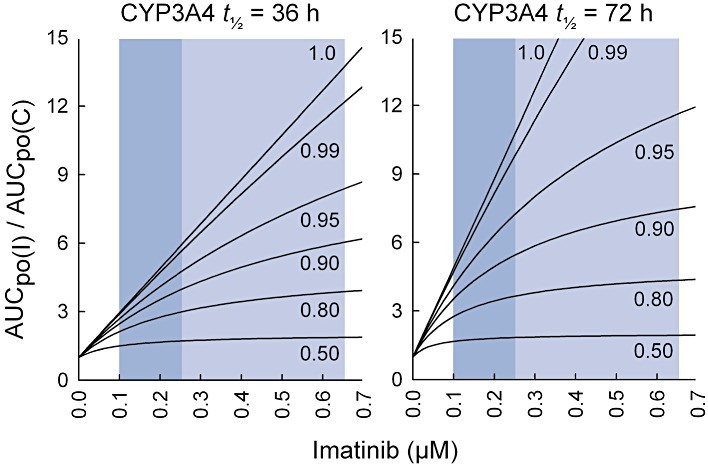
Prediction of the effect of imatinib on the pharmacokinetics of CYP3A4 substrates in vivo (AUCpo(I)/AUCpo(C)), assuming that intestinal bioavailability is unaffected (FG(I)/FG(C)= 1). The figures illustrate how the effect of imatinib on the AUC of the substrate depends on several factors: the concentration of imatinib at the enzyme site, the fraction of the substrate metabolized by CYP3A4 (fm× fm,CYP3A4 varying from 0.5 to 1.0) and on the CYP3A4 half-life. The simulation was carried out using the equation for mechanism-based inhibition for imatinib concentrations ranging from 0 to 0.7 µM. During treatment with 400 mg of imatinib mesilate daily, the average unbound Ctrough and Cmax concentrations in plasma approximate to 0.1 and 0.25 µM, respectively, whereas the unbound Cmax of imatinib in the portal vein was estimated as 0.65 µM (indicated by the blue areas).
When adjusting the direct inhibition Ki values for non-specific binding to 0.1 mg·mL−1 HLM (10%), the unbound imatinib Cmax in plasma, 0.25 µM, and the calculated unbound imatinib Cmax in the portal vein, 0.65 µM, were predicted to cause a 1% and 3% increase, respectively, in the AUC of a substrate completely metabolized by hepatic CYP3A4/5. The corresponding AUC increases for a CYP2C8 substrate with an fm× fmCYP2C8 of 1 were 3% and 9% respectively. A 0.65 µM concentration of N-desmethylimatinib (exceeding >20-fold its unbound Cmax in plasma) was predicted to increase the AUCs of CYP2C8 and CYP3A4/5 substrates by <5%.
Prediction of CYP3A4 inhibition in the intestinal wall
Using the absorption rate of imatinib and the enterocytic blood flow, the peak unbound imatinib concentration in the intestinal wall [IG,u] after a 400 mg dose of imatinib mesilate was estimated to approximate to 2.3 µM. On the basis of this concentration, the CLint(I)/CLint(C) ratios for inhibition of CYP3A4 in the intestinal wall by imatinib were estimated to be 0.9 and 0.04 for direct and mechanism-based inhibition respectively. To allow comparison of our predictions with the interaction between imatinib and simvastatin in vivo (O'Brien et al., 2003), the increase in simvastatin intestinal bioavailability (FG(I)/FG(C)) was predicted, assuming an FG(C) of 0.14 for simvastatin (Gertz et al., 2008). This prediction yielded an FG(I)/FG(C) ratio of 1.1 and 5.7 for direct and mechanism-based inhibition respectively. The corresponding ratios were 1.0 and 1.5, respectively, when assuming an FG(C) value of 0.66 (Obach et al., 2006). Assuming inhibition of both hepatic and intestinal CYP3A4 by imatinib, the maximal time-dependent interaction with simvastatin can be estimated from Figure 6 by multiplying the relevant AUCpo(I)/AUCpo(C) value with the FG(I)/FG(C) ratio for mechanism-based inhibition.
Discussion and conclusions
The present findings indicate that both imatinib and N-desmethylimatinib are moderately potent direct inhibitors of CYP2C8 and CYP3A4/5. Yet, in vitro–in vivo extrapolations implied that these inhibitory effects are unlikely to be clinically relevant. However, based on careful time-dependent inhibition experiments, we were able to demonstrate that imatinib is a mechanism-based inhibitor of CYP3A4, and that this effect is sufficiently strong to lead to clinically significant inactivation of hepatic and intestinal CYP3A4 enzymes. These conclusions are based on the following findings: the inhibitory effect on midazolam 1′-hydroxylation by imatinib was dependent on pre-incubation time, imatinib concentration and NADPH; the presence of a competitive CYP3A4 inhibitor decreased the inhibition; and dialysis was unable to restore enzyme activity. These observations suggest that the inactivating agent was formed at the CYP3A4 active site and did not dissociate from it before the inactivation occurred, consistent with criteria for mechanism-based inhibition (Silverman, 1995).
Compared with inhibitory constants reported in reviews by the manufacturer of imatinib (Food and Drug Administration, 2001; European Medicines Agency, 2011), the Ki value for direct CYP3A4/5 inhibition by imatinib obtained in the present study was almost three times higher. This difference might be explained by the choice of the CYP3A4/5 probe substrate. The previous incubations were carried out with testosterone 6β-hydroxylation as the marker reaction, whereas we used midazolam 1′-hydroxylation in our experiments. Because the testosterone assay typically requires a longer incubation time than the midazolam assay (Walsky and Obach, 2004), it is likely that time-dependent inhibition by imatinib contributed to the inhibitory effect in the previous Ki determinations, leading to overestimation of the CYP3A4 inhibitory potency. Interaction predictions based on the present Ki value for direct CYP3A4/5 inhibition (21 µM; when corrected for non-specific binding) and clinically relevant imatinib concentrations (<0.25 µM), resulted in insignificant AUC increases (<1%) for substrates completely metabolized by hepatic CYP3A4/5. However, when simulating interactions with simvastatin and incorporating direct inhibition of intestinal CYP3A4/5 by the maximum unbound predicted enterocytic concentration of imatinib, a slightly larger AUC increase of 1.1-fold was predicted. Even this prediction is likely to be an overestimate, because the simvastatin FG(C) of 0.14 used is an estimate from interaction studies with double-strength grapefruit juice, which is likely to include inhibition of transport proteins and hepatic CYP3A4 (Gertz et al., 2008). By comparison, a simvastatin FG value of 0.66 (Obach et al., 2006) yielded a predicted maximal increase of 4.5% in AUC. Thus, direct inhibition of CYP3A4/5 does not explain the interaction with simvastatin in humans.
Compared with direct inhibition, pre-incubation of imatinib in the presence of NADPH increased its inhibitory effect on midazolam 1′-hydroxylation, leading to an eightfold reduction in the IC50. In an additional experiment, the KI and kinact values of imatinib for CYP3A4 were 11 µM (after adjusting for microsomal binding) and 0.072 min−1 respectively. Interaction simulations based on inhibition of hepatic CYP3A4 using these values and imatinib Cmax,u yielded a maximal AUC increase of 5.9-fold for a drug completely metabolized by CYP3A4 during steady-state administration of 400 mg imatinib daily, when the hepatic CYP3A4 half-life was assumed to be 36 h; this CYP3A4 half-life was recently shown to give the most accurate interaction predictions (Rowland Yeo et al., 2011). Also, predictions including mechanism-based inactivation of intestinal CYP3A4 by imatinib with simvastatin as the substrate (FG= 0.66, fm× fmCYP3A4= 0.90), resulted in a maximal 5.9-fold increase in simvastatin AUC. Hence, compared with predictions based on direct inhibition of CYP3A4/5 by imatinib, the extrapolations based on mechanism-based inactivation constants correspond much better to the observed in vivo interactions. In the previous interaction study (O'Brien et al., 2003), 400 mg imatinib daily increased simvastatin AUC on average by 3.5-fold, and the individual changes for the 20 subjects ranged from no increase in AUC to >10-fold increase in AUC. Thus, compared with the average change in AUC, our predictions including inhibition of intestinal CYP3A4 slightly overestimated the interaction with simvastatin. A possible explanation for this is that simvastatin was administered simultaneously with imatinib in the previous study; that is, there was 24 h for intestinal and hepatic CYP3A4 to recover partly from inactivation by the previous imatinib dose, and insufficient time to reach maximal inactivation by the simultaneous imatinib dose in most of the subjects. Accordingly, it is likely that higher imatinib mesilate doses (e.g. 400 mg twice daily) can cause >10-fold increases in the AUC of the most sensitive CYP3A4 substrates, as also demonstrated by our simulations with imatinib concentrations >0.25 µM.
In addition to imatinib, three commercially available imatinib metabolites (Figure 1) were evaluated for time-dependent CYP3A4/5 inhibition in the present study. Pre-incubation of these metabolites with NADPH affected the inhibition of midazolam 1′-hydroxylation only slightly. N-desmethylimatinib, the major metabolite of imatinib, is formed via CYP2C8- and CYP3A4/5-mediated demethylation of the distal nitrogen atom on the piperazine ring of imatinib (Food and Drug Administration, 2001; Marull and Rochat, 2006; Rochat et al., 2008; Nebot et al., 2010). Oxidation of this same nitrogen by CYP3A4 generates the minor metabolite piperidine N-oxide imatinib (Rochat et al., 2008), whereas formation of pyridine N-oxide imatinib, also mediated by CYP3A4, takes place on the opposite side of the imatinib molecule (Rochat et al., 2008). Thus, these metabolites have good access to the active site of CYP3A4, and although they were unable to cause time-dependent inhibition of the enzyme in the present study, it is possible that the CYP3A4-inactivating species is formed as an intermediate in the reactions generating these metabolites (Silverman, 1995). Furthermore, the molecular structure of imatinib has several other sites susceptible to CYP3A4 oxidation, where the inactivating metabolite might be formed (Food and Drug Administration, 2001; Marull and Rochat, 2006; Rochat et al., 2008).
Despite the suggested role of CYP3A4 in imatinib biotransformation (Food and Drug Administration, 2001; Nebot et al., 2010; European Medicines Agency, 2011), the potent CYP3A4 inhibitor ketoconazole affected imatinib exposure after single dose administration in healthy volunteers only moderately (Dutreix et al., 2004), and the strong CYP3A4 inhibitor ritonavir had no effect at steady-state imatinib pharmacokinetics in GIST patients (van Erp et al., 2007). Furthermore, in CML and GIST patients, the clearance of the CYP3A4 substrates erythromycin and midazolam correlated with imatinib clearance at the beginning of imatinib therapy, but no longer at steady state (Gurney et al., 2007). Our data suggesting that imatinib is a mechanism-based inhibitor of CYP3A4 can provide an explanation for these findings; being itself a CYP3A4 substrate, imatinib is likely to inhibit its own metabolism, and thereby reduce the significance of CYP3A4 in its metabolism. Because several days of treatment may be needed before a mechanism-based inhibitor causes the maximal inhibitory effect in vivo (Lin and Lu, 1998; Zhou et al., 2007; Grime et al., 2009), the role of CYP3A4 in imatinib metabolism might be greater at the beginning of therapy than at steady state. In addition, imatinib-mediated inactivation of CYP3A4 in the enterocytes may be an explanation for the high bioavailability of imatinib.
At steady state, imatinib pharmacokinetics is likely to rely on other enzymes than CYP3A4 (van Erp et al., 2007). Interestingly, a recent study suggested significant participation by CYP2C8 in imatinib demethylation, in particular in patients with low CYP3A4 expression levels (Nebot et al., 2010). Because of the proposed role of CYP2C8 in imatinib metabolism, we also investigated, in the present study, possible inhibitory effects of imatinib on CYP2C8. According to our findings, imatinib inhibited amodiaquine N-deethylation (CYP2C8 marker reaction) with a Ki of 8.4 µM, indicating a stronger inhibition than that estimated from the manufacturers' data (Food and Drug Administration, 2001; European Medicines Agency, 2011). However, the maximal predicted imatinib-induced increase of AUC for a CYP2C8 substrate was only 9%. Thus, the CYP2C8 inhibitory effect of imatinib is likely to be of negligible clinical significance, while the importance of this enzyme in imatinib metabolism may be greater than previously estimated.
Despite the significant efficacy and favourable pharmacokinetic properties of imatinib, there is a large inter-patient variability in imatinib plasma exposure (Peng et al., 2004b; Schmidli et al., 2005; Picard et al., 2007), with cases of suboptimal response and disease progression. Factors that might be involved include mutations or amplification of the drug target, activation of alternative signalling pathways, epigenic modification, poor medication compliance and variations in cellular influx and efflux of imatinib (Mahon et al., 2003; Thomas et al., 2004; Nakanishi et al., 2006; Apperley, 2007; Goldman, 2007; Dulucq et al., 2008; Osborn and Hughes, 2010; Bixby and Talpaz, 2011). In addition, variability in CYP3A4 expression activity can partly explain the variations observed in imatinib concentrations between patients (Peng et al., 2005; Apperley, 2007). Our data indicating mechanism-based inhibition of CYP3A4 by imatinib add a new imatinib dose-dependent element to this suggestion and highlights the potential importance of other enzymes in variability in imatinib biotransformation.
In conclusion, imatinib is only a moderately potent direct inhibitor of CYP2C8 and CYP3A4, but it is a potent mechanism-based inhibitor of CYP3A4 in vitro. Our findings provide a mechanistic explanation for the interaction of imatinib with simvastatin and strongly suggest that imatinib could cause several-fold increases in the plasma concentrations of CYP3A4 substrates. Furthermore, our data indicate a high likelihood of autoinhibition of the CYP3A4-mediated metabolism of imatinib, leading to a less significant role for CYP3A4 in imatinib biotransformation than previously proposed.
Acknowledgments
This work was supported by the Helsinki University Central Hospital Research Fund and the Clinical Drug Research Graduate School (CDRGS), Finland.
Glossary
- AIC
Akaike information criterion
- AUC
area under the plasma concentration-time curve
- Cmax
peak concentration
- Cmax
portal, peak concentration in the portal vein
- CML
chronic myelogenous leukaemia
- Ctrough
trough concentration
- CYP
cytochrome P450
- fm
fraction metabolized
- fu
fraction unbound
- GIST
gastrointestinal stromal tumours
- HLM
human liver microsomes
- IC50
half maximal (50%) inhibitory concentration
- kdeg
degradation rate constant
- Ki
reversible inhibition constant
- KI
inhibitor concentration that supports half-maximal rate of inactivation
- kinact
maximal inactivation rate
- Km
Michaelis–Menten constant
- Kobs
initial inactivation rate constant
Conflicts of interest
The authors have no conflicts of interest related to the topic of the article.
References
- Alexander SPH, Mathie A, Peters JA. Guide to Receptors and Channels (GRAC), 5th Edition. Br J Pharmacol. 2011;164(Suppl. 1):S1–S324. doi: 10.1111/j.1476-5381.2011.01649_1.x. [DOI] [PMC free article] [PubMed] [Google Scholar]
- Apperley JF. Part I: mechanisms of resistance to imatinib in chronic myeloid leukaemia. Lancet Oncol. 2007;8:1018–1029. doi: 10.1016/S1470-2045(07)70342-X. [DOI] [PubMed] [Google Scholar]
- Bixby D, Talpaz M. Seeking the causes and solutions to imatinib-resistance in chronic myeloid leukemia. Leukemia. 2011;25:7–22. doi: 10.1038/leu.2010.238. [DOI] [PubMed] [Google Scholar]
- Connolly RM, Rudek MA, Garrett-Mayer E, Jeter SC, Donehower MG, Wright LA, et al. Docetaxel metabolism is not altered by imatinib: findings from an early phase study in metastatic breast cancer. Breast Cancer Res Treat. 2011;127:153–162. doi: 10.1007/s10549-011-1413-6. [DOI] [PMC free article] [PubMed] [Google Scholar]
- le Coutre P, Kreuzer KA, Pursche S, Bonin M, Leopold T, Baskaynak G, et al. Pharmacokinetics and cellular uptake of imatinib and its main metabolite CGP74588. Cancer Chemother Pharmacol. 2004;53:313–323. doi: 10.1007/s00280-003-0741-6. [DOI] [PubMed] [Google Scholar]
- Duffaud F, Le Cesne A. Imatinib in the treatment of solid tumours. Target Oncol. 2009;4:45–56. doi: 10.1007/s11523-008-0101-x. [DOI] [PubMed] [Google Scholar]
- Dulucq S, Bouchet S, Turcq B, Lippert E, Etienne G, Reiffers J, et al. Multidrug resistance gene (MDR1) polymorphisms are associated with major molecular responses to standard-dose imatinib in chronic myeloid leukemia. Blood. 2008;112:2024–2027. doi: 10.1182/blood-2008-03-147744. [DOI] [PubMed] [Google Scholar]
- Dutreix C, Peng B, Mehring G, Hayes M, Capdeville R, Pokorny R, et al. Pharmacokinetic interaction between ketoconazole and imatinib mesylate (Glivec) in healthy subjects. Cancer Chemother Pharmacol. 2004;54:290–294. doi: 10.1007/s00280-004-0832-z. [DOI] [PubMed] [Google Scholar]
- van Erp NP, Gelderblom H, Karlsson MO, Li J, Zhao M, Ouwerkerk J, et al. Influence of CYP3A4 inhibition on the steady-state pharmacokinetics of imatinib. Clin Cancer Res. 2007;13:7394–7400. doi: 10.1158/1078-0432.CCR-07-0346. [DOI] [PubMed] [Google Scholar]
- European Medicines Agency. Glivec 50 mg hard capsules. 2011. Annex I. Summary of product characteristics. URL: http://www.ema.europa.eu/docs/en_GB/document_library/EPAR_-_Product_Information/human/000406/WC500022207.pdf (last accessed September 2011)
- Food and Drug Administration. Gleevec (Imatinib Mesylate) Capsules. 2001. NDA 21-335. Clinical Pharmacology and Biopharmaceutics Review(s). URL: http://www.accessdata.fda.gov/drugsatfda_docs/nda/2001/21335_Gleevec.cfm (last accessed September 2011)
- Gertz M, Davis JD, Harrison A, Houston JB, Galetin A. Grapefruit juice-drug interaction studies as a method to assess the extent of intestinal availability: utility and limitations. Curr Drug Metab. 2008;9:785–795. doi: 10.2174/138920008786049276. [DOI] [PubMed] [Google Scholar]
- Goldman JM. How I treat chronic myeloid leukemia in the imatinib era. Blood. 2007;110:2828–2837. doi: 10.1182/blood-2007-04-038943. [DOI] [PubMed] [Google Scholar]
- Greenblatt DJ, von Moltke LL, Harmatz JS, Chen G, Weemhoff JL, Jen C, et al. Time course of recovery of cytochrome P450 3A function after single doses of grapefruit juice. Clin Pharmacol Ther. 2003;74:121–129. doi: 10.1016/S0009-9236(03)00118-8. [DOI] [PubMed] [Google Scholar]
- Grime KH, Bird J, Ferguson D, Riley RJ. Mechanism-based inhibition of cytochrome P450 enzymes: an evaluation of early decision making in vitro approaches and drug-drug interaction prediction methods. Eur J Pharm Sci. 2009;36:175–191. doi: 10.1016/j.ejps.2008.10.002. [DOI] [PubMed] [Google Scholar]
- Gschwind HP, Pfaar U, Waldmeier F, Zollinger M, Sayer C, Zbinden P, et al. Metabolism and disposition of imatinib mesylate in healthy volunteers. Drug Metab Dispos. 2005;33:1503–1512. doi: 10.1124/dmd.105.004283. [DOI] [PubMed] [Google Scholar]
- Gurney H, Wong M, Balleine RL, Rivory LP, McLachlan AJ, Hoskins JM, et al. Imatinib disposition and ABCB1 (MDR1, P-glycoprotein) genotype. Clin Pharmacol Ther. 2007;82:33–40. doi: 10.1038/sj.clpt.6100201. [DOI] [PubMed] [Google Scholar]
- Houston JB, Galetin A. Methods for predicting in vivo pharmacokinetics using data from in vitro assays. Curr Drug Metab. 2008;9:940–951. doi: 10.2174/138920008786485164. [DOI] [PubMed] [Google Scholar]
- Ito K, Iwatsubo T, Kanamitsu S, Nakajima Y, Sugiyama Y. Quantitative prediction of in vivo drug clearance and drug interactions from in vitro data on metabolism, together with binding and transport. Annu Rev Pharmacol Toxicol. 1998;38:461–499. doi: 10.1146/annurev.pharmtox.38.1.461. [DOI] [PubMed] [Google Scholar]
- Ito K, Hallifax D, Obach RS, Houston JB. Impact of parallel pathways of drug elimination and multiple cytochrome P450 involvement on drug-drug interactions: CYP2D6 paradigm. Drug Metab Dispos. 2005;33:837–844. doi: 10.1124/dmd.104.003715. [DOI] [PubMed] [Google Scholar]
- Jones DR, Hall SD. Mechanism-based inhibition of human cytochromes P450: in vitro kinetics and in vitro-in vivo correlations. In: Rodrigues AD, editor. Drug-Drug Interactions. New York: Marcel Dekker; 2002. pp. 387–413. [Google Scholar]
- Jones DR, Gorski JC, Hamman MA, Mayhew BS, Rider S, Hall SD. Diltiazem inhibition of cytochrome P-450 3A activity is due to metabolite intermediate complex formation. J Pharmacol Exp Ther. 1999;290:1116–1125. [PubMed] [Google Scholar]
- Kitz R, Wilson IB. Esters of methanesulfonic acid as irreversible inhibitors of acetylcholinesterase. J Biol Chem. 1962;237:3245–3249. [PubMed] [Google Scholar]
- Kovacsovics T, Maziarz RT. Philadelphia chromosome-positive acute lymphoblastic leukemia: impact of imatinib treatment on remission induction and allogeneic stem cell transplantation. Curr Oncol Rep. 2006;8:343–351. doi: 10.1007/s11912-006-0056-y. [DOI] [PubMed] [Google Scholar]
- Kretz O, Weiss HM, Schumacher MM, Gross G. In vitro blood distribution and plasma protein binding of the tyrosine kinase inhibitor imatinib and its active metabolite, CGP74588, in rat, mouse, dog, monkey, healthy humans and patients with acute lymphatic leukaemia. Br J Clin Pharmacol. 2004;58:212–216. doi: 10.1111/j.1365-2125.2004.02117.x. [DOI] [PMC free article] [PubMed] [Google Scholar]
- Lilja JJ, Kivistö KT, Neuvonen PJ. Grapefruit juice-simvastatin interaction: effect on serum concentrations of simvastatin, simvastatin acid, and HMG-CoA reductase inhibitors. Clin Pharmacol Ther. 1998;64:477–483. doi: 10.1016/S0009-9236(98)90130-8. [DOI] [PubMed] [Google Scholar]
- Lin JH, Lu AY. Inhibition and induction of cytochrome P450 and the clinical implications. Clin Pharmacokinet. 1998;35:361–390. doi: 10.2165/00003088-199835050-00003. [DOI] [PubMed] [Google Scholar]
- Mahon FX, Belloc F, Lagarde V, Chollet C, Moreau-Gaudry F, Reiffers J, et al. MDR1 gene overexpression confers resistance to imatinib mesylate in leukemia cell line models. Blood. 2003;101:2368–2373. doi: 10.1182/blood.V101.6.2368. [DOI] [PubMed] [Google Scholar]
- Marull M, Rochat B. Fragmentation study of imatinib and characterization of new imatinib metabolites by liquid chromatography-triple-quadrupole and linear ion trap mass spectrometers. J Mass Spectrom. 2006;41:390–404. doi: 10.1002/jms.1002. [DOI] [PubMed] [Google Scholar]
- Mayhew BS, Jones DR, Hall SD. An in vitro model for predicting in vivo inhibition of cytochrome P450 3A4 by metabolic intermediate complex formation. Drug Metab Dispos. 2000;28:1031–1037. [PubMed] [Google Scholar]
- Nakanishi T, Shiozawa K, Hassel BA, Ross DD. Complex interaction of BCRP/ABCG2 and imatinib in BCR-ABL-expressing cells: BCRP-mediated resistance to imatinib is attenuated by imatinib-induced reduction of BCRP expression. Blood. 2006;108:678–684. doi: 10.1182/blood-2005-10-4020. [DOI] [PubMed] [Google Scholar]
- Nebot N, Crettol S, d'Esposito F, Tattam B, Hibbs DE, Murray M. Participation of CYP2C8 and CYP3A4 in the N-demethylation of imatinib in human hepatic microsomes. Br J Pharmacol. 2010;161:1059–1069. doi: 10.1111/j.1476-5381.2010.00946.x. [DOI] [PMC free article] [PubMed] [Google Scholar]
- Neuvonen PJ, Kantola T, Kivistö KT. Simvastatin but not pravastatin is very susceptible to interaction with the CYP3A4 inhibitor itraconazole. Clin Pharmacol Ther. 1998;63:332–341. doi: 10.1016/S0009-9236(98)90165-5. [DOI] [PubMed] [Google Scholar]
- O'Brien SG, Meinhardt P, Bond E, Beck J, Peng B, Dutreix C, et al. Effects of imatinib mesylate (STI571, Glivec) on the pharmacokinetics of simvastatin, a cytochrome P450 3A4 substrate, in patients with chronic myeloid leukaemia. Br J Cancer. 2003;89:1855–1859. doi: 10.1038/sj.bjc.6601152. [DOI] [PMC free article] [PubMed] [Google Scholar]
- Obach RS, Walsky RL, Venkatakrishnan K, Gaman EA, Houston JB, Tremaine LM. The utility of in vitro cytochrome P450 inhibition data in the prediction of drug-drug interactions. J Pharmacol Exp Ther. 2006;316:336–348. doi: 10.1124/jpet.105.093229. [DOI] [PubMed] [Google Scholar]
- Obach RS, Walsky RL, Venkatakrishnan K. Mechanism-based inactivation of human cytochrome P450 enzymes and the prediction of drug-drug interactions. Drug Metab Dispos. 2007;35:246–255. doi: 10.1124/dmd.106.012633. [DOI] [PubMed] [Google Scholar]
- Osborn M, Hughes T. Managing imatinib resistance in chronic myeloid leukaemia. Curr Opin Hematol. 2010;17:97–103. doi: 10.1097/MOH.0b013e3283366bcb. [DOI] [PubMed] [Google Scholar]
- Peng B, Dutreix C, Mehring G, Hayes MJ, Ben-Am M, Seiberling M, et al. Absolute bioavailability of imatinib (Glivec®) orally versus intravenous infusion. J Clin Pharmacol. 2004a;44:158–162. doi: 10.1177/0091270003262101. [DOI] [PubMed] [Google Scholar]
- Peng B, Hayes M, Resta D, Racine-Poon A, Druker BJ, Talpaz M, et al. Pharmacokinetics and pharmacodynamics of imatinib in a phase I trial with chronic myeloid leukemia patients. J Clin Oncol. 2004b;22:935–942. doi: 10.1200/JCO.2004.03.050. [DOI] [PubMed] [Google Scholar]
- Peng B, Lloyd P, Schran H. Clinical pharmacokinetics of imatinib. Clin Pharmacokinet. 2005;44:879–894. doi: 10.2165/00003088-200544090-00001. [DOI] [PubMed] [Google Scholar]
- Petain A, Kattygnarath D, Azard J, Chatelut E, Delbaldo C, Geoerger B, et al. Population pharmacokinetics and pharmacogenetics of imatinib in children and adults. Clin Cancer Res. 2008;14:7102–7109. doi: 10.1158/1078-0432.CCR-08-0950. [DOI] [PubMed] [Google Scholar]
- Picard S, Titier K, Etienne G, Teilhet E, Ducint D, Bernard MA, et al. Trough imatinib plasma levels are associated with both cytogenetic and molecular responses to standard-dose imatinib in chronic myeloid leukemia. Blood. 2007;109:3496–3499. doi: 10.1182/blood-2006-07-036012. [DOI] [PubMed] [Google Scholar]
- Rochat B, Zoete V, Grosdidier A, von Grünigen S, Marull M, Michielin O. In vitro biotransformation of imatinib by the tumor expressed CYP1A1 and CYP1B1. Biopharm Drug Dispos. 2008;29:103–118. doi: 10.1002/bdd.598. [DOI] [PubMed] [Google Scholar]
- Rostami-Hodjegan A, Tucker GT. ‘In silico’ simulations to assess the ‘in vivo’ consequences of ‘in vitro’ metabolic drug–drug interactions. Drug Discov Today Tech. 2004;1:441–448. doi: 10.1016/j.ddtec.2004.10.002. [DOI] [PubMed] [Google Scholar]
- Rowland M, Matin SB. Kinetics of Drug-Drug Interactions. J Pharmacokinet Biopharm. 1973;1:553–567. [Google Scholar]
- Rowland Yeo K, Walsky RL, Jamei M, Rostami-Hodjegan A, Tucker GT. Prediction of time-dependent CYP3A4 drug-drug interactions by physiologically based pharmacokinetic modelling: impact of inactivation parameters and enzyme turnover. Eur J Pharm Sci. 2011;43:160–173. doi: 10.1016/j.ejps.2011.04.008. [DOI] [PubMed] [Google Scholar]
- Schmidli H, Peng B, Riviere GJ, Capdeville R, Hensley M, Gathmann I, et al. Population pharmacokinetics of imatinib mesylate in patients with chronic-phase chronic myeloid leukaemia: results of a phase III study. Br J Clin Pharmacol. 2005;60:35–44. doi: 10.1111/j.1365-2125.2005.02372.x. [DOI] [PMC free article] [PubMed] [Google Scholar]
- Silverman RB. Mechanism-based enzyme inactivators. Methods Enzymol. 1995;249:240–283. doi: 10.1016/0076-6879(95)49038-8. [DOI] [PubMed] [Google Scholar]
- Stegmeier F, Warmuth M, Sellers WR, Dorsch M. Targeted cancer therapies in the twenty-first century: lessons from imatinib. Clin Pharmacol Ther. 2010;87:543–552. doi: 10.1038/clpt.2009.297. [DOI] [PubMed] [Google Scholar]
- Thomas J, Wang L, Clark RE, Pirmohamed M. Active transport of imatinib into and out of cells: implications for drug resistance. Blood. 2004;104:3739–3745. doi: 10.1182/blood-2003-12-4276. [DOI] [PubMed] [Google Scholar]
- Walsky RL, Obach RS. Validated assays for human cytochrome P450 activities. Drug Metab Dispos. 2004;32:647–660. doi: 10.1124/dmd.32.6.647. [DOI] [PubMed] [Google Scholar]
- Wang Y, Zhou L, Dutreix C, Leroy E, Yin Q, Sethuraman V, et al. Effects of imatinib (Glivec) on the pharmacokinetics of metoprolol, a CYP2D6 substrate, in Chinese patients with chronic myelogenous leukaemia. Br J Clin Pharmacol. 2008;65:885–892. doi: 10.1111/j.1365-2125.2008.03150.x. [DOI] [PMC free article] [PubMed] [Google Scholar]
- Wang YH, Jones DR, Hall SD. Prediction of cytochrome P450 3A inhibition by verapamil enantiomers and their metabolites. Drug Metab Dispos. 2004;32:259–266. doi: 10.1124/dmd.32.2.259. [DOI] [PubMed] [Google Scholar]
- Yang J, Liao M, Shou M, Jamei M, Rowland Yeo K, Tucker GT, et al. Cytochrome P450 turnover: regulation of synthesis and degradation, methods for determining rates, and implications for the prediction of drug interactions. Curr Drug Metab. 2008;9:384–393. doi: 10.2174/138920008784746382. [DOI] [PubMed] [Google Scholar]
- Zhou SF, Xue CC, Yu XQ, Li C, Wang G. Clinically important drug interactions potentially involving mechanism-based inhibition of cytochrome P450 3A4 and the role of therapeutic drug monitoring. Ther Drug Monit. 2007;29:687–710. doi: 10.1097/FTD.0b013e31815c16f5. [DOI] [PubMed] [Google Scholar]