

Abstract
BACKGROUND AND PURPOSE
We have investigated how pre-incubating hCB2 CHO cells with the CB2 receptor antagonists/inverse agonists, AM630 and SR144528, affects how these and other ligands target hCB2 receptors in these cells or their membranes.
EXPERIMENTAL APPROACH
We tested the ability of AM630, SR144528 and of the CB1/CB2 receptor agonists, CP55940 and R-(+)-WIN55212, to modulate forskolin-stimulated cAMP production in hCB2 CHO cells or [35S]-GTPγS binding to membranes prepared from these cells, or to displace [3H]-CP55940 from whole cells and membranes. Assays were also performed with the CB2 receptor partial agonist, Δ9-tetrahydrocannabivarin. Some cells were pre-incubated with AM630 or SR144528 and then washed extensively.
KEY RESULTS
AM630 behaved as a low-potency neutral competitive antagonist in AM630-pre-incubated cells, a low-potency agonist in SR144528-pre-incubated cells, and a much higher-potency inverse agonist/antagonist in vehicle-pre-incubated cells. AM630 pre-incubation (i) reduced the inverse efficacy of SR144528 without abolishing it; (ii) increased the efficacy of Δ9-tetrahydrocannabivarin; and (iii) did not affect the potency with which AM630 displaced [3H]-CP55940 from whole cells or its inverse agonist potency and efficacy in the [35S]-GTPγS membrane assay.
CONCLUSIONS AND IMPLICATIONS
These results suggest that AM630 is a protean ligand that can target a constitutively active form of the hCB2 receptor (R*) with low affinity to produce agonism or neutral antagonism and a constitutively inactive form of this receptor (R) with much higher affinity to produce inverse agonism, and that the constitutive activity of whole cells is decreased less by pre-incubation with AM630 than with the higher-efficacy inverse agonist, SR144528.
LINKED ARTICLES
This article is part of a themed section on Cannabinoids in Biology and Medicine. To view the other articles in this section visit http://dx.doi.org/10.1111/bph.2012.165.issue-8. To view Part I of Cannabinoids in Biology and Medicine visit http://dx.doi.org/10.1111/bph.2011.163.issue-7
Keywords: cannabinoid CB2 receptor, AM630, SR144528, CP55940, Δ9-tetrahydrocannabivarin, R-(+)-WIN55212, inverse agonism, neutral antagonism, two-state model of agonism and inverse agonism, protean ligand
Introduction
Several years ago, we obtained the first evidence that 6-iodopravadoline (AM630) is a human cannabinoid CB2 receptor inverse agonist/antagonist (Ross et al., 1999a). More specifically, we found that AM630 displays significant potency in displacing [3H]-CP55940 from specific binding sites present in membranes obtained from CHO cells stably transfected with human cannabinoid CB2 receptors (hCB2 CHO cells; receptor nomenclature follows Alexander et al., 2011). By itself, AM630 behaved as a cannabinoid CB2 receptor inverse agonist, as indicated by its ability both to enhance forskolin-stimulated cAMP production by hCB2 CHO cells and to inhibit [35S]-GTPγS binding to membranes prepared from these cells. As expected for an inverse agonist/antagonist, AM630 produced both a vertical and a dextral shift in the log concentration–response curve of CP55940, an established cannabinoid CB1/CB2 receptor agonist that possesses relatively high intrinsic efficacy as a cannabinoid CB2 receptor agonist (reviewed in Howlett et al., 2002; Pertwee, 2005; Pertwee et al., 2010), when the measured response was CP55940-induced inhibition of forskolin-stimulated cAMP production by hCB2 CHO cells. More recently, Mancini et al. (2009) discovered that the ability of AM630 to enhance forskolin-stimulated cAMP production by hCB2 CHO cells could be prevented by a protocol that involved pre-incubating such cells with AM630 for 24 h and subsequent extensive washing of these cells. This protocol did not affect the potency or intrinsic efficacy of CP55940 to inhibit forskolin-stimulated cAMP production by these cells. The data they obtained make it likely first, that such pre-incubation reduces the constitutive activity of hCB2 receptors in CHO cells, and second, that as a result of this reduction, AM630 would most likely behave as a neutral hCB2 receptor antagonist that produces dextral but not vertical shifts in the log concentration–response curves of cannabinoid CB2 receptor agonists in AM630-preincubated hCB2 CHO cells. However, whether AM630 produces this antagonistic effect after AM630 pre-incubation was not investigated by Mancini et al. (2009).
In the present investigation, we explored this possibility, the results we obtained suggest that AM630 does indeed behave as a neutral hCB2 receptor antagonist of CP55940 in the cAMP assay performed with AM630-pre-incubated hCB2 CHO whole cells, albeit with a rather low potency. This initial finding prompted additional experiments directed at establishing whether (i) AM630 pre-incubation can reduce or abolish the ability of a second CB2 receptor inverse agonist, SR144528, to produce signs of inverse agonism in the cAMP assay performed with hCB2 CHO whole cells; (ii) AM630 displays equal potency as an apparent neutral CB2 receptor antagonist against Δ9-tetrahydrocannabivarin (Δ9-THCV) and R-(+)-WIN55212 as against CP55940 in hCB2 CHO cells pre-incubated with AM630; (iii) pre-incubation of hCB2 CHO whole cells with AM630 converts this compound into an apparent neutral antagonist in the [35S]-GTPγS binding assay, an assay that is performed with cell membranes rather than with intact whole cells; (iv) pre-incubation with SR144528 instead of AM630 also affects the manner in which AM630 targets hCB2 CHO whole cells in the cAMP assay; and (v) AM630 pre-incubation alters the number of CB2 receptors present in the hCB2 CHO cells used in this investigation, or in their membranes. SR144528 is a cannabinoid CB2 receptor-selective antagonist/inverse agonist with a chemical structure different from that of AM630 and displays higher inverse intrinsic efficacy than AM630 (Ross et al., 1999b; Howlett et al., 2002). Δ9-THCV is a plant cannabinoid that we have reported previously to activate cannabinoid CB2 receptors with a lower intrinsic efficacy than CP55940 (Bolognini et al., 2010b), whereas R-(+)-WIN55212 is a cannabinoid CB1/CB2 receptor agonist that displays similar intrinsic efficacy to CP55940 at the cannabinoid CB2 receptor but, unlike CP55940 and Δ9-THCV, is an aminoalkylindole and hence a member of the same class of chemicals as AM630 (Howlett et al., 2002; Pertwee, 2005; Pertwee et al., 2010). Some of the results described in this paper have been presented to the International Cannabinoid Research Society (Bolognini et al., 2010a).
Methods
CHO cells
CHO cells stably transfected with cDNA encoding human cannabinoid CB2 receptors (Bmax= 215 pmol·mg−1) were purchased from PerkinElmer Life Sciences Inc. (Boston, MA, USA). They were maintained at 37°C in 5% CO2 in Dulbecco's modified Eagles's medium nutrient mixture F-12 HAM, supplemented with 1 mM L-glutamine, 10% fetal bovine serum, 0.6% penicillin–streptomycin and 400 µg·mL−1 G418. These hCB2 CHO cells were passaged twice weekly using PBS-EDTA buffer (1 mM EDTA in PBS solution).
Membrane and whole-cell preparation
Binding assays with [3H]-CP55940 or [35S]-GTPγS were performed with hCB2 CHO cell membranes, prepared as described by Ross et al., (1999a). The hCB2 CHO cells were pre-incubated in complete medium with 10 µM AM630 or vehicle (dimethyl sulphoxide) for up to 24 h and then subjected to intense washing (Mancini et al., 2009). For membrane preparation, cells were removed from flasks by scraping, centrifuged at 489× g and then frozen as a pellet at −20°C until required. Before use in a radioligand binding assay, cells were defrosted and diluted in Tris binding buffer (radioligand displacement assay) or GTPγS binding buffer ([35S]-GTPγS binding assay). Protein assays were performed using a Bio-Rad Dc kit (Bio-Rad, Hercules, CA, USA). For displacement binding assays in hCB2 CHO whole cells, on the day of the experiment cells were detached using PBS-EDTA buffer, counted, centrifuged at 113× g and the pellet resuspended in Tris binding buffer.
Radioligand displacement assay
The assays were carried out with 0.7 nM of [3H]-CP55940 and Tris binding buffer (50 mM Tris-HCl, 50 mM Tris-base, 0.1% BSA, pH 7.4) in a total assay volume of 500 µL, using the filtration procedure described previously by Ross et al., (1999a). Binding was initiated by the addition of either hCB2 CHO cell membranes (50 µg protein per well) or hCB2 CHO whole cells (31250 cells per well). All assays were performed at 37°C for 60 min before termination by the addition of ice-cold Tris binding buffer and vacuum filtration using a 24-well sampling manifold (Brandel Cell Harvester) and Brandel GF/B filters that had been soaked in wash buffer at 4°C for at least 24 h (Brandel Inc, Gaithersburg, MD, USA). Each reaction well was washed six times with a 1.2 mL aliquot of Tris binding buffer and filters were oven dried for 60 min and then placed in 5 mL of scintillation fluid (Ultima Gold XR, PerkinElmer). Radioactivity was quantified by a liquid scintillation counter (Tri-Carb 2800TR, Perkin Elmer). Specific binding was defined as the difference between the binding that occurred in the presence and absence of 1 µM unlabelled CP55940. The Bmax and Kd values of [3H]-CP55940, for AM630-pre-incubated and vehicle-pre-incubated (untreated) cells and for membranes prepared from these cells, were determined in this investigation using a saturation binding assay (Table 1).
Table 1.
Mean Kd and Bmax values of [3H]-CP55940 for its binding to specific sites determined in saturation binding experiments performed with hCB2 CHO cells or membranes prepared from these cells
| Kd± SEM (nM) | Bmax± SEM (pmol mg−1) | Kd± SEM (%)1 | Bmax± SEM (%)1 | n | |
|---|---|---|---|---|---|
| Untreated membranes | 5.19 ± 1.45 | 52.6 ± 7.25 | 100 ± 27.9 | 100 ± 13.8 | 5 |
| Pre-incubated membranes | 7.65 ± 2.28* | 96.1 ± 15.7* | 147 ± 43.9 | 183 ± 29.8 | 4 |
| Untreated cells | 3.30 ± 0.85 | 44.4 ± 4.70 | 100 ± 25.8 | 100 ± 10.6 | 6 |
| Pre-incubated cells | 4.88 ± 0.99† | 59.8 ± 5.70† | 148 ± 30.0 | 135 ± 12.8 | 6 |
These experiments were performed in hCB2 CHO cells that had been pre-incubated with 10 µM AM630 and then thoroughly washed, or in washed untreated cells, or in membranes prepared from these pre-incubated and untreated cells.
The mean Kd and Bmax values in untreated cells or in membranes prepared from these cells have been normalized to 100% (columns 4 and 5).
Symbols denote a mean Kd or Bmax value, determined in experiments with AM630-pre-incubated whole cells or with membranes obtained from these cells, that is, significantly greater than the corresponding mean Kd or Bmax value determined in experiments with untreated cells or with membranes obtained from these cells (P < 0.05; *Mann–Whitney test; †Wilcoxon matched-pairs signed rank test; see Results for further information).
Saturation binding assay
Each assay was carried out using Tris binding buffer (50 mM Tris-HCl, 50 mM Tris-base, 0.1% BSA, pH 7.4) and concentrations of [3H]-CP55940 ranging from 0.05 to 10 nM in a total assay volume of 500 µL. Binding was initiated by the addition of either hCB2 CHO cell membranes (5 µg protein per well) or hCB2 CHO whole cells (31250 cells per well). The assays were then continued using the same protocol that we used for our radioligand displacement binding assays. Specific binding was calculated, for each concentration of [3H]-CP55940, by subtracting the amount of [3H]-CP55940 bound in the presence of 1 µM of unlabelled CP55940 from the total amount of [3H]-CP55940 bound. On each day that a saturation binding experiment was performed with AM630-pre-incubated whole cells, this was accompanied by another such experiment performed with whole cells that had been pre-incubated with vehicle (untreated cells).
[35S]-GTPγS binding assay
The method used for measuring agonist-stimulated binding of [35S]-GTPγS was based on a previously described protocol (Thomas et al. 2005). The assays were carried out with GTPγS binding buffer (50 mM Tris-HCl, 50 mM Tris-base, 5 mM MgCl2, 1 mM EDTA, 100 mM NaCl, 1 mM dithiothreitol, 0.1% BSA) in the presence of [35S]-GTPγS (0.1 nM) and GDP (30 µM) in a final volume of 500 µL. Binding was initiated by the addition of [35S]-GTPγS to the wells. Nonspecific binding was measured in the presence of 30 µM GTPγS. All assays were performed at 30°C for 60 min before termination by addition of ice-cold Tris binding buffer and vacuum filtration as described for the radioligand binding assays. The radioactivity was quantified by liquid scintillation spectrometry. In all the [35S]-GTPγS binding assays we used a protein concentration of 50 µg per well of membranes obtained from either vehicle-pre-incubated (untreated) or AM630-pre-incubated hCB2 CHO cells.
cAMP assay
These assays were performed using the HitHunter cAMP assay kit according to the manufacturer's protocol. Briefly, CHO cells expressing the hCB2 receptors were detached using PBS-EDTA buffer, counted and seeded at 2 × 10⁴ cells per well in 100 µL of complete medium onto white 96-well plates and incubated at 37°C and in 5% CO2 for approximately 24 h before running the experiment. In some experiments hCB2 CHO cells were preincubated with 10 µM AM630 or vehicle (dimethyl sulphoxide) for up to 24 h and then subjected to intense washing (Mancini et al., 2009). The assays and the drug dilutions were performed in a 1:1 mixture of Dulbecco's modified Eagles's medium (DMEM) and Ham's F12 medium without phenol red (D-MEM/F-12 Media), containing 10 µM of rolipram and forskolin. Before the assay was run, the medium was discarded and cells were washed once with D-MEM/F-12 Media. Then, cells were treated with the assigned drugs (30 µL per well) and incubated for 30 min at 37°C and 5% CO2. Finally, cAMP standards, at concentrations ranging from 0.7 to 57.2 nM, and the appropriate mixture of kit components were added (as described by the manufacturer, DiscoveRx). Plates were incubated overnight at room temperature in the dark. Chemiluminescent signals were detected on a Synergy HT Multi-Mode Microplate Reader (BioTek, Winooski, VT, USA).
Materials
Δ9-THCV, extracted from Cannabis, was a gift from GW Pharmaceuticals (Porton Down, Wiltshire, UK). It was 99.4% pure and contained no detectable Δ9-tetrahydrocannabinol, cannabinol or cannabidiol. N-[(1S)-endo-1,3,3-trimethyl bicyclo [2.2.1] heptan-2-yl]-5-(4-chloro-3-methylphenyl)-1-(4-methylbenzyl)-pyrazole-3-carboxamide (SR144528) was kindly supplied by Sanofi-Aventis (Montpellier, France). [6-Iodo-2-methyl-1-[2-(4-morpholinyl)ethyl]-1H-indol-3-yl](4-methoxyphenyl)methanone (6-iodopravadoline; AM630), (–)-cis-3-[2-hydroxy-4-(1,1-dimethylheptyl)phenyl]-trans-4-(3-hydroxypropyl)cyclohexanol (CP55940) and forskolin were purchased from Tocris (Bristol, UK) and rolipram from Sigma-Aldrich (Poole, Dorset, UK). For the binding experiments, [3H]-CP55940 (174.6 Ci·mmol−1) and [35S]-GTPγS (1250 Ci·mmol−1) were obtained from PerkinElmer Life Sciences Inc. (Boston, MA, USA), GTPγS and adenosine deaminase from Roche Diagnostic (Indianapolis, IN, USA) and GDP from Sigma-Aldrich. The HitHunter cAMP assay kit was purchased from DiscoveRx (Fremont, CA, USA).
Analysis of data
Values are expressed as means and variability as SEM or as 95% confidence limits.
Agonism in the cAMP assay has been expressed as percentage inhibition of forskolin-induced cAMP production. This was calculated from the equation [(f′-b)-(f-b) x 100]/(f-b), where f, f′ and b are values of cAMP production (nM), in the presence of forskolin (f), in the presence of forskolin and the test compound (f′) and in the absence of both forskolin and the test compound (b). Agonist-induced inhibition of forskolin-stimulated cAMP production has been indicated using negative values and hence inverse agonist-induced enhancement of such stimulation has been indicated using positive values. The concentrations of the compounds under investigation that produced a 50% displacement of radioligand from specific binding sites (IC50 value) were calculated using GraphPad Prism 5.0 and the corresponding Ki values were calculated using the equation of Cheng and Prusoff (1973). Values for EC50, maximal effect (Emax) and SEM or 95% confidence limits of these values have been calculated by nonlinear regression analysis using the equation for a sigmoid concentration–response curve (GraphPad Prism 5.0). Bmax and Kd values (Table 1) were calculated from the data obtained in our saturation binding assays using a one site-specific binding equation (GraphPad Prism 5.0). The apparent dissociation constant (KB) values for antagonism of agonists by AM630 in the cAMP assay have been calculated by Schild analysis (GraphPad Prism 5.0). These KB values were calculated only from data obtained in experiments in which AM630 produced a dextral shift in the log concentration–response curve of an agonist that was indicated by (2 + 2) dose parallel line analysis to be statistically significant and not to deviate significantly from parallelism (Colquhoun, 1971; Pertwee et al., 2002). Comparisons between two sets of unpaired data were made using the Mann–Whitney test or Student's two-tailed t-test or by establishing whether or not the 95% confidence limits of two mean values overlapped. Paired data were compared using the Wilcoxon matched-pairs signed rank test. Multiple comparisons between mean values were made using one-way anova followed by Dunnett's test or by Tukey's multiple comparison test. Mean values were compared with zero by column statistics analysis using either the one-sample t-test (for some data that appeared to come from a Gaussian distribution as indicated by the D'Agostino and Pearson test or the Shapiro–Wilk normality test) or the Wilcoxon signed rank test. These statistical tests were all performed using GraphPad Prism 5.0. Differences were considered significant at P < 0.05.
Results
Effect of pre-incubation of hCB2 CHO cells with AM630 on the manner in which this compound antagonizes CP55940, Δ9-THCV and R-(+)-WIN55212 in the cAMP assay performed with hCB2 CHO whole cells
First, we obtained evidence to confirm that pre-incubation with AM630 can abolish its ability to enhance forskolin-induced stimulation of cAMP production in hCB2 CHO cells (Figure 1). By performing saturation binding experiments with [3H]-CP55940, we also obtained evidence that pre-incubation of hCB2 CHO cells with AM630 produced a slight but statistically significant increase in the number of CB2 receptors present in membranes prepared from these cells as indicated by the 1.83-fold increase in the mean Bmax of [3H]-CP55940 that occurred in response to AM630 pre-incubation (P < 0.05; Mann–Whitney test; Table 1). This increase in mean Bmax was accompanied by a 1.47-fold increase in the mean Kd value of [3H]-CP55940 that was also statistically significant (P < 0.05; Mann–Whitney test; Table 1). In addition, AM630 pre-incubation increased the mean Bmax and Kd values of [3H]-CP55940 of 1.35 and 1.48, respectively, when these were determined using hCB2 CHO whole cells (Table 1). However, in contrast to the increases that took place in the membrane experiments, the increases in Bmax and Kd values that occurred in whole cells were statistically significant only when the Wilcoxon matched-pairs signed rank test was applied to our data and not when the Mann–Whitney test was used. It was possible to use the first of these two tests to analyse our whole-cell data because, on any day that a saturation binding experiment was performed with AM630-pre-incubated whole cells, this was accompanied by another such experiment performed with untreated whole cells (Methods).
Figure 1.
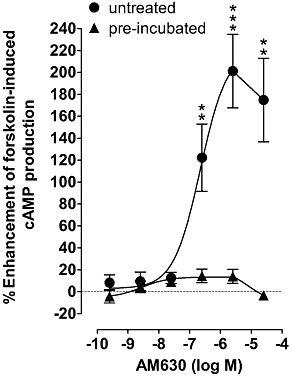
The effect of AM630 on forskolin-induced stimulation of cAMP production in CHO cells transfected with hCB2 receptors that had or had not been pre-incubated with 10 µM AM630 for 24 h. The EC50 and Emax values for AM630 in untreated cells (cells that had not been pre-incubated with AM630) with 95% confidence limits shown in parentheses are 223 nM (70 and 708 nM) and 220% (161% and 279%) respectively. Asterisks indicate any values that are significantly greater than zero (**P < 0.01; ***P < 0.001; one-sample t-test). Symbols represent mean values ± SEM (n= 8).
We also found that AM630 pre-incubation significantly increased the mean Ki values of AM630, CP55940 and Δ9-THCV by 1.9-fold, 1.6-fold and 2.2-fold, respectively, for their displacement of [3H]-CP55940 from specific binding sites in hCB2 CHO cell membranes (Table 2 and Figure 2). The mean Ki values of AM630 and CP55940 for their displacement of [3H]-CP55940 from specific binding sites in hCB2 CHO whole cells were, respectively, 1.25-fold lower and 1.1-fold higher in AM630-pre-incubated cells than in untreated cells (Table 2 and Figure 2). However, these changes were not statistically significant (P > 0.05; Mann–Whitney test).
Table 2.
Mean Ki values for the displacement of [3H]-CP55940 from specific binding sites in untreated or AM630-pre-incubated hCB2 CHO cells or in membranes obtained from these cells
| Ki (nM), untreated | 95% limits | Ki (nM), pre-incubated | 95% limits | n | ||
|---|---|---|---|---|---|---|
| Membranes | AM630 | 156 | 124 & 197 | 294** | 221 & 388 | 6 |
| CP55940 | 8.96 | 6.99 & 11.5 | 14.5* | 10.6 & 19.9 | 6 | |
| Δ9-THCV | 145 | 124 & 169 | 319** | 233 & 437 | 6 | |
| Whole cells | AM630 | 42.0 | 27.0 & 65.5 | 33.5 | 26.3 & 42.6 | 6 |
| CP55940 | 2.80 | 1.34 & 5.76 | 3.14 | 1.79 & 5.52 | 6 |
The Ki values in this Table were calculated from the data shown in Figure 2, using the Kd values listed in Table 1. Asterisks denote a mean Ki value, determined in experiments with AM630-pre-incubated whole cells or with membranes obtained from these cells, that is, significantly different from the corresponding mean Ki value determined in experiments with untreated cells or with membranes obtained from these cells (*P < 0.05; **P < 0.01; Mann–Whitney test).
Figure 2.
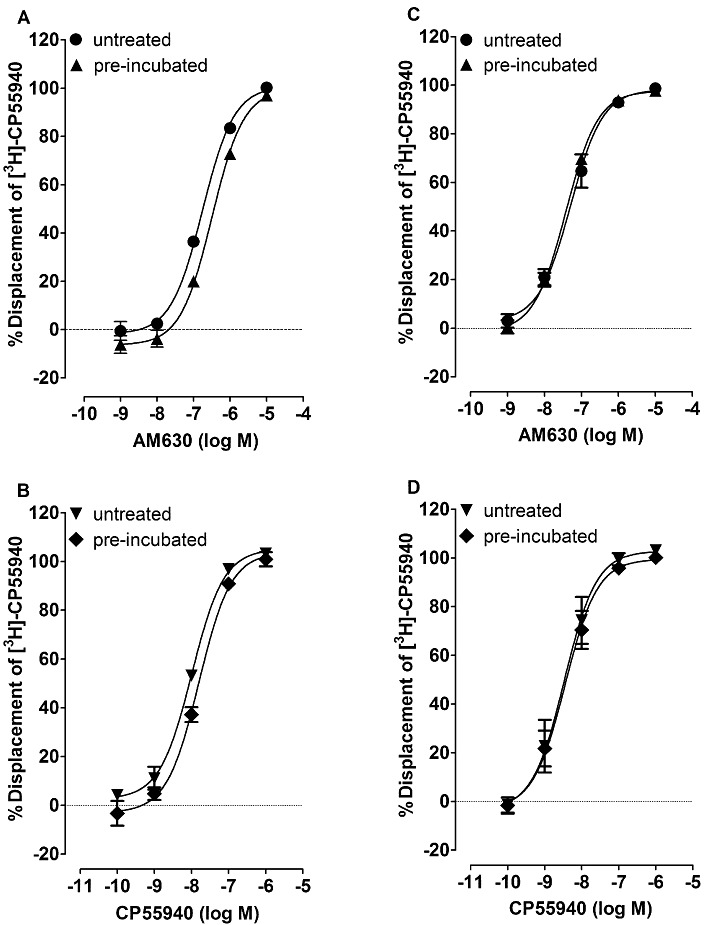
Displacement of [3H]-CP55940 by AM630 and CP55940 from specific binding sites on hCB2 CHO cell membranes (A and B) or hCB2 CHO whole cells that had or had not (untreated) been pre-incubated with 10 µM AM630 for 24 h (C and D). Membranes were obtained from either the untreated or the AM630-pre-incubated cells. Symbols represent mean values ± SEM (n= 6). Mean Ki values for displacement of [3H]-CP55940, calculated from the data shown in this Figure, can be found in Table 2.
Next, we investigated whether AM630 would behave as a neutral antagonist of CP55940 in the cAMP assay performed with AM630-pre-incubated hCB2 whole cells. AM630, at 1 µM, induced no sign of any antagonism of CP55940 in AM630-pre-incubated cells. Thus, the mean EC50 values of CP55940 were almost the same in the presence as in the absence of this concentration of AM630 (Table 3). Similar results were obtained when AM630 was given at the lower concentration of 0.1 µM (data not shown). On the other hand, 10 µM AM630 did appear to produce a slight increase in the mean EC50 of CP55940 in this bioassay. However, this apparent reduction in potency was not statistically significant, as indicated by the overlapping 95% confidence limits of the mean EC50 values of CP55940 determined in the absence and presence of 10 µM AM630 (Table 3). In contrast, 25 µM AM630 did appear to produce a significant increase in the EC50 value of CP55940, as indicated by the lack of overlap of the 95% confidence limits of the mean EC50 values of CP55940 determined in the absence and presence of AM630 (Table 3). Further support for this conclusion comes from our finding that the parallel dextral shift in the log concentration–response curve of CP55940 produced by this concentration of AM630 in AM630-pre-incubated cells is statistically significant (Figure 3). This dextral shift was not accompanied by any upward shift of this curve, suggesting that this antagonism was neutral rather than inverse in nature. The mean apparent KB value of AM630 for this apparent neutral antagonism (Table 4) was significantly greater than its mean Ki value for the displacement of [3H]-CP55940 from specific binding sites in these pre-incubated cells (135-fold; Table 2), as indicated by a lack of overlap in the 95% confidence limits of these values. As expected, we found that in untreated cells, 25 µM AM630 produced an upward as well as a dextral shift in the log concentration–response curve of this cannabinoid receptor agonist (Figure 3).
Table 3.
Effect of AM630 on the EC50 values of CP55940 for its inhibition of forskolin-induced stimulation of cAMP production by hCB2 CHO cells that had all been pre-incubated with either vehicle or 10 µM AM630
| Vehicle or AM630 | EC50 of CP55940 (nM) | 95% confidence limits (nM) |
|---|---|---|
| Vehicle | 10.2 | 7.0 & 14.8 |
| 1 µM AM630 | 9.5 | 6.9 & 13.1 |
| Vehicle | 13.8 | 9.1 & 20.9 |
| 10 µM AM630 | 28.7 | 19.4 & 42.5 |
| Vehicle | 14.4 | 10.2 & 20.3 |
| 25 µM AM630 | 107 | 72.4 & 159 |
Experiments with each concentration of AM630 were performed in parallel with a different set of control experiments in which dimethyl sulphoxide (vehicle) was administered instead of 1, 10 or 25 µM AM630 (n= 6).
Figure 3.

The effect of 25 µM AM630 on the mean log concentration–response curves of CP55940, Δ9-THCV and R-(+)-WIN55212 for inhibition of forskolin-induced stimulation of cAMP production in CHO cells transfected with hCB2 receptors that had not been (A, B and C; n= 8 or 9) or had been (D, E and F; n= 6) pre-incubated with 10 µM AM630 for 24 h. Mean Emax values for enhancement of cAMP production in the presence of 25 µM AM630 with their 95% confidence limits shown in parentheses are 228% (179% and 276%), 186% (154% and 217%) and 221% (193% and 250%) in (A), (B) and (C), respectively. These three mean values did not deviate significantly from each other (P > 0.05; anova followed by Tukey's multiple comparison test). Mean Emax values for inhibition of forskolin-induced stimulation of cAMP production determined in the absence of 25 µM AM630 were significantly less in untreated cells than in AM630-pre-incubated cells for Δ9-THCV (P < 0.001) but not for CP55940 or R-(+)-WIN55212 (unpaired t-test). These values with their 95% confidence limits shown in parentheses were −41.4% (−29.6% and −53.2%) and −81.7% (−72.1% and −91.2%), respectively, for Δ9-THCV (B and E). The corresponding values for CP55940 (A and D) were −90.9% (−81.6% and −100.2%) and −93.3% (−87.3% and −99.3%), respectively, and for R-(+)-WIN55212 (C and F), −80.3% (−65.7% and −94.9%) and −92.6% (−83.4% and −101.9%), respectively. The dextral shifts shown in (D), (E) and (F) are statistically significant and do not deviate significantly from parallelism [(2 + 2) dose parallel line analysis]. Mean apparent KB values of AM630 for its apparent competitive antagonism of CP55940, Δ9-THCV and R-(+)-WIN55212 in AM630-pre-incubated cells, calculated from the data in (D), (E) and (F), can be found in Table 4. Asterisks indicate any values in (A), (B) and (C) that are significantly greater than zero (*P < 0.05; **P < 0.01; ***P < 0.001; one-sample t-test). Symbols represent mean values ± SEM.
Table 4.
Mean apparent KB values of AM630 for its antagonism at 25 µM of the inhibition by CP55940, Δ9-THCV or R-(+)-WIN55212 of forskolin-induced stimulation of cAMP production in AM630-pre-incubated hCB2 CHO cells
| Agonist | Mean apparent KB (µM) | 95% confidence limits (µM) | n |
|---|---|---|---|
| CP55940 | 5.65 | 3.58 & 8.93 | 6 |
| Δ9-THCV | 2.17 | 1.15 & 4.09 | 6 |
| R-(+)-WIN55212 | 5.71 | 2.78 & 11.7 | 6 |
The mean log (pA2) values of the apparent KB values shown in this Table were not significantly different from each other (P > 0.05; anova followed by Tukey's multiple comparison test).
As reported by Mancini et al. (2009), we found that the mean EC50 and Emax values of CP55940 for its inhibition of forskolin-induced stimulation of cAMP production in the absence of AM630 by cells that had been pre-incubated with AM630 (Figure 3) did not differ from the corresponding values determined in experiments performed in untreated cells, as indicated by their overlapping 95% confidence limits. The mean EC50 values of CP55940 obtained in these experiments with their 95% confidence limits shown in parentheses were 11.6 nM (6.5 and 20.7 nM; n= 8) in untreated cells and 14.4 nM (10.2 and 20.3 nM; n= 6) in AM630-pre-incubated cells. The corresponding Emax values of CP55940 can be found in the legend to Figure 3.
As found in our experiments with CP55940, AM630 at 25 µM produced an upward as well as a dextral shift in the log concentration–response curves of both R-(+)-WIN55212 and the cannabinoid CB2 receptor partial agonist, Δ9-THCV, in untreated cells but only a dextral shift in those curves that did not deviate significantly from parallelism in AM630-pre-incubated cells (Figure 3). We found that at this concentration, AM630 enhanced forskolin-induced stimulation of cAMP production by hCB2 CHO cells to a similar extent in the presence and absence 1 nM CP55940, 10 nM Δ9-THCV or 1 nM R-(+)-WIN55212, concentrations that by themselves lacked detectable agonistic activity in this assay. The mean enhancement induced by 25 µM AM630 in the cAMP assay was 175 ± 38% when it was administered by itself (Figure 1), and 210 ± 50%, 190 ± 33% and 245 ± 29%, respectively, in the presence of 1 nM CP55940, 10 nM Δ9-THCV and 1 nM R-(+)-WIN55212 (Figure 3). None of these mean values differed significantly from each other (P > 0.05; anova followed by Tukey's multiple comparison test). This concentration of AM630 also induced similar maximal upward shifts in the log concentration–response curves of CP55940, Δ9-THCV and R-(+)-WIN55212 in untreated cells (see Emax values in the legend to Figure 3). However, unlike CP55940 or R-(+)-WIN55212, Δ9-THCV displayed a mean Emax value that was significantly greater in vehicle-treated AM630-pre-incubated cells than in cells pre-incubated and treated with vehicle (Figure 3). In contrast, the apparent KB values of AM630 for its apparent neutral competitive antagonism of CP55940, Δ9-THCV and R-(+)-WIN55212 in AM630 pre-incubated hCB2 CHO cells were not significantly different (Table 4). Furthermore, as found in our CP55940 experiments, the mean EC50 values of both Δ9-THCV and R-(+)-WIN55212 for inhibition of forskolin-induced stimulation of cAMP production by vehicle-treated hCB2 CHO cells (Figure 3) were not significantly affected by AM630 pre-incubation, as indicated by their overlapping 95% confidence limits. These mean EC50 values of Δ9-THCV and R-(+)-WIN55212, with their 95% confidence limits shown in parentheses, were 143 nM (26 and 777 nM) and 16.6 nM (6.2 and 45.1 nM), respectively, in untreated cells and 266 nM (148 and 478 nM) and 15.7 nM (9.0 and 27.7 nM), respectively, in the pre-incubated cells.
Effect of pre-incubation of hCB2 CHO cells with AM630 on the ability of SR144528 to behave as an inverse agonist in the cAMP assay performed with hCB2 CHO whole cells
The AM630 pre-incubation protocol that seemed to abolish entirely the ability of this compound to behave as an inverse agonist did not completely prevent SR144528 from inducing signs of inverse agonism in hCB2 CHO cells (Figure 4A). Thus, the ability of SR144528 to enhance forskolin-induced stimulation of cAMP production by hCB2 CHO cells was reduced but not abolished by AM630 pre-incubation. Moreover, SR144528 at both 100 nM and 25 µM still produced statistically significant upward shifts in the log concentration–response curve of CP55940 for its inhibition of forskolin-induced stimulation of cAMP production (Figure 4B). The mean inverse Emax of SR144528 (legend to Figure 4) was significantly greater than the mean inverse Emax of AM630 (legend to Figure 1) in untreated cells (P < 0.001; unpaired t-test).
Figure 4.
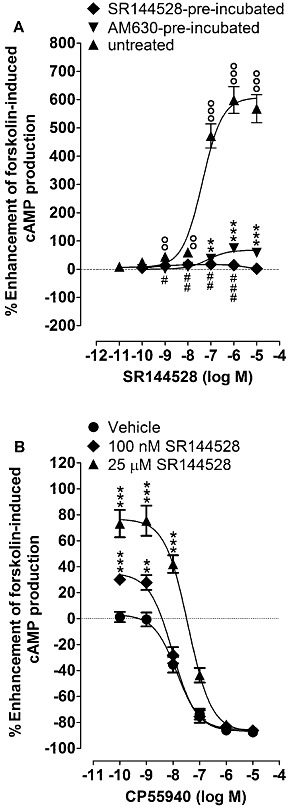
(A) Enhancement by SR144528 of forskolin-induced stimulation of cAMP production in CHO cells transfected with hCB2 receptors that had or had not been pre-incubated with 10 µM AM630 or 10 µM SR144528 for 24 h (n= 8). Mean Emax values for this enhancement with 95% confidence limits shown in parentheses are 608% (554% and 661%) in vehicle-pre-incubated (untreated) cells, 67.6% (58.3% and 76.8%) in AM630-pre-incubated cells and 16.1% (12.2% and 20.0%) in SR144528-pre-incubated cells. The corresponding mean EC50 values are 42.0 nM (23.7 and 74.7 nM), 72.4 nM (31.3 and 167.7 nM) and 0.46 nM (0.02 and 14.0 nM), respectively. (B) The effects of 100 nM and 25 µM SR144528 on the mean log concentration–response curve of CP55940 for inhibition of forskolin-induced stimulation of cAMP production in CHO cells transfected with hCB2 receptors that had been pre-incubated with 10 µM AM630 for 24 h (n= 8 or 9). In both panels, symbols represent mean values ± SEM, and values that are significantly greater than zero (one-sample t-test) are indicated by °°P < 0.01 or °°°P < 0.001 for untreated cells, by **P < 0.01 or ***P < 0.001 for AM630-pre-incubated cells and by #P < 0.05, ##P < 0.01 or ###P < 0.001 for SR144528-pre-incubated cells.
Effect of pre-incubation of hCB2 CHO cells with AM630 on the manner in which it antagonizes CP55940 in the [35S]-GTPγS binding assay performed with hCB2 CHO cell membranes
Pre-incubation with AM630 did not reduce its ability to behave as an inverse agonist in the [35S]-GTPγS binding assay. Thus, neither its mean EC50 value nor its mean Emax value for inhibition of [35S]-GTPγS binding to hCB2 CHO cell membranes changed significantly when these membranes were prepared from AM630-pre-incubated cells instead of from untreated cells, as indicated by the overlapping 95% confidence limits both of the two mean EC50 values and of the corresponding pair of mean Emax values (Figure 5). Not unexpectedly, therefore, in the same assay AM630 at 25 µM produced a downward as well as a dextral shift in the log concentration–response curve of CP55940 in membranes prepared from AM630-pre-incubated cells (Figure 5).
Figure 5.

(A) The inhibitory effect of AM630 on [35S]-GTPγS binding to membranes obtained from CHO cells transfected with hCB2 receptors that had or had not been pre-incubated with 10 µM AM630 for 24 h (n= 8). Mean Emax values for this inhibition with 95% confidence limits shown in parentheses are −41.7% (−36.8% and −46.7%) in untreated cells and −51.3% (−44.9% and −57.6%) in pre-incubated cells. The corresponding EC50 values of AM630 are 376 nM (210 and 674 nM) and 335 nM (175 and 641 nM), respectively. (B) The effect of 25 µM AM630 on the mean log concentration–response curve of CP55940 for stimulation of [35S]-GTPγS binding to membranes obtained from CHO cells transfected with hCB2 receptors that had been pre-incubated with 10 µM AM630 for 24 h (n= 8). In both panels, symbols represent mean values ± SEM and asterisks indicate values that are significantly less than zero (*P < 0.05; ***P < 0.001; one-sample t-test).
Effects of pre-incubation of hCB2 CHO cells with SR144528
Pre-incubation with 10 µM SR144528 greatly reduced its ability to enhance forskolin-induced stimulation of cAMP production by hCB2 CHO cells (Figure 4A), to the extent that the inverse Emax of SR144528 in this bioassay was significantly less after this pre-incubation procedure than after pre-incubation with 10 µM AM630 (P < 0.001; unpaired t-test). Pre-incubation with 10 µM SR144528 also increased the stimulant effect of 10 µM forskolin on cAMP production by hCB2 CHO cells, as did pre-incubation of hCB2 CHO cells with 10 µM AM630, as reported previously by Mancini et al. (2009). Thus, in the presence of forskolin, the mean concentration of cAMP in vehicle-pre-incubated cells was 16.8 ± 2.2 nM, and this value rose significantly to 26.2 ± 2.1 nM (P < 0.05) in AM630-pre-incubated cells and to 34.7 ± 2.0 nM (P < 0.001) in SR144528 pre-incubated cells (anova followed by Tukey's multiple comparison test; n= 6). The latter two mean values also differ significantly from each other (P < 0.05). Additionally, we found that after pre-incubation of the cells with 10 µM SR144528, AM630 behaved as a low-potency CB2 receptor agonist, as indicated by its ability to produce significant inhibition of forskolin-induced cAMP production at 25 and 50 µM, although not at 2.5 µM or less (Figure 6).
Figure 6.
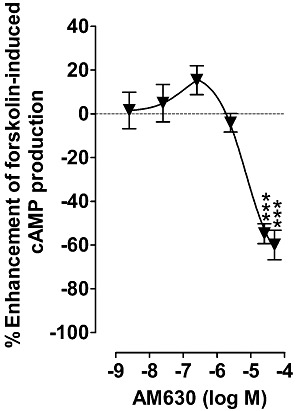
The effect of AM630 on forskolin-induced stimulation of cAMP production in CHO cells transfected with hCB2 receptors that had been pre-incubated with 10 µM SR144528 for 24 h. Asterisks indicate any values that are significantly less than zero (***P < 0.001; one-sample t-test). Symbols represent mean values ± SEM (n= 8).
Discussion
As has been reported previously (Ross et al., 1999a; Mancini et al., 2009; Scandroglio et al., 2010), we found AM630 to behave as a cannabinoid CB2 receptor inverse agonist in vitro. Thus, it inhibited [35S]-GTPγS binding to membranes prepared from hCB2 CHO cells, enhanced forskolin-induced stimulation of cAMP production by these cells and produced vertical shifts in the log concentration–response curves of the cannabinoid CB2 receptor agonists, CP55940, Δ9-THCV and R-(+)-WIN55212. We also confirmed that pre-incubation of hCB2 CHO cells with AM630 abolishes the ability of this compound to induce these signs of inverse agonism in whole cells without affecting the potency with which CP55940 inhibits forskolin-induced stimulation of cAMP production by these cells (Mancini et al., 2009). Similar results were obtained in experiments with Δ9-THCV and R-(+)-WIN55212. In addition, the results we obtained from our binding experiments with [3H]-CP55940 suggest that pre-incubation of hCB2 CHO whole cells with AM630 induced (i) a slight but significant reduction in the affinity of AM630, CP55940 and Δ9-THCV for hCB2 CHO cell membranes, as indicated by increases in their Ki values for their displacement of [3H]-CP55940 and by a rise in the Kd value of this radioligand determined in saturation binding experiments; (ii) a similar increase in the Kd of [3H]-CP55940, although not in the Ki values of CP55940 or AM630, for binding to hCB2 CHO whole cells, and (iii) a slight but significant increase in the number of CB2 receptors to which [3H]-CP55940 can bind specifically both in whole cells and in membranes prepared from such cells. Identification of the mechanism(s) through which AM630 pre-incubation produces such changes in affinity and receptor number warrants further investigation.
Although pre-incubation of hCB2 CHO cells with AM630 reduced the affinity of CP55940, AM630 and Δ9-THCV for CB2 receptors in membranes prepared from these cells, slightly increased the number of CB2 receptors in these membranes, and abolished the ability of AM630 to behave as an inverse agonist in the cAMP assay performed with whole cells, this pre-incubation did not produce any detectable reduction in the ability of AM630 to induce signs of inverse agonism in the [35S]-GTPγS assay, performed with hCB2 CHO cell membranes (Figure 5). The reason for this difference remains to be established and so will require further research, just one of several possibilities being that this finding is an indication that the degree and/or nature of CB2 receptor constitutive activity differs between the signalling pathways that function in our membrane assay and those that operate in our whole-cell assay. It is also possible that in our whole-cell assays, the cannabinoids we investigated targeted mainly CB2 receptors located on the cell surface, whereas in the [35S]-GTPγS binding assay the cell membrane preparation we used may also have contained active CB2 receptors derived from intracellular storage sites. Thus, the presence of functional intracellular GPCRs has been detected in previous investigations (Gobeil et al., 2006). Moreover, Rozenfeld and Devi (2008) have detected the presence of functional CB1 receptors in intracellular endosomal/lysosomal compartments, where they are associated with the subunit Gαi. However, whether any active receptors are stored intracellularly in our hCB2-transfected CHO cells remains to be established.
Data we obtained in the cAMP assay performed with hCB2 CHO cells suggest that pre-incubation with AM630 caused it to behave as a neutral hCB2 receptor antagonist, as indicated by an apparent loss of its ability to induce upward shifts in the log concentration–response curves of CP55940, Δ9-THCV and R-(+)-WIN55212 and by a retention of its ability to produce a statistically significant dextral shift in each of these curves. This antagonism is most likely competitive in nature, as these dextral shifts did not deviate significantly from parallelism and were not associated with any change in the Emax of any of these agonists (Figure 3). There were no statistically significant differences between the mean apparent KB values of AM630 for its antagonism of CP55940, Δ9-THCV and R-(+)-WIN55212 in AM630-pre-incubated whole cells. This finding suggests that this apparent competitive antagonism was independent of agonist structure. This is consistent with the hypothesis that this antagonism resulted from competition between AM630 and each of these three agonists for the hCB2 receptors expressed by these cells because there is good evidence that all four of these compounds are cannabinoid CB2 receptor ligands (Bolognini et al., 2010b; reviewed in Howlett et al., 2002; Pertwee, 2005; Pertwee et al., 2010).
It is possible to postulate an explanation for the apparent conversion of AM630 from an inverse agonist to a neutral antagonist in terms of a model for GPCR systems that is based on the hypothesis that GPCR agonism and constitutive signalling can result, respectively, from an agonist-induced and a spontaneous shift of the receptor from an inactive to an active state (reviewed in Leff, 1995; Kenakin, 1997, 2001). This two-state model of receptor activation proposes that receptors and ion channels can exist in two interchangeable conformations: an ‘active’ form named R* (Leff, 1995) or Ra (Kenakin, 1997), in which receptors are coupled to their effector mechanisms even in the absence of an agonist and an ‘inactive’ form, named R (Leff, 1995) or Ri (Kenakin, 1997) that is not spontaneously coupled to receptor effector mechanisms. According to this model, and using the same nomenclature as Leff (1995), an equilibrium can develop between R* and R, an agonist has an R* : R affinity ratio (α) that is greater than 1, and so increases the proportion of receptors (the allosteric constant, L) in the ‘active’ state, an inverse agonist has an R* : R affinity ratio that is less than 1 and so decreases L, and a neutral antagonist has the same affinity for R* and R and so leaves the value of L unchanged. One possibility, therefore, is that (i) AM630 has less affinity for the putative R* form than for the putative R form of the CB2 receptor such that in cells that are not pre-incubated (untreated cells) it increases the proportion of receptors in the ‘inactive’ state by shifting the allosteric constant, L, towards a value x (where x = the R* : R affinity ratio, α, of AM630); (ii) AM630 pre-incubation changes L to this value x so that subsequent addition of AM630 to these cells does not produce any additional change to L and hence induces no signs of inverse agonism, or indeed, of agonism (Figure 7).
Figure 7.
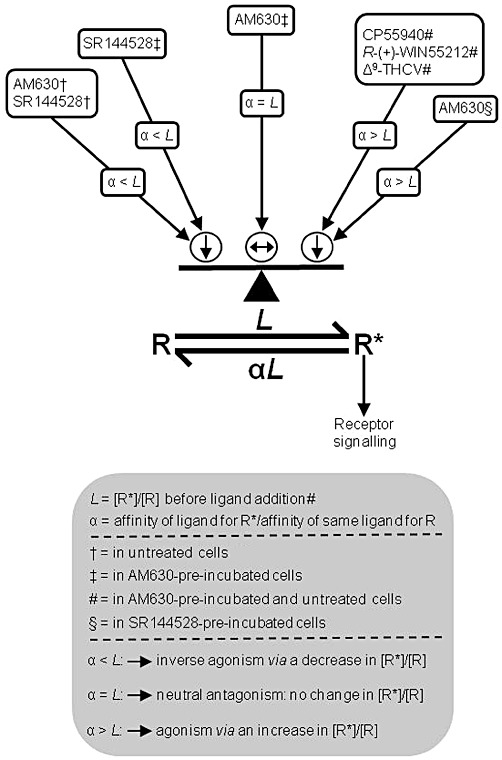
In terms of the two-state model of inverse agonism, the effects described in this paper (i) of CP55940, R-(+)-WIN55212, Δ9-THCV, AM630 and SR144528 on untreated, AM630-pre-incubated and SR144528-pre-incubated hCB2 CHO whole cells and (ii) of the pre-incubation of these cells with 10 µM AM630 or SR144528 may have depended on the relative affinities (α) of these ligands for the putative R* and R states of the CB2 receptor, and on changes induced by these ligands or by AM630- or SR144528-pre-incubation on the relative proportion of these two receptor states (allosteric constant, L) in the cells. See Discussion for further details.
Consistent with the hypothesis, that AM630 pre-incubation can increase the proportion of CB2 receptors in the ‘inactive’ state that is postulated to have higher affinity for AM630 and lower affinity for an agonist such as CP55940 than the ‘active state’, is our finding that such pre-incubation produced a 1.48-fold increase in the mean Kd of [3H]-CP55940 in hCB2 CHO whole cells (Table 1). It is likely that a GPCR can adopt numerous active state conformations capable of initiating a physiological response, creating a need for ‘multi-state’ models rather than a two-state model (reviewed in Kenakin, 2001). Moreover, another model that combines the principles of the two-state model with those of the ternary complex model of allosteric modulation has also been proposed (Hall, 2000). Even so, our data fit well with the classical two-state model and, as discussed below, our attempts to explain our findings in terms of this model prompted additional experiments that led to the discovery that AM630 may be a protean ligand for the hCB2 receptor.
Although the EC50 of AM630 for its enhancement of forskolin-induced stimulation of cAMP production by untreated hCB2 CHO cells (Figure 1) and the Ki values for its displacement of [3H]-CP55940 from specific binding sites on AM630-pre-incubated and untreated hCB2 CHO cells (Table 2) are all in the low or mid nanomolar range, the mean apparent KB values it displays as an antagonist of CP55940, Δ9-THCV and R-(+)-WIN55212 in AM630-pre-incubated cells are all in the low micromolar range and so substantially and significantly higher (Results and Table 4). Even so, this does not necessarily rule out the possibility that AM630 was competing with these agonists for CB2 receptors. Thus, for example, in terms of the two-state model of inverse agonism it can be postulated that (i) although [3H]-CP55940 has higher affinity for R* than for R, some [3H]-CP55940 molecules will bind to the putative R form of the CB2 receptor; (ii) the potency with which AM630 induces signs of CB2 receptor inverse agonism and displaces [3H]-CP55940 from the CB2 receptor is determined by its affinity for the proposed R form of the CB2 receptor; (iii) the potency with which AM630 antagonizes a CB2 receptor agonist such as CP55940 in an apparently competitive manner is determined by its affinity for the putative R* form of the CB2 receptor that, according to the two-state model, mediates the measured response to the agonist; and (iv) as already proposed, AM630 has higher affinity for the putative R form than for the putative R* form of the CB2 receptor (Figure 7). One implication of these hypotheses that merits further investigation is that the ratio of the mean apparent KB value of AM630 (Table 4) for its apparent neutral antagonism of CP55940 in AM630-pre-incubated hCB2 CHO cells to its mean Ki value (Table 2) for displacement of [3H]-CP55940 from specific binding sites on these pre-incubated cells (ratio = 135) may provide a measure of the R : R* affinity ratio of AM630.
In contrast to AM630, SR144528 retained its ability to behave as an inverse agonist in the cAMP assay performed with hCB2 CHO cells that had been pre-incubated with AM630, although the Emax for its apparent inverse agonism was significantly reduced after this pre-incubation (Figure 4). Thus, in our experiments with AM630-pre-incubated cells, SR144528 administered by itself enhanced forskolin-induced stimulation of cAMP production and, at both 100 nM and 25 µM, produced a significant upward shift in the log concentration–response curve of CP55940. It is possible that signs of inverse agonism were induced in AM630-pre-incubated cells by SR144528 but not by AM630 because the first of these ligands has greater intrinsic efficacy than the second as a CB2 receptor inverse agonist, as has been suggested previously (Ross et al., 1999b). This possibility is also supported by our findings first, that SR144528 displayed a greater Emax than AM630 as an enhancer of forskolin-stimulated cAMP production in untreated cells (Figures 1 and 4), and second, that the stimulating effect of 10 µM forskolin on cAMP production by hCB2 CHO cells was enhanced to a significantly greater extent by pre-incubation of these cells with SR144528 than with AM630. As SR144528 seems to have higher inverse CB2 receptor intrinsic efficacy than AM630, we performed experiments directed at establishing whether pre-incubating hCB2 CHO cells with 10 µM SR144528 would reduce its inverse effect in the cAMP assay to a greater extent than pre-incubation with 10 µM AM630. These experiments yielded positive results because they showed that the inverse Emax of SR144528 in this bioassay was significantly less after pre-incubation with SR144528 than after the AM630 pre-incubation (Figure 4A).
Our findings with SR144528 and AM630 prompted us to postulate that, in terms of the two-state model: (Figure 7) (i) SR144528 has greater inverse efficacy than AM630 because the ratio (α) of its affinities for the putative R* and R forms of the CB2 receptor is even less than the α-value of AM630; (ii) SR144528 still behaves as an inverse agonist in AM630- or SR144528-pre-incubated cells because, in contrast to the α-value of AM630 in such cells (see above), its α-value remains less than the ratio of the R* form to the R form of the CB2 receptor (L) and that this causes SR144528 to induce a decrease in this ratio which in turn gives rise to inverse agonism; and (iii) SR144528 displays less efficacy as an inverse agonist when hCB2 CHO cells are pre-incubated with it instead of with AM630, because pre-incubation with SR144528 induces a greater reduction in the ratio of the putative R* form to the putative R form of the CB2 receptor than pre-incubation with AM630. This third hypothesis raises the possibility that SR144528 pre-incubation might have caused the CB2 R* to R ratio to fall below the α-value of AM630 and that as a result AM630 might behave as an agonist in the cAMP assay when this is performed with SR144528-pre-incubated hCB2 CHO cells. When we tested this additional hypothesis, we found that AM630 did indeed behave in this way in such cells (Figure 6). Thus, AM630 produced significant agonism in SR144528-pre-incubated cells at 25 and 50 µM, although not at lower concentrations, displaying a potency in the cAMP assay similar to that which it displayed as an apparent CB2 receptor neutral antagonist in AM630-pre-incubated cells, as indicated by its mean apparent KB values for antagonism of CP55940, Δ9-THCV and R-(+)-WIN55212 (Table 4). That AM630 displayed similar potency as a hCB2 receptor agonist and antagonist and that this potency was relatively low is not unexpected because the two-state model predicts that both these effects of AM630 are mediated by the putative R* form of the CB2 receptor and that this R* form both mediates CB2 receptor activation and has much lower affinity for AM630 than for an established CB2 receptor such as CP55940. Clearly, additional research is required to test this hypothesis further, and also to investigate the validity of the other three hypotheses that we have proposed in this paragraph.
SR144528 produced significant upward shifts in the log concentration–response curve of CP55940 in AM630-pre-incubated cells at concentrations that induced little or no dextral shifts in this curve (Figure 4B). One possible explanation for this finding that merits further investigation is that, as a high-efficacy inverse agonist, SR144528 has much higher affinity for the putative R form of the CB2 receptor than for its putative R* form and hence is able to bind to the R form (to produce an upward shift in the log concentration–response curve of CP55940) at concentrations at which it undergoes little binding to the R* form (through which it would be expected to produce a dextral shift in this curve via competitive displacement of CP55940 from the R* form).
Finally, like CP55940 and R-(+)-WIN55212, Δ9-THCV displayed similar potency in the cAMP assay when this was performed with AM630-pre-incubated hCB2 CHO cells as when it was performed with untreated cells. However, in contrast to CP55940 and R-(+)-WIN55212, this phytocannabinoid displayed a significantly higher Emax in this assay when it was performed with AM630-pre-incubated cells rather than the untreated cells. This may have been because AM630 pre-incubation decreased the proportion of CB2 receptors in the putative ‘active’ R* state, thereby allowing Δ9-THCV, which is a partial CB2 receptor agonist, to induce a greater switch from the putative R to the putative R* state of the CB2 receptor in AM630-pre-incubated cells than in untreated cells. Importantly, Kenakin (1997) has proposed that increases in the proportion, L, of receptors in the putative ‘active’ state, R*, can produce an increase, a decrease or no change in the Emax of an agonist in a manner that (i) depends on the ratio (α) of that particular agonist's affinities for the putative R* and R forms of the CB2 receptor and hence (ii) is likely to be ligand-dependent. It is possible, therefore, that the Emax values of CP55940 and R-(+)-WIN55212 may have been unaffected by this postulated increase in L because they possess higher α-values than Δ9-THCV. It is also noteworthy that the cannabinoid receptor ligand (+)-AM1241, has been found by Mancini et al. (2009) to display agonistic activity in the cAMP assay when this is performed with AM630-pre-incubated human or rat CB2 CHO cells, but to lack such activity in these cells if they have not been pre-incubated with AM630. It is now important to establish whether AM630 pre-incubation also increases the Emax of compounds other than Δ9-THCV that behave as partial agonists in the cAMP assay.
In conclusion, this investigation has confirmed that pre-incubation of hCB2 CHO cells with AM630 can abolish the ability of this cannabinoid to produce signs of inverse CB2 receptor agonism in whole cells. In addition, it has demonstrated for the first time that AM630 can behave as a neutral competitive antagonist in AM630-pre-incubated hCB2 cells and as an agonist in SR144528-pre-incubated hCB2 cells, with potencies much lower than the potency it displays as an inverse agonist/antagonist in untreated hCB2 cells. These findings raise the possibility that like its structural analogue, AM1241, AM630 should be classified as a CB2 receptor protean ligand, because by definition such a ligand can, depending on the level of receptor constitutive activity, operate as an agonist, antagonist or inverse agonist at the same receptor (Kenakin, 2001; Yao et al., 2006; Mancini et al., 2009). We have also found that pre-incubation of hCB2 CHO cells with AM630 appears to increase the Emax of a CB2 receptor partial agonist, Δ9-THCV, for its inhibition of forskolin-stimulated cAMP production by these cells but not to alter the Emax in this bioassay of CP55940 or R-(+)-WIN55212, each of which displays higher intrinsic efficacy at the CB2 receptor than Δ9-THCV. Although an inhibitory effect of pre-incubation with AM630 on the ability of this compound to behave as an inverse agonist was detected in the cAMP assay performed with hCB2 CHO whole cells, it was not detected in the [35S]-GTPγS assay performed with membranes obtained from these cells. The reason for this difference remains to be established, one possible explanation that should be investigated further being that the degree and/or nature of CB2 constitutive activity is not the same in the signalling pathways that function in the [35S]-GTPγS assay and/or in cell membranes as in the pathways that operate in the cAMP assay and/or in whole cells. Also meriting further investigation is the extent to which any constitutive activity displayed by CB2 receptors in vivo in health or disease, firstly, can be decreased by single or repeated administration of a CB2 receptor inverse agonist such as AM630 or SR144528, and secondly, can determine whether such a compound behaves as an inverse agonist, neutral antagonist or agonist in vivo. There is a strong need for such additional research, not only because AM630 and SR144528 are widely used as CB2 receptor antagonists in cannabinoid research, but also because there is currently significant interest in the therapeutic potential of cannabinoid CB2 receptor inverse agonists for the management of disorders such as rheumatoid arthritis (reviewed in Lunn et al., 2008; Lunn, 2010).
Acknowledgments
This research was supported by grants from GW Pharmaceuticals and the National Institutes of Health (DA-03672).
Glossary
- AM630
[6-iodo-2-methyl-1-[2-(4-morpholinyl)ethyl]-1H-indol-3-yl](4-methoxyphenyl)methanone or 6-iodopravadoline
- CP55940
(–)-cis-3-[2-hydroxy-4-(1,1-dimethylheptyl)phenyl]-trans-4-(3-hydroxypropyl)cyclohexanol
- Δ9-THCV
Δ9-tetrahydrocannabivarin
- SR144528
N-[(1S)-endo-1,3,3-trimethyl bicyclo [2.2.1] heptan-2-yl]-5-(4-chloro-3-methylphenyl)-1-(4-methylbenzyl)-pyrazole-3-carboxamide
- R-(+)-WIN55212
R-(+)-[2,3-dihydro-5-methyl-3-(4-morpholinylmethyl)pyrrolo[1,2,3-de]-1,4-benzoxazin-6-yl]-1-naphthalenylmethanone mesylate
Conflict of interest
None.
References
- Alexander SPH, Mathie A, Peters JA. Guide to Receptors and Channels (GRAC), 5th Edition. Br J Pharmacol. 2011;164(Suppl. 1):S1–S324. doi: 10.1111/j.1476-5381.2011.01649_1.x. [DOI] [PMC free article] [PubMed] [Google Scholar]
- Bolognini D, Cascio MG, Ross RA, Pertwee RG. Conversion of AM630 into an apparent neutral CB2 receptor antagonist. Symposium on the Cannabinoids, International Cannabinoid Research Society; Research Triangle Park, NC, USA. 2010a. pp. P4–28. [Google Scholar]
- Bolognini D, Costa B, Maione S, Comelli F, Marini P, Di Marzo V, et al. The plant cannabinoid Δ9-tetrahydrocannabivarin can decrease signs of inflammation and inflammatory pain in mice. Br J Pharmacol. 2010b;160:677–687. doi: 10.1111/j.1476-5381.2010.00756.x. [DOI] [PMC free article] [PubMed] [Google Scholar]
- Cheng Y-C, Prusoff WH. Relationship between the inhibition constant (K1) and the concentration of inhibitor which causes 50 per cent inhibition (I50) of an enzymatic reaction. Biochem Pharmacol. 1973;22:3099–3108. doi: 10.1016/0006-2952(73)90196-2. [DOI] [PubMed] [Google Scholar]
- Colquhoun D. Lectures on Biostatistics. Oxford: Oxford Univ Press; 1971. [Google Scholar]
- Gobeil F, Fortier A, Zhu T, Bossolasco M, Leduc M, Grandbois M, et al. G-protein-coupled receptors signalling at the cell nucleus: an emerging paradigm. Can J Physiol Pharmacol. 2006;84:287–297. doi: 10.1139/y05-127. [DOI] [PubMed] [Google Scholar]
- Hall DA. Modeling the functional effects of allosteric modulators at pharmacological receptors: an extension of the two-state model of receptor activation. Mol Pharmacol. 2000;58:1412–1423. doi: 10.1124/mol.58.6.1412. [DOI] [PubMed] [Google Scholar]
- Howlett AC, Barth F, Bonner TI, Cabral G, Casellas P, Devane WA, et al. International Union of Pharmacology. XXVII. Classification of cannabinoid receptors. Pharmacol Rev. 2002;54:161–202. doi: 10.1124/pr.54.2.161. [DOI] [PubMed] [Google Scholar]
- Kenakin T. Pharmacologic Analysis of Drug-Receptor Interaction. Philadelphia, PA: Lippincott-Raven; 1997. [Google Scholar]
- Kenakin T. Inverse, protean, and ligand-selective agonism: matters of receptor conformation. FASEB J. 2001;15:598–611. doi: 10.1096/fj.00-0438rev. [DOI] [PubMed] [Google Scholar]
- Leff P. The two-state model of receptor activation. Trends Pharmacol Sci. 1995;16:89–97. doi: 10.1016/s0165-6147(00)88989-0. [DOI] [PubMed] [Google Scholar]
- Lunn CA. Updating the chemistry and biology of cannabinoid CB2 receptor-specific inverse agonists. Curr Top Med Chem. 2010;10:768–778. doi: 10.2174/156802610791164193. [DOI] [PubMed] [Google Scholar]
- Lunn CA, Reich E-P, Fine JS, Lavey B, Kozlowski JA, Hipkin RW, et al. Biology and therapeutic potential of cannabinoid CB2 receptor inverse agonists. Br J Pharmacol. 2008;153:226–239. doi: 10.1038/sj.bjp.0707480. [DOI] [PMC free article] [PubMed] [Google Scholar]
- Mancini I, Brusa R, Quadrato G, Foglia C, Scandroglio P, Silverman LS, et al. Constitutive activity of cannabinoid-2 (CB2) receptors plays an essential role in the protean agonism of (+)AM1241 and L768242. Br J Pharmacol. 2009;158:382–391. doi: 10.1111/j.1476-5381.2009.00154.x. [DOI] [PMC free article] [PubMed] [Google Scholar]
- Pertwee RG. Pharmacological actions of cannabinoids. In: Pertwee RG, editor. Cannabinoids. Heidelberg: Springer-Verlag; 2005. pp. 1–51. Handbook Exp Pharmacol 168: 1–51. [DOI] [PubMed] [Google Scholar]
- Pertwee RG, Ross RA, Craib SJ, Thomas A. (-)-Cannabidiol antagonizes cannabinoid receptor agonists and noradrenaline in the mouse vas deferens. Eur J Pharmacol. 2002;456:99–106. doi: 10.1016/s0014-2999(02)02624-9. [DOI] [PubMed] [Google Scholar]
- Pertwee RG, Howlett AC, Abood ME, Alexander SPH, Di Marzo V, Elphick MR, et al. International union of basic and clinical pharmacology. LXXIX. Cannabinoid receptors and their ligands: beyond CB1 and CB2. Pharmacol Rev. 2010;62:588–631. doi: 10.1124/pr.110.003004. [DOI] [PMC free article] [PubMed] [Google Scholar]
- Ross RA, Brockie HC, Stevenson LA, Murphy VL, Templeton F, Makriyannis A, et al. Agonist-inverse agonist characterization at CB1 and CB2 cannabinoid receptors of L759633, L759656 and AM630. Br J Pharmacol. 1999a;126:665–672. doi: 10.1038/sj.bjp.0702351. [DOI] [PMC free article] [PubMed] [Google Scholar]
- Ross RA, Gibson TM, Stevenson LA, Saha B, Crocker P, Razdan RK, et al. Structural determinants of the partial agonist-inverse agonist properties of 6′-azidohex-2′-yne-Δ8-tetrahydrocannabinol at cannabinoid receptors. Br J Pharmacol. 1999b;128:735–743. doi: 10.1038/sj.bjp.0702836. [DOI] [PMC free article] [PubMed] [Google Scholar]
- Rozenfeld R, Devi LA. Regulation of CB1 cannabinoid receptor trafficking by the adaptor protein AP-3. FASEB J. 2008;22:2311–2322. doi: 10.1096/fj.07-102731. [DOI] [PMC free article] [PubMed] [Google Scholar]
- Scandroglio P, Brusa R, Lozza G, Mancini I, Petro R, Reggiani A, et al. Evaluation of cannabinoid receptor 2 and metabotropic glutamate receptor 1 functional responses using a cell impedance-based technology. J Biomol Screen. 2010;15:1238–1247. doi: 10.1177/1087057110375615. [DOI] [PubMed] [Google Scholar]
- Thomas A, Stevenson LA, Wease KN, Price MR, Baillie G, Ross RA, et al. Evidence that the plant cannabinoid Δ9-tetrahydrocannabivarin is a cannabinoid CB1 and CB2 receptor antagonist. Br J Pharmacol. 2005;146:917–926. doi: 10.1038/sj.bjp.0706414. [DOI] [PMC free article] [PubMed] [Google Scholar]
- Yao BB, Mukherjee S, Fan Y, Garrison TR, Daza AV, Grayson GK, et al. In vitro pharmacological characterization of AM1241: a protean agonist at the cannabinoid CB2 receptor? Br J Pharmacol. 2006;149:145–154. doi: 10.1038/sj.bjp.0706838. [DOI] [PMC free article] [PubMed] [Google Scholar]