

Abstract
BACKGROUND AND PURPOSE
The G protein-coupled receptor 119 (GPR119) mediates insulin secretion from pancreatic β cells and glucagon-like peptide 1 (GLP-1) release from intestinal L cells. While GPR119-mediated insulin secretion is glucose dependent, it is not clear whether or not GPR119-mediated GLP-1 secretion similarly requires glucose. This study was designed to address the glucose-dependence of GPR119-mediated GLP-1 secretion, and to explore the cellular mechanisms of hormone secretion in L cells versus those in β cells.
EXPERIMENTAL APPROACH
GLP-1 secretion in response to GPR119 agonists and ion channel modulators, with and without glucose, was analysed in the intestinal L cell line GLUTag, in primary intestinal cell cultures and in vivo. Insulin secretion from Min6 cells, a pancreatic β cell line, was analysed for comparison.
KEY RESULTS
In GLUTag cells, GPR119 agonists stimulated GLP-1 secretion both in the presence and in the absence of glucose. In primary mouse colon cultures, GPR119 agonists stimulated GLP-1 secretion under glucose-free conditions. Moreover, a GPR119 agonist increased plasma GLP-1 in mice without a glucose load. However, in Min6 cells, GPR119-mediated insulin secretion was glucose-dependent. Among the pharmacological agents tested in this study, nitrendipine, an L-type voltage-dependent calcium channel blocker, dose-dependently reduced GLP-1 secretion from GLUTag cells, but had no effect in Min6 cells in the absence of glucose.
CONCLUSIONS AND IMPLICATIONS
Unlike that in pancreatic β cells, GPR119-mediated GLP-1 secretion from intestinal L cells was glucose-independent in vitro and in vivo, probably because of a higher basal calcium tone in the L cells.
Keywords: GPR119, GLP-1, insulin, glucose, cAMP, calcium influx
Introduction
Type 2 diabetes results from a combination of insulin resistance and β cell dysfunction as represented by an inability of β cells to release a sufficient amount of insulin to compensate for insulin resistance. Incretins, especially glucagon-like peptide 1 (GLP-1) secreted by intestinal L cells, stimulate insulin secretion in a glucose-dependent manner. The incretin effect is thought to account for at least 50% of postprandial insulin secretion in healthy human subjects (Drucker, 2006), but is markedly reduced in type 2 diabetics due, at least in part, to a deficiency in meal-induced GLP-1 release. Pharmacological GLP-1 analogues have been approved for the treatment of type 2 diabetes. Whilst much research effort had been directed towards understanding the mechanisms of action of GLP-1 and GLP-1 analogues on pancreatic β cells, the cellular mechanisms of endogenous GLP-1 secretion from intestinal L cells were less well defined (Tolhurst et al., 2009). Several studies suggested that the hormone-secretion machinery of intestinal L cells shared similarities with that of pancreatic β cells (Reimann and Gribble, 2002; Gribble et al., 2003; Reimann et al., 2008). Particularly, glucose-stimulated GLP-1 secretion from the enteroendocrine cell line GLUTag cells and primary L cells involved the ATP-sensitive potassium (KATP) channel and voltage-dependent calcium channels (VDCC), and was also sensitive to elevation of intracellular cAMP mediated by a combination of forskolin and 3-isobutyl-1-methylxanthine (Fsk/IBMX) (Reimann and Gribble, 2002; Reimann et al., 2008).
The Gs-coupled GPCR, GPR119, is expressed predominantly in pancreatic β cells and intestinal L cells (Soga et al., 2005; Chu et al., 2008; receptor nomenclature follows Alexander et al., 2011). Activation of GPR119 in pancreatic β-cells by endogenous ligands or small molecule agonists stimulates insulin secretion (Soga et al., 2005; Overton et al., 2006; Chu et al., 2007). It is well established that GPR119-mediated insulin secretion, similar to the action of GLP-1 analogues, is strictly glucose-dependent, i.e. there is no significant stimulation at basal glucose levels (Soga et al., 2005; Overton et al., 2006; Chu et al., 2007; Ning et al., 2008). GPR119 is also expressed in intestinal L cells,and, here, its activation mediates GLP-1 secretion (Chu et al., 2008; Lauffer et al., 2009) but it is not clear if GPR119-mediated GLP-1 secretion is glucose-dependent. Simpson et al., (2007) reported that Fsk/IBMX stimulated GLP-1 release and intracellular calcium elevation even in the absence of nutrients, whereas Chu et al., (2008) reported that the GPR119 agonist AR231453 stimulated a rapid, transient, and glucose-dependent increase in active GLP-1 levels. Given that GPR119 activation elevates intracellular cAMP, it is not clear why GPR119-mediated GLP-1 secretion would be glucose-dependent whilst cAMP-mediated GLP-1 secretion is glucose independent.
We therefore designed the current study specifically to address the glucose-dependence of GPR119-mediated GLP-1 secretion, and to explore the differences in the cellular mechanisms of hormone secretion between intestinal L cells and pancreatic β cells.
Methods
GLP-1 secretion from GLUTag cells
GLUTag cells were maintained in a low-glucose Dulbecco's modified Eagle's medium [DMEM 11885-084; Invitrogen (Carlsbad, CA, USA) with 5.5 mM d-glucose, 4 mM L-glutamine and 1 mM sodium pyruvate) supplemented with 10% FBS, and 1 × penicillin/streptomycin in a humidified incubator at 37°C with 5% CO2. For GLP-1 secretion, cells were seeded (∼5 × 10⁴ cells per well) into poly-D-Lysine coated 96-well plate in DMEM (5.5 mM glucose) + 10% fetal bovine serum (FBS) and incubated at 37°C overnight. The next day, cells were washed twice with Krebs–Ringer bicarbonate buffer and then incubated in Krebs buffer with compounds in equal final concentration of DMSO at 37°C for 3–4 h. The reaction buffer contained 0.1% BSA + 2.5 µM KR-62436, an inhibitor of dipeptidyl peptidase-IV (DPP-IV). Supernatants were collected to measure GLP-1 using the Active GLP-1 (ver 2) kit from Meso-Scale Discovery (Gaithersburg, MD).
Insulin secretion from Min6 cells
Min6 cells were maintained in DMEM containing 15% heat-inactivated FBS, 25 mM glucose, 50 µM 2-mercaptoethanol, and 1 × penicillin/streptomycin in a humidified incubator at 37°C with 5% CO2. For insulin secretion, cells were seeded (∼1 × 10⁵ cells per well) into poly-D-Lysine coated 96-well plate in DMEM (25 mM glucose) + 15% FBS and incubated at 37°C overnight. On the next day, cells were washed 1 × with Krebs–Ringer bicarbonate buffer, then pre-incubated in Krebs buffer containing 0.1% BSA + 2.5 µM KR-62436 but no glucose for 30 min, and subsequently incubated in Krebs buffer (containing 0.1% BSA + 2.5 µM KR-62436) with test compounds at desired concentrations in an equal final concentration of DMSO at 37°C for 1 h. Supernatants were collected to measure insulin using the mouse/rat insulin kit from Meso-Scale Discovery.
Mouse colon culture and GLP-1 secretion
All animal care and experimental procedures were conducted in an Association for Assessment and Accreditation of Laboratory Animal Care International accredited facility and approved by the Research Institute Animal Care and Use Committee of MRL at Rahway, New Jersey.
Primary intestinal cell isolation, culture and GLP-1 secretion were performed as described by Reimann et al., (2008). Briefly, colon segments were dissected from 10 week-old C57BL/6 male mice. Segments were cut open longitudinally and washed quickly in DMEM (serum-free) to remove luminal contents. The tissue was digested with 0.5 mg.ml-1 collagenase-XI for 4 × 15 min, and cells were collected and cultured in 24-well Matrigel-coated plates at 37°C for 2 days. The culture medium was DMEM (25 mM glucose) + 10% FBS + 2 mM L-glutamine + 1 × penicillin/streptomycin + 1 × gentamicin/amphotericin. On the day of GLP-1 assay, cells were washed twice with PBS, and then treated with test compounds/agents in serum-free DMEM (glucose-free or with desired concentration of glucose) for 2 h at 37°C. Supernatants were collected for the GLP-1 secretion assay using the active GLP-1 (ver 2) kit from Meso-Scale Discovery.
GPR119-mediated GLP-1 secretion in vivo
C57BL/6 male mice were obtained from Taconic (Hudson, NY). Overnight fasted, 10 week-old male mice (n= 20 per group) were given either vehicle (15% polyethylene glycol 400 + 85% of 23.5% hydroxypropyl-β-cyclodextrin) or MBX-2982 at 10 mg.kg−1 via oral gavage. Half of the animals (n= 10 per group) were killed by CO2 asphyxiation 30 min after compound dosing, and blood was collected by cardiac puncture. To preserve active GLP-1, a DPP-IV inhibitor (Linco Cat# DPP4; 10 µL per 1 mL of blood) was pre-added to the blood collection tubes and, before the cardiac puncture, the walls of the syringes were rinsed with the DPP-IV inhibitor. The other half of the animals (n= 10 per group) received a bolus of oral glucose (3 g kg−1) 30 min after compound dosing, and were killed for blood collection 10 min after the glucose load. GLP-1 levels in the plasma samples were measured using the active GLP-1 (ver 2) kit from Meso-Scale Discovery.
Calcium assays
GLUTag and Min6 cells were seeded into poly-D-lysine-coated 384-well plates at 3 x 10⁴ cells per well and cultured at 37°C for 1 day. On the day of the experiment, cells were washed twice with assay buffer (HBSS + 20 mM HEPES) and preincubated for 2 h at 37°C in glucose-free DMEM. Cells were then loaded for 30 min at 37°C with buffer containing the calcium-sensitive dye from the fluorometric imaging plate reader (FLIPR) calcium 4 assay kit (Molecular Devices, Sunnyvale, CA, USA) in assay buffer containing 2.5 mM probenecid according to the kit protocols. The plate was cooled to room temperature and compounds were added while changes in intracellular calcium content were monitored for up to 20 min using a FLIPR (Molecular Devices, Sunnyvale, CA, USA). Maximum peak height in each well was recorded as representing calcium influx.
Data analysis
Data were reported as mean ± SEM. Depending on data structure, analyses were performed using algorithms implemented in the GraphPad Prism 5.02 software (GraphPad Software, La Jolla, CA, USA) and shown in the Figure legends. P values < 0.05 were considered statistically significant.
Materials
GPR119 agonists used in this study were synthesized at Merck Research Laboratories (MRL) according to the published structures: AR231453 (Chu et al., 2007; Semple et al., 2011), Arena B3 (Arena Pharmaceuticals, 2005; Jones et al., 2009), and MBX-2982 (McWherter, 2010). GLUTag cells were licensed by MRL from Dr. Daniel Drucker (University of Toronto, Toronto, Canada), and Min6 cells were licensed from Professor Junichi Miyazaki (Osaka University Medical School, Osaka, Japan). All other reagents were from commercial sources.
Results
GPR119 agonists stimulate GLP-1 secretion from GLUTag cells both in the presence and in the absence of glucose
The GPR119 agonist AR231453 stimulated GLP-1 release in GLUTag cells in a dose-dependent fashion, with a EC50 of 56 nM in the presence of 15 mM glucose (Chu et al., 2008), but the compound had not been previously tested under glucose-free conditions. We treated GLUTag cells with serial dilutions of AR231453 starting at 2.5 µM with or without glucose. At 0 or 10 mM glucose, AR231453 dose-dependently increased GLP-1 release into the culture media (Figure 1A), with EC50 values of 78 nM [95% confidence interval (CI): 23 nM–268 nM] and 17 nM (95% CI: 5 nM–51 nM), respectively. Note that these CI overlap and are similar to the previously reported EC50 of 56 nM (Chu et al., 2008). Two-way anova revealed that the AR231453 effect explained 46% of the variance, and the glucose effect accounted for 32%. The interaction between AR231453 and glucose explained only 7% of the variance, suggesting that AR231453 and glucose act additively, not interactively, to stimulate GLP-1 secretion from GLUTag cells, with AR231453 having a larger effect than glucose.
Figure 1.

GPR119 agonist AR231453 stimulates GLP-1 secretion from GLUTag cells both in the presence and in the absence of glucose, but insulin secretion from Min6 cells is stimulated by AR231453 only in the presence of glucose. (A) GLP-1 secretion from GLUTag cells in response to an eight-point dose titration of AR231453 (0–3 µM), in the presence or absence of 10 mM glucose. (B) Insulin secretion from Min6 cells in response to an eight-point dose titration of AR231453 (0–3 µM), in the presence or absence of 10 mM glucose. (C) GLP-1 secretion from GLUTag cells in response to an eight-point dose titration of glucose (0–25 mM), in the presence or absence of 3 µM AR231453. (D) Insulin secretion from Min6 cells in response to an eight-point dose titration of glucose (0–25 mM), in the presence or absence of 3 µM AR231453. The dose curves were generated with the log (agonist) versus response (three parameters) algorithm in the GraphPad Prism 5.02 software. The data points are means ± SEM (n= 4).
In order to compare the effect of GPR119 activation in GLUTag cells to that in pancreatic β cells, we performed the same experiment in Min6 cells. A distinct response pattern was observed (Figure 1B). At 10 mM glucose, AR231453 dose-dependently increased insulin secretion from Min6 cells (EC50= 0.5 nM). However, AR231453 had no effect at 0 mM glucose. Two-way anova revealed that the glucose effect accounted for >90% of the variance, and GPR119 agonism explained a negligible portion of the variance in Min6 cells. To further test the glucose-dependence of GPR119-mediated GLP-1 secretion and insulin secretion, we treated GLUTag and Min6 cells with glucose titration from 0 to 33 mM, with or without 3 µM AR231453. In GLUTag cells, AR231453 elevated GLP-1 levels at all glucose levels tested (Figure 1C). Two-way anova revealed that AR231453, glucose, and the interaction explained 73%, 14% and 6% of the variance, respectively. In contrast, in Min6 cells, the DMSO and the AR231451 curves superimposed at low glucose range but diverged when the glucose level was raised. Together, these data indicate that AR231453-stimulated GLP-1 release from GLUTag cells is not, but insulin secretion from Min6 cells is, dependent on the presence of glucose (Figure 1D).
To test if other GPR119 agonists also stimulate GLP-1 secretion from GLUTag cells in a glucose-independent manner, we treated GLUTag cells with Arena B3, at 0, 1 and 10 mM glucose. Similar to AR231453, Arena B3 increased GLP-1 secretion at all glucose levels (Figure 2A), with EC50 values of 0.29 µM (95% CI: 0.07–1.4 µM), 0.33 µM (95% CI: 0.17–0.63 µM) and 0.40 µM (95% CI: 0.20–0.80 µM) at 0, 1 and 10 mM glucose, respectively. Two-way anova revealed that the B3 effect explained 68% of the variance, and the glucose effect accounted for 20%. The interaction explained only 7% of the variance, suggesting that B3 and glucose acted additively, and that the GPR119 agonist had a bigger effect than glucose on GLP-1 secretion from GLUTag cells. We also treated GLUTag cells with oleoylethanolamide (OEA), a naturally occurring bioactive lipid proposed to be an endogenous ligand of GPR119 (Overton et al., 2006; Ning et al., 2008; Lauffer et al., 2009). OEA increased GLP-1 secretion from GLUTag cells at both 0 and 10 mM glucose (Figure 2B). Two-way anova showed that OEA and glucose accounted for 15% and 69% of the variance, and that the interaction, which explained only 1% of the variance, was not statistically significant. This analysis indicated that OEA and glucose increased GLP-1 secretion from GLUTag cells in an additive fashion.
Figure 2.
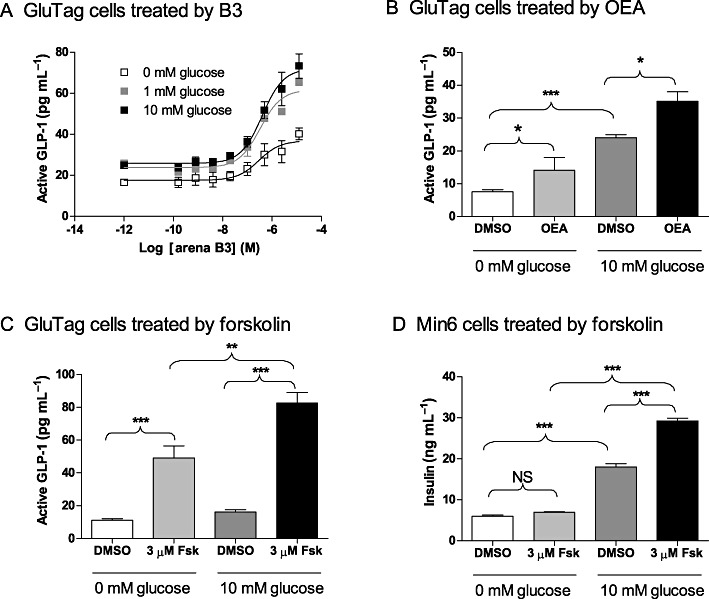
GPR119 agonist B3, OEA or forskolin (Fsk) stimulate GLP-1 secretion from GLUTag cells both in the presence and in the absence of glucose. (A) GLP-1 secretion from GLUTag cells in response to an eight-point dose titration of B3 (0–12.5 µM) at 0, 1 or 10 mM glucose. The dose curves were generated with the log (agonist) versus response (three parameters) algorithm in the GraphPad Prism 5.02 software. The data points are means ± SEM (n= 3). (B) GLP-1 secretion from GLUTag cells in response to 0 or 12.5 µM OEA at 0 or 10 mM glucose. Data are means ± SEM (n= 4). *P < 0.05; ***P < 0.001, t-test (two tailed). (C) GLP-1 secretion from GLUTag cells in response to 0 or 3 µM Fsk at 0 or 10 mM glucose. Data are means ± SEM (n= 4). **P < 0.01; ***P < 0.001, one-way anova with Bonferroni's correction. (D) Insulin secretion from Min6 cells in response to 0 or 3 µM Fsk at 0 or 10 mM glucose. Data are means ± SEM (n= 4). ***P < 0.001, one-way anova with Bonferroni's correction. NS, not significant.
Because GPR119 is Gs-coupled and its activation leads to elevation of intracellular cAMP, we examined if forskolin had effects similar to GPR119 agonists. Indeed, in GLUTag cells, forskolin increased GLP-1 secretion in GLUTag cells by ∼fivefold, regardless of glucose levels (Figure 2C). In parallel studies, we confirmed that forskolin did not stimulate insulin secretion in Min6 cells when glucose was absent, but it did enhance glucose-stimulated insulin secretion (Figure 2D).
GPR119 agonists stimulate GLP-1 secretion independent of glucose in primary intestinal cells or in vivo
To test whether GPR119-mediated GLP-1 secretion was glucose-dependent in primary L cells, we isolated intestinal epithelial cells from mouse colon, and treated the cells with 0, 0.01, 0.1 and 1 µM B3 in the absence or presence of 10 mM glucose. As observed in GLUTag cells, B3 increased GLP-1 secretion at both glucose levels (Figure 3A). Data analysis showed that B3 accounted for 63% of the variance and glucose for 12%, while the interaction accounted for a non-significant 2%. These results indicated that GPR119-mediated GLP-1 secretion from primary intestinal L cells is also glucose-independent.
Figure 3.
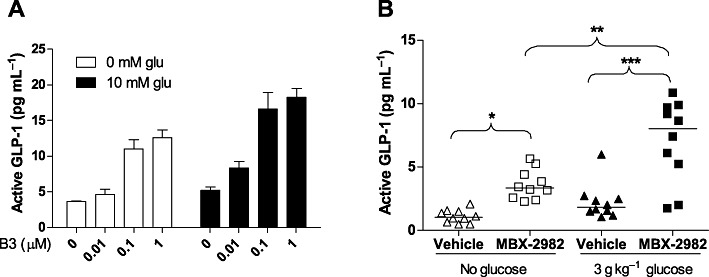
GPR119 agonists stimulate GLP-1 secretion independent of glucose in primary intestinal cells (A) or in vivo (B). (A) GLP-1 secretion from mouse primary colon culture sin response to 0, 0.01, 0.1 and 1 µM B3 at 0 mM or 10 mM glucose (glu). Data are means ± SEM (n= 6). Two-way anova table, which showed significant glucose and GPR119 effect but no interaction, is pasted beneath the plot. (B) GLP-1 secretion in vivo in response to MBX-2982 before and after glucose load. Overnight fasted, 10 week-old male C57BL/6 mice (n= 20 per group) were given either vehicle or MBX-2982 at 10 mg. kg−1 via oral gavage. Half of the animals (n= 10 per group) were killed 30 min after compound dosing and blood was collected by cardiac puncture. The other half of the animals (n= 10 per group) received an oral glucose load (3 g kg−1) at 30 min after compound dosing, and were killed 10 min later. Each symbol represents one animal. *P < 0.05; **P < 0.01; ***P < 0.001, one-way anova with Bonferroni's correction.
Finally, to examine whether the observations in GLUTag and the primary intestinal cells has physiological relevance, we treated C57BL/6 mice with the GPR119 agonist MBX-2982 at a dose of 10 mg. kg−1. Note that in order to examine a direct GPR119 effect, no DPP-IV inhibitor was co-administered in this experiment, but a DPP-IV inhibitor was used to preserve active GLP-1 in the blood samples. We found that the plasma GLP-1 levels from the mice dosed with MBX-2982 were increased without a glucose load, indicating that GPR119-mediated GLP-1 secretion is not dependent on glucose in vivo (Figure 3B).
GLP-1 secretion from GLUTag cells is sensitive to VDCC blockage
GLP-1 secretion from L cells has been reported to involve the KATP channel, the protein kinase A (PKA) pathway, and VDCC (Reimann and Gribble, 2002; Reimann et al., 2005; 2008; Simpson et al., 2007), but the role of GPR119 has not been characterized in the context of these pathways. To further understand the difference in glucose-dependence between GLP-1 secretion and insulin secretion, we treated GLUTag cells with pharmacological agents modulating these pathways and examined the effects of these agents on GPR119-mediated GLP-1 secretion.
We first tested the effects of KATP channel modulators. GPR119 agonist B3-stimulated GLP-1 release in the absence of glucose, and the effect was modestly enhanced with 250 µM tolbutamide (P > 0.05 by anova with Bonferroni's post-test, but P= 0.014 by pair-wise t-test). In the presence of 10 mM glucose, B3-stimulated GLP-1 release was blocked by 250 µM diazoxide (Figure 4A). These data confirm the involvement of KATP channels in GLUTag cells, as has been previously reported (Reimann and Gribble, 2002). Next, we tested the involvement of PKA and VDCC. B3-stimulated GLP-1 release was partially blocked by the PKA inhibitor H89 (30 µM), confirming the involvement of the PKA pathway. Interestingly, the L-type VDCC blocker nitrendipine (6 µM) not only blocked glucose and GPR119-stimulated GLP-1 release, but also decreased the GLP-1 level below the basal (Figure 4B, compare the first bar to the fifth bar, P= 0.003 by pair-wise t-test), implying that basal GLP-1 secretion in GLUTag cells may be sensitive to VDCC blockade. These data prompted us to extend our investigation on whether VDCC blockade had a different effect in GLUTag and Min6 cells.
Figure 4.

GLP-1 secretion from GLUTag cells is sensitive to blockade of VDCC. (A) GLP-1 secretion from GLUTag cells in response to B3 (3 µM), the KATP channel blocker tolbutamide (250 µM), and the KATP channel opener diazoxide (250 µM), at 0 mM or 10 mM glucose. Data are means ± SEM (n= 8). **P < 0.01; ***P < 0.001, one-way anova (left six bars) with Bonferroni's correction. Data from forskolin treatments (the right two bars) were not included in anova. (B) GLP-1 secretion from GLUTag cells in response to Arena B3 (3 µM), the PKA inhibitor H89 (30 µM), and the L-type VDCC blocker nitrendipine (µM), at 0 or 5 mM glucose. Data are means ± SEM (n= 8). **P < 0.01; ***P < 0.001, one-way anova (left five bars) with Bonferroni's correction. Data from forskolin treatments (the right two bars) were not included in anova. (C) GLP-1 secretion from GLUTag cells in response to nitrendipine (0.03, 0.3 and 3 µM) at 10 mM glucose. Data are presented as % change from basal (0 mM glucose) and are means ± SEM (n= 8). *P < 0.05; **P < 0.01; ***P < 0.001, one-way anova with Dunnett's post-test compared with basal. (D) Insulin secretion from Min6 cells in response to nitrendipine (0.03, 0.3 and 3 µM) at 10 mM glucose. Data are presented as % change from basal (0 mM glucose) and are means ± SEM (n= 8). ***P < 0.001, one-way anova with Dunnett's post-test compared with basal. (E) GLP-1 secretion from GLUTag cells in response to nitrendipine (0.03, 0.3 and 3 µM) in the presence of 3 µM AR231453 at 0 mM glucose. Data are presented as % change from basal (0 µM AR231453) and are means ± SEM (n= 8). *P < 0.05; ***P < 0.001, one-way anova with Dunnett's post-test compared with basal. (F) Insulin secretion from Min6 cells in response to nitrendipine (0.03, 0.3 and 3 µM) in the presence of 3 µM AR231453. Data are presented as % change from basal (0 µM AR231453) and are means ± SEM (n= 8). One-way anova with Dunnett's post-test compared with basal. (G) GLP-1 secretion from GLUTag cells in response to nitrendipine (0.03, 0.3 and 3 µM). Data are presented as % change from basal (0 µM nitrendipine) and are means ± SEM (n= 8). *P < 0.05; **P < 0.01; ***P < 0.001, one-way anova with Dunnett's post-test compared with basal. (H) Insulin secretion from Min6 cells in response to nitrendipine (0.03, 0.3 and 3 µM). Data are presented as % change from basal (0 µM nitrendipine) and are means ± SEM (n= 8). One-way anova with Dunnett's post-test compared with basal. NS, not significant.
First, we tested the effect of nitrendipine on glucose-stimulated GLP-1 or insulin secretion in GLUTag and Min6 cells, respectively. Glucose stimulated a modest ∼60% increase of GLP-1 secretion in GLUTag cells. Nitrendipine dose-dependently decreased GLP-1 release (Figure 4C). Remarkably, nitrendipine not only blocked the glucose-stimulated GLP-1 secretion, but also decreased it below the basal level at all three dose levels tested (Figure 4C). On the other hand, insulin secretion from Min6 cells was robustly stimulated by glucose (>500% increase), which was also significantly inhibited by nitrendipine (Figure 4D). However, in Min6 cells, nitrendipine even at 3 µM did not significantly decrease insulin secretion below the basal level (Figure 4D). These data indicate that glucose-stimulated hormone secretion in GLUTag and in Min6 cells respond differently to block of VDCC.
Next, we tested the effect of nitrendipine on GPR119-mediated GLP-1 or insulin secretion under glucose-free conditions. AR231453 (3 µM) caused a ∼2-fold increase of GLP-1 secretion in GLUTag cells, which was dose-dependently blocked by nitrendipine. Nitrendipine at 3 µM appeared to have decreased GPR119-mediated GLP-1 release below the basal level (Figures 4E, P > 0.05 by anova with Dunnett's post-test, but P= 0.0012 by pair-wise t-test). In contrast, AR231453 had no effect on insulin secretion from Min6 cells in the absence of glucose. Insulin secretion was not dose-dependently or significantly affected by nitrendipine (Figure 4F).
Finally, to test the hypothesis that the basal GLP-1 and insulin secretion had different sensitivity to VDCC blockade, we treated GLUTag and Min6 cells with nitrendipine, in the absence of either glucose or cAMP-elevating stimuli. Nitrendipine dose-dependently blocked basal GLP-1 release from GLUTag cells (Figure 4G), whilst in Min6 cells nitrendipine had no significant or dose-dependent effect (Figure 4H). These data indicate that basal GLP-1 release from GLUTag cells, but not basal insulin release from Min6 cells, was sensitive to VDCC blockade.
GPR119 agonist increases calcium influx in GLUTag cells
To test if GPR119 agonists have a direct effect on calcium influx, we treated GLUTag cells and Min6 cells with AR231453, and monitored the intracellular calcium levels using a calcium-sensitive dye and a FLIPR. We observed a dose-dependent increase of the FLIPR signal in GLUTag cells, with an EC50 value of 0.11 µM (Figure 5A). No dose-dependent response was observed in Min6 cells (Figure 5B). The data indicate that GPR119 agonists modulate calcium influx in GLUTag cells.
Figure 5.
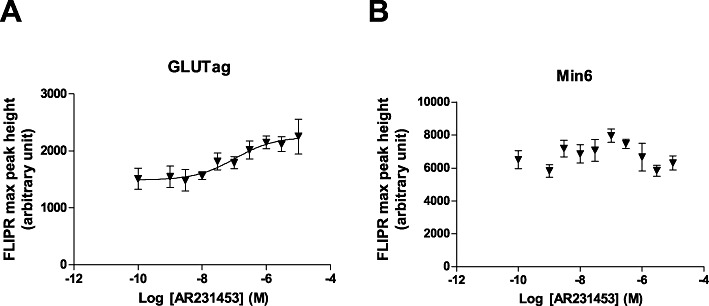
FLIPR signal representing calcium influx in GLUTag (A) and Min6 cells (B) in response to a 10-point dose titration of AR231453 (0–10 µM). GLUTag and Min6 cells were washed and loaded for 30 min at 37°C with a calcium-sensitive dye. The plate was cooled to room temperature and compounds were added while changes in intracellular calcium content were monitored for up to 20 min using a FLIPR. Maximum peak height in each well was recorded as representing calcium influx. Data are are means ± SEM (n= 8). The dose curve was generated and the EC50 value was calculated with the sigmoidal dose–response (variable slope) algorithm in the GraphPad Prism 5.02 software. The data from Min6 cells did not converge.
Discussion
In the present study, we found that GPR119 agonists stimulated GLP-1 secretion in a glucose-independent manner in GLUTag cells, in primary intestinal cells, as well as in vivo, whilst insulin secretion mediated by GPR119 agonists was glucose-dependent. To our knowledge this is the first study specifically designed to address the glucose dependence of GPR119-mediated GLP-1 secretion and its underlying mechanisms.
The findings clarify the uncertainty over the glucose dependence of GLP-1 secretion. Our data in GLUTag cells with GPR119 agonists are consistent with the previous report that the Fsk/IBMX combination stimulated GLP-1 release in the absence of nutrients (Simpson et al., 2007). However, our in vivo data showing that MBX-2982-stimulated GLP-1 secretion before a glucose load initially appeared to be inconsistent with those of Chu et al., 2008) who concluded that AR231453 (10 mg kg–1 orally) stimulated a rapid, transient, and glucose-dependent increase in active GLP-1 levels. Indeed, their data on the AR231453 alone group showed that GLP-1 elevation was only significant after a glucose load, and hence they concluded a glucose-dependent increase in active GLP-1 levels. However, in the same data set, AR231453 did significantly elevate plasma active GLP-1 levels in mice before a glucose load, when used in combination with a DPP-IV inhibitor, which actually would suggest a glucose-independent effect of AR231453. In the present study, we were able to show that MBX-2982 alone significantly increased GLP-1 secretion without glucose, because we were careful to prevent degradation of active GLP-1 by rinsing the syringes used for cardiac puncture with a DPP-IV inhibitor, in addition to the standard practice of adding DPP-IV inhibitor to the blood collecting tubes. Our in vivo data are also consistent with the findings of others, who showed that application of OEA (10 µM) directly into the rat ileum increased plasma active GLP-1 levels without a glucose load (Lauffer et al., 2009), and that Gpr119 knockout mice had reduced plasma GLP-1 levels at fasting (Lan et al., 2009). Taken together, we conclude that GPR119-mediated GLP-1 secretion is glucose-independent both in vitro and in vivo.
Earlier studies, especially those published by group of the Reimann and Gribble, suggested that in GLUTag and primary L cells, the glucose-sensing and hormone-secretion machinery was similar to that of pancreatic β cells, which included KATP channels, VDCC and cAMP (Reimann and Gribble, 2002; Reimann et al., 2008). We have extended these findings by showing that in GLUTag and in primary intestinal cells, GPR119 activation was the major driving force for GLP-1 secretion, relative to glucose, and that a GPR119 agonist alone was sufficient to drive GLP-1 secretion. In contrast, glucose was the major player for insulin secretion from Min6 cells and cAMP elevation, either mediated by GPR119 activation or by forskolin, required glucose as a permissive signal to enhance insulin secretion. Finally, we showed that GLUTag and Min6 cells exhibited different sensitivities to VDCC blockade under basal or stimulated conditions, and that GPR119 agonists modulated calcium influx in GLUTag cells, but not in Min6 cells.
It is well established that intracellular free calcium is required for granule exocytosis. In β cells, an elevation of intracellular free calcium is a key step underlying glucose-stimulated insulin secretion, by which glucose metabolism increases the cellular ATP/ADP ratio, causing the closure of the KATP channels and depolarization of the plasma membrane. The resulting VDCC opening thereby allows for calcium influx and leads to insulin secretion (Henquin, 2004). Calcium influx in β cells may be low in the absence of glucose stimulation, as reflected by the observation that basal insulin secretion in Min6 cells was not sensitive to 3 µM nitrendipine, a concentration that completely blocked glucose-stimulated insulin secretion. It is thus likely that the cAMP signal, mediated by the activation of GPR119, GLP-1R or other mechanisms, requires the coupling of glucose-induced calcium influx to enhance insulin exocytosis. In contrast, in GLUTag cells, glucose-stimulated GLP-1 secretion, GPR119-mediated GLP-1 secretion and basal GLP-1 secretion were all sensitive to blockade of VDCC. These data would be consistent with a higher basal calcium tone in L cells. Because GPR119 is known to be constitutively active (Chu et al., 2007; 2008; Ning et al., 2008) and that cAMP can induce calcium influx (Simpson et al., 2007), GLUTag cells may have a higher basal calcium tune due to constitutively elevated cAMP levels. These properties may explain why GPR119-mediated GLP-1 secretion from GLUTag cells and primary intestinal cells is glucose-independent.
Acknowledgments
We wish to thank Ms. Jie Pan of MRL for maintaining the GLUTag cell culture, and Ms. Yue Feng of MRL for maintaining the Min6 cell culture. We thank Dr. Yun-ping Zhou and Dr. Andrew D. Howard, both of MRL, for critical discussions.
Glossary
- ATP-sensitive
potassium channel
- DMEM
Dulbecco's modified eagle's medium
- DPP-IV
dipeptidyl peptidase-IV
- FLIPR
fluorometric imaging plate reader
- Fsk
forskolin
- GLP-1
glucagon-like peptide 1
- GSIS
glucose-stimulated insulin secretion
- KATP
OEA, oleoylethanolamide
- PKA
protein kinase A
- VDCC
voltage-dependent calcium channel
Conflict of interest
All authors are employees of Merck & Co., Inc. This work is funded by Merck & Co., Inc.
References
- Alexander SPH, Mathie A, Peters JA. Guide to Receptors and Channels (GRAC), 5th Edition. Br J Pharmacol. 2011;164(Suppl. 1):S1–S324. doi: 10.1111/j.1476-5381.2011.01649_1.x. [DOI] [PMC free article] [PubMed] [Google Scholar]
- Arena Pharmaceuticals. Substituted aryl and heteroaryl derivatives as modulators of metabolism and the prophylaxis and treatment of disorders related thereto. 2005. WO/2005/121121.
- Chu ZL, Jones RM, He H, Carroll C, Gutierrez V, Lucman A, et al. A role for beta-cell-expressed G protein-coupled receptor 119 in glycemic control by enhancing glucose-dependent insulin release. Endocrinology. 2007;148:2601–2609. doi: 10.1210/en.2006-1608. [DOI] [PubMed] [Google Scholar]
- Chu ZL, Carroll C, Alfonso J, Gutierrez V, He H, Lucman A, et al. A role for intestinal endocrine cell-expressed g protein-coupled receptor 119 in glycemic control by enhancing glucagon-like Peptide-1 and glucose-dependent insulinotropic Peptide release. Endocrinology. 2008;149:2038–2047. doi: 10.1210/en.2007-0966. [DOI] [PubMed] [Google Scholar]
- Drucker DJ. The biology of incretin hormones. Cell Metab. 2006;3:153–165. doi: 10.1016/j.cmet.2006.01.004. [DOI] [PubMed] [Google Scholar]
- Gribble FM, Williams L, Simpson AK, Reimann F. A novel glucose-sensing mechanism contributing to glucagon-like peptide-1 secretion from the GLUTag cell line. Diabetes. 2003;52:1147–1154. doi: 10.2337/diabetes.52.5.1147. [DOI] [PubMed] [Google Scholar]
- Henquin JC. Pathways in beta-cell stimulus-secretion coupling as targets for therapeutic insulin secretagogues. Diabetes. 2004;53(Suppl. 3):S48–S58. doi: 10.2337/diabetes.53.suppl_3.s48. [DOI] [PubMed] [Google Scholar]
- Jones RM, Leonard JN, Buzard DJ, Lehmann J. GPR119 agonists for the treatment of type 2 diabetes. Expert Opin Ther Pat. 2009;19:1339–1359. doi: 10.1517/13543770903153878. [DOI] [PubMed] [Google Scholar]
- Lan H, Vassileva G, Corona A, Liu L, Baker H, Golovko A, et al. GPR119 is required for physiological regulation of glucagon-like peptide-1 secretion but not for metabolic homeostasis. J Endocrinol. 2009;201:219–230. doi: 10.1677/JOE-08-0453. [DOI] [PubMed] [Google Scholar]
- Lauffer LM, Iakoubov R, Brubaker PL. GPR119 is essential for oleoylethanolamide-induced glucagon-like peptide-1 secretion from the intestinal enteroendocrine L-cell. Diabetes. 2009;58:1058–1066. doi: 10.2337/db08-1237. [DOI] [PMC free article] [PubMed] [Google Scholar]
- McWherter C. The discovery of novel agonists of GPR119 receptor for the treatment of type 2 diabetes. In 32nd Annual National Medicinal Chemistry Symposium; Minneapolis, MN, USA. 2010. [Google Scholar]
- Ning Y, O'Neill K, Lan H, Pang L, Shan LX, Hawes BE, et al. Endogenous and synthetic agonists of GPR119 differ in signalling pathways and their effects on insulin secretion in MIN6c4 insulinoma cells. Br J Pharmacol. 2008;155:1056–1065. doi: 10.1038/bjp.2008.337. [DOI] [PMC free article] [PubMed] [Google Scholar]
- Overton HA, Babbs AJ, Doel SM, Fyfe MC, Gardner LS, Griffin G, et al. Deorphanization of a G protein-coupled receptor for oleoylethanolamide and its use in the discovery of small-molecule hypophagic agents. Cell Metab. 2006;3:167–175. doi: 10.1016/j.cmet.2006.02.004. [DOI] [PubMed] [Google Scholar]
- Reimann F, Gribble FM. Glucose-sensing in glucagon-like peptide-1-secreting cells. Diabetes. 2002;51:2757–2763. doi: 10.2337/diabetes.51.9.2757. [DOI] [PubMed] [Google Scholar]
- Reimann F, Maziarz M, Flock G, Habib AM, Drucker DJ, Gribble FM. Characterization and functional role of voltage gated cation conductances in the glucagon-like peptide-1 secreting GLUTag cell line. J Physiol. 2005;563:161–175. doi: 10.1113/jphysiol.2004.076414. [DOI] [PMC free article] [PubMed] [Google Scholar]
- Reimann F, Habib AM, Tolhurst G, Parker HE, Rogers GJ, Gribble FM. Glucose sensing in L cells: a primary cell study. Cell Metab. 2008;8:532–539. doi: 10.1016/j.cmet.2008.11.002. [DOI] [PMC free article] [PubMed] [Google Scholar]
- Semple G, Ren A, Fioravanti B, Pereira G, Calderon I, Choi K, et al. Discovery of fused bicyclic agonists of the orphan G-protein coupled receptor GPR119 with in vivo activity in rodent models of glucose control. Bioorg Med Chem Lett. 2011;21:3134–3141. doi: 10.1016/j.bmcl.2011.03.007. [DOI] [PubMed] [Google Scholar]
- Simpson AK, Ward PS, Wong KY, Collord GJ, Habib AM, Reimann F, et al. Cyclic AMP triggers glucagon-like peptide-1 secretion from the GLUTag enteroendocrine cell line. Diabetologia. 2007;50:2181–2189. doi: 10.1007/s00125-007-0750-9. [DOI] [PMC free article] [PubMed] [Google Scholar]
- Soga T, Ohishi T, Matsui T, Saito T, Matsumoto M, Takasaki J, et al. Lysophosphatidylcholine enhances glucose-dependent insulin secretion via an orphan G-protein-coupled receptor. Biochem Biophys Res Commun. 2005;326:744–751. doi: 10.1016/j.bbrc.2004.11.120. [DOI] [PubMed] [Google Scholar]
- Tolhurst G, Reimann F, Gribble FM. Nutritional regulation of glucagon-like peptide-1 secretion. J Physiol. 2009;587:27–32. doi: 10.1113/jphysiol.2008.164012. [DOI] [PMC free article] [PubMed] [Google Scholar]