Abstract
One approach, commonly used in the field of electrocardiography, involves solving an inverse problem whereby electrical potentials on the stomach surface are directly reconstructed from dense potential measurements on the skin surface. To investigate this problem, an anatomically realistic torso model and an electrical stomach model were used to simulate potentials on stomach and skin surfaces arising from normal gastric electrical activity. The effectiveness of the Greensite-Tikhonov or the Tikhonov inverse methods were compared under the presence of 10% Gaussian noise with either 84 or 204 body surface electrodes. The stability and accuracy of the Greensite-Tikhonov method was further investigated by introducing varying levels of Gaussian signal noise or by increasing or decreasing the size of the stomach by 10%. Results showed that the reconstructed solutions were able to represent the presence of propagating multiple wave fronts and the Greensite-Tikhonov method with 204 electrodes performed best (Correlation coefficients of activation time: 90%; Pacemaker localization error: 3 cm). The Greensite-Tikhonov method was stable with Gaussian noise levels up to 20% and 10% change in stomach size. The use of 204 rather than 84 body surface electrodes improved the performance; however, for all investigated cases, the Greensite-Tikhonov method outperformed the Tikhonov method.
1. Introduction
Omnipresent electrical impulses in the stomach musculature termed ‘slow waves’, generated by interstitial cells of Cajal, are a prerequisite for mechanical contractions. Abnormalities in the patterns of slow wave propagation have been associated with several functional gastric disorders such as gastroparesis and functional dyspepsia (Bortolotti et al 1990, Leahy et al 1999, 2001, O’Grady et al 2012). The ability to non-invasively characterize slow wave activity would be beneficial for diagnosis of gastric motility disorders and therapeutic strategies.
Gastric slow waves can be non-invasively detected using cutaneous electrodes on the body surface, giving rise to what has been termed the electrogastrogram (EGG) (Alvarez 1922). The corresponding magnetic fields have also been measured external to the body in what is known as a magnetogastrogram (MGG) (Bradshaw et al 2006). Despite the wide spread clinical acceptance of the standard 12-lead electrocardiogram (ECG), to date, the use of EGGs and MGGs has largely been restricted to research studies. This is partly due to the fact that it has been difficult to reliably relate EGG and MGG signals back to the underlying gastric electrical activity. A number of studies confirmed EGG frequency correlates with the gastric slow wave frequency but it remains uncertain how the multiple slow waves actually summate to generate what is recorded in EGG (Verhagen et al 1999, Du et al 2010). Only few studies have attempted to characterize gastric electrical activity using MGG (Allescher et al 1998, Bradshaw et al 2009, Cheng et al 2005a, Kim et al 2010), but these methods have also had limited success, in part because the underlying source has been restricted to be a single moving dipole.
One approach, commonly used in the field of electrocardiography, involves solving an inverse problem whereby electrical potentials on the stomach surface are directly reconstructed from large numbers of dense potential measurements on the skin surface. However, it remains unknown if such algorithms can be successfully applied to gastric field. In the cardiac field, inverse methods and algorithms to reconstruct the electrical activity of heart from the body surface measurements have been a fertile research ground for many decades. Recently, several inverse studies (Cheng et al 2005, Han et al 2008, Liu et al 2006, Ramanathan et al 2004) have successfully reconstructed activation time maps and validated the results against experimental measurements. No similar potential based inverse methods have been attempted in the gastric field.
Gastric slow wave activity has very different characteristics to cardiac activity. In humans, slow waves initiate in the greater curvature in the upper corpus region of the stomach at a frequency of approximately 3 cycles per min (cpm) (Hinder and Kelly 1977). The slow waves organize into a ring and propagate longitudinally down the stomach towards the pylorus. Due to the slow conduction velocity of the slow waves, 3 or more slow wave events can be present in the stomach at any point in time. In contrast, the normal heart has only one wave front present at any one time, with a frequency of approximately 60 cpm. In addition, the main stomach axis is generally oriented in the anterior/posterior direction. This means that the body surface recordings may be biased towards the activity located at the antrum of the stomach.
It is difficult to reliably obtain electrogastrograms from cutaneous electrodes. The signals are typically of low amplitude and corrupted by cardiac activity and electrode or movement artifacts (Chang et al. 2005). However, with careful experimental technique, the abdominal cavity noise caused by respiration or heartbeat can largely be removed using well-designed filters or breath-holds (Changet al 2001, Koch and Stern 1994). Other methods designed to remove movement or electrode artifacts have also been studied (Liang et al 1997, Camilleri et al 1998). In this study, we investigated the ability and accuracy of two established potential based inverse algorithms to reconstruct and resolve the presence of multiple simultaneous gastric slow waves using simulated human data. We have assumed that the body surface potentials have only been corrupted by either Gaussian signal noise or that the stomach geometry has been incorrectly reconstructed.
2. Methods
2.1 Geometric & Source Models
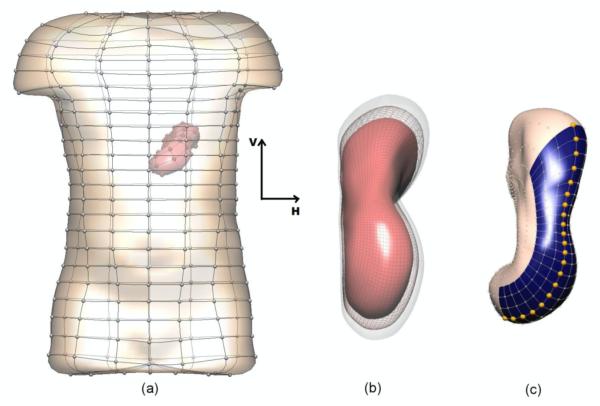
The anatomical model used in this study was derived from the Visible Human dataset (Buist et al 2006, Spitzer et al 1996). The model (shown in figure 1) consisted of boundary element surfaces representing the stomach and skin. The meshes were interpolated using cubic Hermite basis functions and the stomach and skin surfaces had 626 and 290 nodes respectively. Two additional models with different stomach sizes were also constructed by enlarging or reducing the original stomach size by approximately 10% while maintaining the size of the skin surface (figure 1(b)).
Figure 1.
Boundary element models of the skin and stomach. In (b) the original stomach is shown in wire frame and the stomach enlarged (transparent surface) and reduced (red surface) by 10%. In (c), the shaded (blue) region on the stomach corresponds to the area represented in figures 6-7. The highlighted (gold) nodes are the locations of the signal traces shown in figure 5.
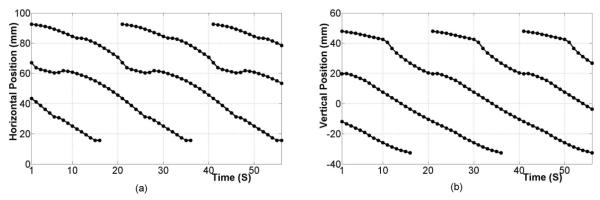
The underlying electrical activity was represented by a sequence of moving dipoles. To represent a single propagating slow wave event, solution points (at approximately 1 mm resolution) representing continuum cells were embedded within the stomach musculature. The Aliev (2000) cell model wasthen used at each solution point to represent the ionic current and the continuum-based bidomain equations were used to simulate the propagation of a slow wave at each time point. Lastly, dipole sources were derived from the transmembrane potential gradient at each solution point and combined to produce a single dipole with varying location and orientation (Komuro et al 2010). In this study a sequence of up to 3 simultaneous waves were present in order to mimic the recent findings of high-resolution mapping studies (O’Grady et al 2010, Lammers et al 2009). In summary, the slow wave initiated on the greater curvature in the upper corpus and progressed towards the antrum. A new slow wave event initiated in the pacemaker region when a previous slow wave was approximately on a third of the way down the length of the stomach, at an approximate spacing of 60 mm between waves (based on a period of 20 s) in the corpus. This is consistent with experimentally recorded data (Hinder and Kelly 1977, O’Grady et al 2010). The relative locations of the dipole sources are shown in figure 2.
Figure 2.
Location of dipole sources as a function of time in the (a) horizontal and (b) vertical directions which represented as H and V in figure 1, respectively. Between two and three slow wave events are always present in the stomach.
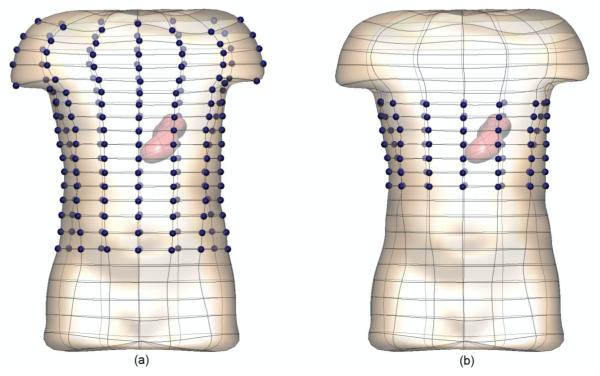
The gastric sources were used to simulate the potential solutions at either 84 or 204 electrodes spread uniformly over approximately 30 or 70% of the skin surface respectively. The electrode locations are shown in figure 3 by the dark blue spheres.
Figure 3.
The locations of the (a) 204 and (b) 84 electrodes are shown by the highlighted (dark blue) spheres. The simulated electrogastrograms at these electrodes were then used to reconstruct the stomach potentials.
2.2 Forward and Inverse Solutions
Methods mathematically similar to those used in cardiac forward/inverse simulations were used to compute potentials on the stomach and skin surfaces (Pullan et al 2001). In our case, the epicardial surface was replaced with the stomach surface. By solving the generalized Laplace’s equation the potentials on both the stomach surface and skin surface due to the dipole sources can be simulated.
A transfer matrix (A) that mapped the potentials on the stomach surface to the potentials on the skin surface was constructed using methods outlined in Pullan et al (2001). Using the noise corrupted body surface potentials, stomach potentials were reconstructed by solving equation (1) using either the Greensite-Tikhonov or the Tikhonov inverse method (Cheng et al 2003, Greensite and Huiskamp 1998, Messinger-Rapport and Rudy 1990) with regularization levels determined using an L-curve method (Hansen and O’Leary 1993).
| (1) |
where φB(x,t) and φS (y,t) represent the noise corrupted body surface and stomach surface potential distributions at location x or y at time t, respectively. is the regularized inverse of the transfer matrix A at time t.
The Tikhonov method regularizes only in the spatial domain and inverse solutions are obtained by minimizing the objective function
| (2) |
where λt is the regularization parameter, R is the regularization function and ∥·∥ is the Euclidean norm. On the other hand, the Greensite-Tikhonov method regularizes in both the spatial and temporal domain by treating the body surface potentials as a family of solutions (3) rather than treating each the temporal information in φB(x,t) independently (Greensite 2001).
| (3) |
where uB, i and νB,i are the ith element of spatial and temporal basis, respectively and σB, i is the ith singular value.
The L-curve method was chosen to determine the regularization parameter since it was shown as one of favoured methods in previous studies (Cheng et al 2003). The regularization parameter playsan important role since the optimal choice of the parameter provides a balance between accuracy and smoothness of the solution (Messinger-Rapport and Rudy 1990, Cheng et al 2003). L-curve method determines the regularization parameter λt at the maximum curvature of L shaped curve drawn using the residual (∥AφS(y,t)-φB(x,t)∥) and the solution norm (∥φS(y,t)∥).
2.3 Sensitivity Studies
The effects of different levels of Gaussian signal noise and correlated geometrical error were investigated on the solution accuracy of the Greensite-Tikhonov inverse method. Three different levels of Gaussian noise were added determine the sensitivity and stability of the inverse algorithms. The noise levels were 0.005, 0.01 or 0.02 mV RMS corresponding to approximately 5, 10 or 20% of the average peak to peak signal (as shown in figure 4).
Figure 4.
The signals traces at one electrode on skin surface with an average of (a) 5%, (b) 10% and (c) 20% of Gaussian noise. The black traces correspond to the original signal and blue traces to the noise corrupted signals.
The effect of geometric error was investigated by either enlarging or reducing the stomach size by approximately 10% (as shown in figure 1(b)). Due to the variability of stomach geometry it is important to understand how geometric error may affect the accuracy of the inverse solutions.
2.4 Comparison Methodology
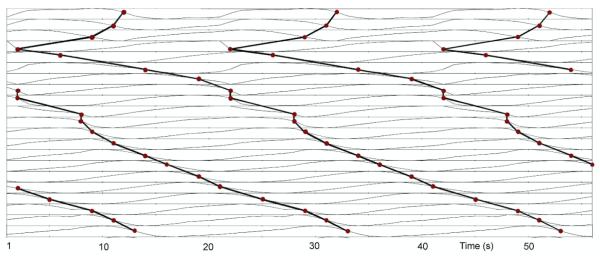
The numerical accuracy of the reconstructed stomach potentials were evaluated by comparing with the “known” stomach potentials derived from the dipole sources. Specifically, we compared the stomach potentials and derived entities such as wave front locations (activation times), pacemaker localization and wave speeds. Potential traces were normalized over time and as such signal amplitudes were not explicitly considered.
The activation times were defined as at the points of greatest negative gradients (shown in figure 5) and the activation time map was constructed. The potential or activation time errors were calculated using the correlation coefficients (CC) (4) and relative root mean square (RMS) (5) over the electrodes defined by:
| (4) |
| (5) |
where, and are potentials or activation times for the forward and inverse solutions at node i and N is the total number of comparison sites. and are the standard σF and σI are the means, deviations of potentials or activation times.
Figure 5.
Signal traces illustrating the propagation of individual wave fronts. The signal traces correspond to the gold nodes illustrated in figure 1(b) for the known solution. The activation times (red circles) were marked at the points of greatest negative gradients and grouped (solid line) to illustrate the propagation from pacemaker to pylorus.
The average velocities were calculated using a finite difference approximation with the distances between electrodes assumed to be constant (Du et al 2009). The pacemaker location was determined by the constructed activation time map and the pacemaker localization errors were calculated by the difference of pacemaker locations between the known and inverse solutions.
3. Results
3.1 Effect of Inverse Method and Number of Body Surface Electrodes
We initially investigated the accuracy of the different inverse methods using either 84 or 204 body surface electrodes. In all cases 10% of Gaussian noise was included to represent “best-case” experimental conditions.
3.1.1 Activation Time Maps
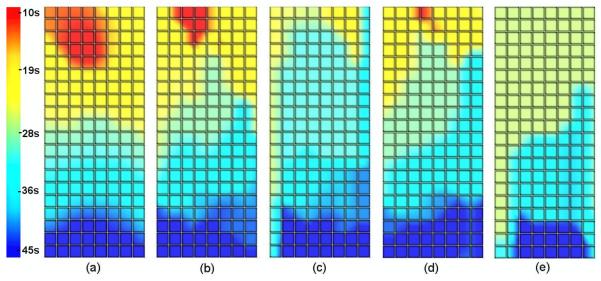
Activation time (AT) maps comparing the known and inversely reconstructed wave profiles on the stomach surface for a single wave are shown in figure 6. The corners of grids correspond to the electrodes on the stomach mesh in the blue coloured region of figure 1(c).
Figure 6.
Activation time maps for (a) the known solution and inverse solutions using 204 electrodes using (b) the Greensite-Tikhonov or (c) the Tikhonov method and using 84 electrodes with (d) the Greensite-Tikhonov or (e) the Tikhonov method. In all cases, the body surface signals had been corrupted by 10% Gaussian noise and the waves propagated from the pacemaker region (red/yellow area) towards the pylorus (blue area).
Results showed that the AT map reconstructed using the Greensite-Tikhonov method with 204 electrodes (shown in figure 6(b)) provided the best approximation of the known solution. The Tikhonov method with 84 electrodes provided the poorest representation (shown in figure 6(e)). The location of the pacemaker (red/yellow coloured region) was observed in the upper part of the stomach for all inverse solutions in the first 10 s except when using the Tikhonov method with 84 electrodes. In this case, the earliest AT was at 26 s and was not localized to the pacemaker region. All of the inverse solutions were able to accurately reconstruct the distal portion of the wave front as it approached the pylorus (dark blue coloured region).
In all cases, when the same number of body surface electrodes were used, the Greensite-Tikhonov method (figures 6(b) and 6(d)) was able to produce a better approximation to the known solution than the Tikhonov method (figures 6(c) and 6(e)). The AT maps were closer to the known solution when using more electrodes if the same method was used.
3.1.2 Slow Wave Locations
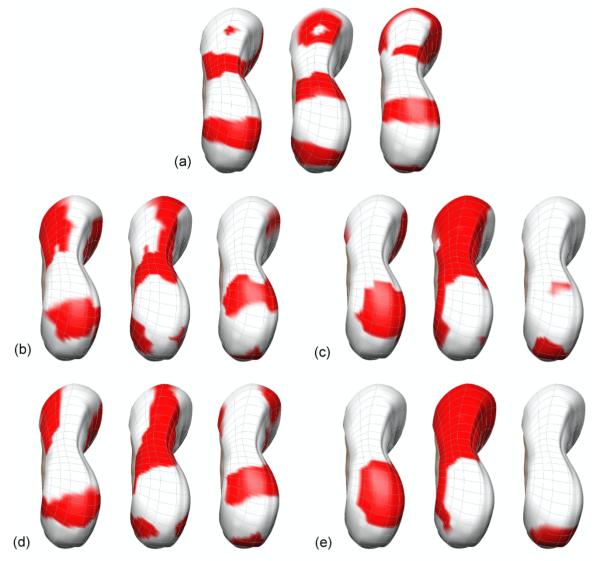
Locations of the activation waves at specific times were obtained by calculating the difference between ATs of all waves at a specific time and then choosing the minimum value of each signal. Three specific time points (21, 28 and 35 s from left to right at each case shown in figure 7) wereconsidered with results using 10% of noise level. The red regions correspond to the depolarized wave front and the white regions to the areas where the tissue was at rest.
Figure 7.
The relative activation times to a specific time at 3 time points (21, 28, 35 s) for (a) the known solution, (b)-(e) Inverse solution using 204 electrodes with (b) the Greensite-Tikhonov or (c) the Tikhonov method and using 84 electrodes with (d) the Greensite-Tikhonov or (e) the Tikhonov method. The red regions correspond to the depolarized wave front and the white regions to areas where the tissue was at rest.
At 21 s, all solutions showed the presence of the wave located closer to pylorus region. The presence of the wave in the upper-corpus region was observed only for the inverse solutions when using the Greensite-Tikhonov method (figures 7(b) and 7(d)). None of the inverse solutions were able to resolve the wave which had just initiated at the pacemaker region. At 28 s, all inverse solutions showed the wave closer to pylorus even though the wave was not clear when using Tikhonov method with 84 electrodes (figure 7(e)). The other two waves were not distinctly shown for all inverse solutions, but were best approximated when using the Greensite-Tikhonov method with 204 electrodes. At 35 s, when using the Greensite-Tikhonov method the inverse solutions showed the presence of all three waves. When using the Tikhonov method with 204 electrodes (figure 7(c)) the wave at pylorus region and a little depolarized region for the wave at the entrance of antrum region were shown. However, when using the Tikhonov method with 84 electrodes, only the wave at pylorus region was present.
Overall, the Greensite-Tikhonov method performed better than the Tikhonov method. The wave in the pacemaker region was reconstructed most poorly while the waves located closest to pylorus region was reconstructed most accurately for all methods and number of electrodes.
3.1.3 Numerical Comparisons
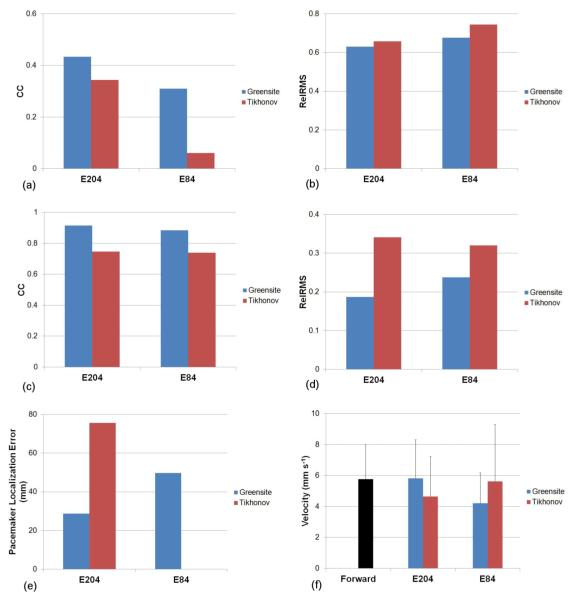
A series of simulations were conducted to investigate the stability and accuracy of the Greensite-Tikhonov and the Tikhonov inverse methods when using either 84 or 204 body surface electrodes. The potential, AT and pacemaker localization errors of the inverse solutions to the known solution and velocities of the known and the inverse solutions are illustrated in figure 8.
Figure 8.
Comparison of the accuracy of the Greensite-Tikhonov and Tikhonov inverse methods using either 84 or 204 body surface electrodes. The potential fields were compared using (a) CC and (b) Rel RMS. The activation fields were also compared using (c) CC and (d) Rel RMS. In addition, the accuracy of the (e) location of the pacemaker and the (f) velocity fields were compared.
The correlation coefficients (CC) and relative RMS errors of potentials between the known and inverse solutions are illustrated in figures 8(a) and 8(b), respectively. The inverse solutions reconstructed using the Greensite-Tikhonov method were able to better represent the known solution compared to the Tikhonov method. The Tikhonov method with 84 electrodes had the poorest reconstruction (with the largest RMS errors).
When the AT maps were compared, figures 8(c) and 8(d) showed that both inverse methods had similar values of CC or RMS of ATs when either 204 or 84 body surface electrodes were used. The correlation coefficients of the ATs were higher (while RMS was smaller) when using the Greensite-Tikhonov method than when using the Tikhonov method.
Figure 8(e) depicts pacemaker localization errors of the inverse solutions corresponding to the known solution. Results showed localization errors were less when using the Greensite-Tikhonov method with 204 or 84 electrodes than when using the Tikhonov method with 204 electrodes. However, the Tikhonov method with 84 electrodes was not able to reliably determine the pacemaker site.
Figure 8(f) compares the velocities of the slow waves in the forward and inverse solutions. The velocities were observed to be highly variable amongst different methods. The best results were obtained when using the Greensite-Tikhonov method with 204 electrodes with little difference in average velocity.
3.2 Effect of Geometric Error and Gaussian Noise
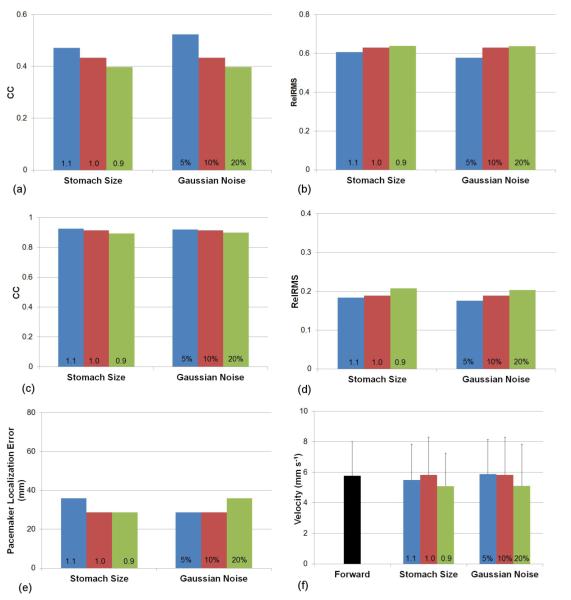
The effects of various levels geometric error and Gaussian signal noise on the Greensite-Tikhonov method are illustrated in figure 9. The size of the stomach was either increased (1.1) or decreased (0.9) by 10% compared to the default model (1.0) and 10% of Gaussian signal noise was included for all simulations. Figures 9(a) and 9(b) show the changes in potential fields, while figure 9(c) and 9(d) show the changes in ATs due to varying levels of geometric noise. In general, a smaller stomach resulted in a poorer reconstruction of the inverse solutions. Surprisingly, an increased stomach size resulted in slightly better reconstruction of potentials and activation times despite an increased localization error than when using the correct stomach geometry. When the site of initial activation was compared (figure 9(e)) enlarged stomach geometry resulted in a larger localization error, whilst the default and reduced stomach models produced similar results. There were no clear trends in velocity between the different stomach geometries, with all results less than 1 mm s-1 difference from the forward solution.
Figure 9.
Comparison of the accuracy of the Greensite-Tikhonov inverse method using 204 body surface electrodes while varying the amount of geometric noise (varying stomach size by 10%) and Gaussian signal noise. The potential fields were compared using (a) CC and (b) Rel RMS. The activation fields were also compared using (c) CC and (d) Rel RMS. In addition, the accuracy of the (e) location of the pacemaker and the (f) velocity fields were compared.
The effects of Gaussian signal noise on the accuracy of the inverse solutions was also investigated by varying the levels of signal noise by 5, 10 and 20%. Figures 9(a) and 9(b) show the changes inpotential fields, while figure 9(c) and 9(d) show the changes in ATs due to varying levels of Gaussian noise. In all cases, there was a clear trend that lower levels of signal noise resulted in more accurate inverse solutions. There was minimal difference for localization of the initial activation site or for estimation of the wave velocity when either 5 or 10% signal noise was introduced.
4. Discussion
We have presented results showing the feasibility for potential based inverse algorithms to reconstruct individual slow wave events from body surface electrograms using simulated data. This is the first known attempt to reconstruct the multiple wave fronts in the stomach from EGG signals using potential based inverse methods. The results presented here demonstrate that in the presence of Gaussian noise and sufficient body surface electrodes it is possible to resolve and identify individual wave front distributions on the surface of the stomach. In addition, a 10% change of stomach size did not have a significant effect on accuracy or stability of the inverse solutions. To date, the use of EGGs has achieved limited clinical acceptance. This has been, in part, due to the limited ability to reliably relate the EGGs to the underlying electrical activity in the stomach and to distinguish between individual wave fronts known to be present in the stomach (Verhagen et al 1999). The proposed methods provide an alternative method for non-invasively relating the measured body surface directly to the underlying stomach potentials.
The simulation study has shown that the Greensite-Tikhonov method produced the most accurate inverse solutions in the presence of Gaussian signal noise. When 204 body surface electrodes were used, it resulted in the smallest error when comparing potentials, activation times and pacemaker sites. Even when 84 electrodes were used the performance was better than when using Tikhonov method with 204 electrodes. The Tikhonov method with 84 electrodes was unable to accurately determine the pacemaker site. It should be noted that the electrode density was approximately the same when comparing the 204 and 84 electrode setup. Therefore, when more electrodes were used a larger spatial coverage of the potential fields was actually supplied. In the future, it would may be beneficial to determine the optimal electrode set that uses either more electrodes closer to the stomach (or less electrodes further away from the stomach).
The accuracy of the inverse solutions improved when more torso surface electrodes were used or when the most distal wave front was located nearer to the antrum. This may be due to the fact that the main stomach axis is oriented in the anterior/posterior direction and the body surface recordings may be strongly affected by the activity at the antrum of the stomach which is located closer to the recording electrodes (Smout et al 1980, Yoshitomi et al 1996). There was only a slight decrease in the accuracy of solutions generally observed when Gaussian signal noise levels were increased up to 20% of peak-to-peak amplitude for the Greensite-Tikhonov method with 204 electrodes. When the stomach was reduced in size by 10%, RMS errors increased 2% and the CC values decreased 3% for the potentials and ATs. Similar localization errors to the default model were observed with the reduced stomach size. Surprisingly, when the stomach was enlarged by 10% RMS errors slightly decreased, CC value slightly increased, however, the localization errors increased about 6 mm. The increase in solution accuracy despite using incorrect stomach geometry is partially counter intuitive. However, when the stomach size was further increased by 20% the solution accuracy began to decrease again. This indicated that the global RMS and CC measures may have detected some instability in the solutions due to the enlarged stomach geometry. We also showed that velocities were shown to be an unsuitable method to quantify the solution accuracy due to their high variability. This is because the calculation of the velocity vectors involves a derivative, amplifying any errors. The addition of a smoothing term in these calculations may help to stabilize the velocity calculations, although will also reduce the sensitivity when comparing different inverse methods. In summary, we found that the Greensite-Tikhonov method was able to produce accurate and stable results with up 20% signal error and 10% change in stomach geometry. In the presence of Gaussian noise, the Greensite-Tikhnov significantly out-performed the Tikhonov method.
These simulations have included number of assumptions and simplifications to reality. We assumed skin potentials in our model were only affected by Gaussian signal noise. We have assumed that appropriate filtering methods have removed other biological signals such as cardiac and respiration. We have also assumed that each gastric slow wave cycle can be accurately represented by a single dipolar source and stomach motility and movement were ignored. The simplified and idealized representation of torso models was used by two boundary element surfaces (representing the stomach and the skin surfaces). Organs such as the lungs and liver, which are in close proximity to the stomach, were not explicitly represented. However, previous studies have indicated that the inclusion of such inhomogeneity has limited effect on the resultant body surface potentials (Cheng et al 2006). In addition, errors were introduced when the activation times were derived from the potential traces. Despite these limitations, the potential-based inverse algorithms applied in this study provide a significant improvement of EGG interpretation in the presence of multiple wave fronts, which have not successfully shown yet in gastric field.
At this stage we have investigated Gaussian signal noise and change in stomach size (geometric noise) independently. Previous studies in the cardiac field have shown that geometric noise such as model geometry and position or electrode location had the largest effect upon inverse solutions. Generally, it has been known that an increased number and density of electrodes enabled accurate mapping of the inverse solution. Future studies will need to investigate the relationship between the location and number or density of electrodes and the accuracy of inverse solution. Moreover, future studies will need to investigate the effects of additional types of geometric error and the effect of combining multiple errors. While the slow waves used in this study represented only normal gastric electrical activity, this model can and should be extended to represent gastric dysrhythmias. Recent studies have observed complex and dysrhythmic electrical propagation patterns in the stomach (Lammers et al 2008, O’Grady et al 2011). Similar dysrhythmic patterns have also been observed in gastroparetic human subjects (O’Grady et al 2012). The ability to accurately distinguish between subjects with normal and abnormal gastric electrical activity will be an important advancement in screening of patients.
A critical next step involves with validating these methods experimentally, ideally by obtaining simultaneous recordings on the stomach and body surface should be conducted. Such experiments are both technically and logistically challenging and methods for recording across the whole stomach are logistically difficult. One way to achieve such data may involve measuring stomach potentials using endoscopic mucosal sensors (Coleski and Hasler 2004). However, existing techniques currently only acquire signals from few channels.
In conclusion, multiple simultaneous gastric slow waves can be reconstructed from potential based measurements on the body surface in the presence of Gaussian noise when a suitable inverse method was chosen. The proposed methods have the potential to improve the reliability of electrogastrograms and provide key insights into gastric motility disorders.
Acknowledgements
This work is supported by in part by grants from the NIH (R01 DK 64775) and the New Zealand Health Research Council. The authors would like thank Dr. Gregory O’Grady for assistance with preparing the manuscript. The authors report no conflicts of interest.
References
- Aliev RR, Richards W, Wikswo JP. A simple nonlinear model of electrical activity in the intestine. J Theor Biol. 2000;204:21–8. doi: 10.1006/jtbi.2000.1069. [DOI] [PubMed] [Google Scholar]
- Allescher HD, Abraham-Fuchs K, Dunkel RE, Classen M. Biomagnetic 3-dimensional spatial and temporal characterization of electrical activity of human stomach Dig. Dis. Sci. 1998;43:683–93. doi: 10.1023/a:1018852208687. [DOI] [PubMed] [Google Scholar]
- Alvarez WC. The electrogastrogram and what it shows. JAMA. 1922;78:1116–9. [Google Scholar]
- Bortolotti M, Sarti P, Barara L, Brunelli F. Gastric myoelectrical activity in patients with chronic idiopathic gastroparesis. J Gastroint Motil. 1990;2:104–8. [Google Scholar]
- Bradshaw LA, Irimia A, Sims JA, Gallucci MR, Palmer RL, Richards WO. Biomagnetic characterization of spatiotemporal parameters of the gastric slow wave. Neurogastroenterol. Motil. 2006;18:619–31. doi: 10.1111/j.1365-2982.2006.00794.x. [DOI] [PubMed] [Google Scholar]
- Bradshaw LA, Cheng LK, Richards WO, Pullan AJ. Surface current density mapping for identification of gastric slow wave propagation. IEEE Trans. Biomed. Eng. 2009;56:2131–9. doi: 10.1109/TBME.2009.2021576. [DOI] [PMC free article] [PubMed] [Google Scholar]
- Buist ML, Cheng LK, Sanders KM, Pullan AJ. Multiscale modelling of human gastric electric activity: can the electrogastrogram detect functional electrical uncoupling? Exp. Physiol. 2006;91:383–90. doi: 10.1113/expphysiol.2005.031021. [DOI] [PubMed] [Google Scholar]
- Camilleri M, Hasler WL, Parkman HP, Quigley EMM, Soffer E. Measurement of gastrointestinal motility in GI laboratory. Gastroenterlogy. 1998;115:747–62. doi: 10.1016/s0016-5085(98)70155-6. [DOI] [PubMed] [Google Scholar]
- Chang FY, Lu CL, Chen CY, et al. Real-time display of stomach slow wave and its parameters in a newly designed electrogastrographic system. J. Gastroenterol. Hepatol. 2001;36:10–7. doi: 10.1007/s005350170148. [DOI] [PubMed] [Google Scholar]
- Chang FY. Electrogastrography: basic knowledge, recording, processing and its clinical applications. J Gastroenterol Hepatol. 2005;20:502–16. doi: 10.1111/j.1440-1746.2004.03751.x. [DOI] [PubMed] [Google Scholar]
- Cheng LK, Bodley JM, Pullan AJ. Comparison of potential and activation based formulations for the inverse problem of electrocardiology. IEEE Trans. Biomed. Eng. 2003;50:11–22. doi: 10.1109/TBME.2002.807326. [DOI] [PubMed] [Google Scholar]
- Cheng LK, Sands GB, French RA, Withy SJ, Wong SP, Legget ME, Smith WM, Pullan AJ. Rapid construction of a patient specific torso model from 3D ultrasound for noninvasive imaging of cardiac electrophysiology. Med. Biol. Eng. Comput. 2005;43:325–30. doi: 10.1007/BF02345808. [DOI] [PubMed] [Google Scholar]
- Cheng LK, Buist ML, Richards WO, Bradshaw LA, Pullan AJ. Noninvasive localization of gastric electrical activity. Int. J. Bioelectromagnetism. 2005a;7:1–4. [Google Scholar]
- Cheng LK, Buist ML, Pullan A. Anatomically realistic torso model for studying the relative decay of gastric electrical and magnetic fields; Proceedings of the 28th IEEE EMBS Annual International Conference; New York City, USA. 2006; pp. 3158–61. [DOI] [PubMed] [Google Scholar]
- Coleski R, Hasler WL. Directed endoscopic mucosal mapping of normal and dysrhythmic gastric slow waves in healthy humans. Neurogastroenterol Motil. 2004;16:557–65. doi: 10.1111/j.1365-2982.2004.00542.x. [DOI] [PubMed] [Google Scholar]
- Du P, O’Grady G, Egbuji JU, Lammers WJ, Budgett D, Nielsen P, Windsor JA, Pullan AJ, Cheng LK. High-resolution mapping of in vivo gastrointestinal slow wave activity using flexible printed circuit board electrodes: methodology and validation Ann. Biomed Eng. 2009;37:839–46. doi: 10.1007/s10439-009-9654-9. [DOI] [PMC free article] [PubMed] [Google Scholar]
- Du P, O’Grady G, Cheng LK, Pullan AJ. A multiscale model of the electrophysiological basis of the human electrogastrogram. Biophys. J. 2010;99:2784–92. doi: 10.1016/j.bpj.2010.08.067. [DOI] [PMC free article] [PubMed] [Google Scholar]
- Greensite F, Huiskamp G. An Improved Method for Estimating Epicardial Potentials from the Body Surface. IEEE Trans. Biomed, Eng. 1998;45:98–104. doi: 10.1109/10.650360. [DOI] [PubMed] [Google Scholar]
- Greensite F. Myocardial Activation Imaging Advances. In: Johnston P, editor. computational Biomedicine. Vol. 5. WIT Press; Southampton, UK: 2001. pp. 143–90. [Google Scholar]
- Han C, Liu Z, Zhang X, Pogwizd S, He B. Noninvasive three-dimensional cardiac activation imaging from body surface potential maps: A computational and experimental study on a rabbit model. IEEE Trans. Med.Imaging. 2008;27:1622–30. doi: 10.1109/TMI.2008.929094. [DOI] [PMC free article] [PubMed] [Google Scholar]
- Hansen PC, O’Leary DP. The use of the L-curve in the regularization of discrete ill-posed problems. SIAM Journal on Scientific Computing. 1993;14:1487–503. [Google Scholar]
- Hinder RA, Kelly KA. Human gastric pacesetter potential. Site of origin, spread, and response to gastric transection and proximal gastric vagotomy. American Journal of Surgery. 1977;133:29–33. doi: 10.1016/0002-9610(77)90187-8. [DOI] [PubMed] [Google Scholar]
- Kim JHK, Bradshaw LA, Pullan AJ, Cheng LK. Characterization of gastric electrical activity using magnetic field measurements: A simulation study Annals. Biomed. Eng. 2010;38:177–86. doi: 10.1007/s10439-009-9804-0. [DOI] [PMC free article] [PubMed] [Google Scholar]
- Koch KL, Stern RM. Electrogastrographic data acquisition and analysis. In: Chen JZ, McCallum RW, editors. Electrogastrography: Principles and Applications. Raven Press; New York: 1994. pp. 31–44. [Google Scholar]
- Komuro R, Qiao W, Pullan AJ, Cheng LK. Effects of volume conductor and source configuration on simulated magnetogastrograms. Phys. Med. Biol. 2010;55:6881–95. doi: 10.1088/0031-9155/55/22/018. [DOI] [PMC free article] [PubMed] [Google Scholar]
- Lammers WJEP, ver Donck L, Stephen B, Smets D, Schuurkes JA. Focal activities and re-entrant propagations as mechanisms of gastric tachyarrhythmias. Gastroenterology. 2008;135:1601–11. doi: 10.1053/j.gastro.2008.07.020. [DOI] [PubMed] [Google Scholar]
- Lammers WJ, Ver Donck L, Stephen B, Smets D, Schuurkes JA. Origin and propagation of the slow wave in the canine stomach: the outlines of a gastric conduction system. Am. J. Physiol. Gastrointest. Liver Physiol. 2009;296:1200–10. doi: 10.1152/ajpgi.90581.2008. [DOI] [PubMed] [Google Scholar]
- Leahy A, Besherdas K, Clayman C, Mason I, Epstein O. Abnormalities of the electrogastrogram in functional gastrointestinal disorders. Am J Gastroenterol. 1999;94:1023–8. doi: 10.1111/j.1572-0241.1999.01007.x. [DOI] [PubMed] [Google Scholar]
- Leahy A, Besherdas K, Clayman C, Mason I, Epstein O. Gastric dysrhythmias occur in gastrooesophageal reflux disease complicated by food regurgitation but not in uncomplicated reflux. Gut. 2001;48:212–5. doi: 10.1136/gut.48.2.212. [DOI] [PMC free article] [PubMed] [Google Scholar]
- Liang J, Cheung JY, Chen JD. detection and deletion of motion artifacts in electrogastrogram using feature and neural networks. Ann. Biomed. Eng. 1997;25:850–7. doi: 10.1007/BF02684169. [DOI] [PubMed] [Google Scholar]
- Liu Z, Liu C, He B. Noninvasive reconstruction of three-dimensional ventricular activation sequence from the inverse solution of distributed equivalent current density. IEEE Trans. Med. Imaging. 2006;25:1307–18. doi: 10.1109/tmi.2006.882140. [DOI] [PubMed] [Google Scholar]
- Messinger-Rapport BJ, Rudy Y. Noninvasive recovery of epicardial potentials in a realistic heart-torso geometry Normal sinus rhythm. Circ Res. 1990;66:1023–39. doi: 10.1161/01.res.66.4.1023. [DOI] [PubMed] [Google Scholar]
- O’Grady G, Du P, Cheng L, Egbuji JU, Lammers WJ, Windsor JA, Pullan AJ. The origin and propagation of human gastric slow wave activity defined by high-resolution mapping. Am. J. Physiol. Gastrointest. Liver Physiol. 2010;299:582–92. doi: 10.1152/ajpgi.00125.2010. [DOI] [PMC free article] [PubMed] [Google Scholar]
- O’Grady G, Egbuji JU, Peng D, Lammers WJEP, Cheng LK, Windsor JA, Pullan AJ. High-resolution spatial analysis of slow wave initiation and conduction in porcine gastric dysrhythmias. Neurogastroenterol Motil. 2011;23:e345–55. doi: 10.1111/j.1365-2982.2011.01739.x. [DOI] [PMC free article] [PubMed] [Google Scholar]
- O’Grady G, Angeli TR, Du P, Lahr C, Lammers WJ, Winsor JA, Farrugia G, Abell T, Pullan AJ, Cheng LK. Aberrant initiation and conduction of slow wave activity in gastroparesis defined by high-resolution electrical mapping. Gastroenterology. 2012 doi: 10.1053/j.gastro.2012.05.036. Submitted. [DOI] [PMC free article] [PubMed] [Google Scholar]
- Pullan AJ, Cheng LK, Nash MP, Bradley CP, Paterson DJ. Noninvasive electrical imaging of the heart: Theory and model development. Ann. Biomed. Eng. 2001;29:817–36. doi: 10.1114/1.1408921. [DOI] [PubMed] [Google Scholar]
- Ramanathan C, Ghanem RN, Jia P, Ryi K, Rudy Y. Noninvasive electrocardiographic imaging for cardiac electrophysiology and arrhythmia. Nat. Med. 2004;10:422–8. doi: 10.1038/nm1011. [DOI] [PMC free article] [PubMed] [Google Scholar]
- Smout AJ, van der Schee EJ, Grashuis JL. What is measured in electrogastrography? Dig. Dis. Sci. 1980;25:179–87. doi: 10.1007/BF01308136. [DOI] [PubMed] [Google Scholar]
- Spitzer V, Ackerman MJ, Scherzinger AL, Whitlock D. The visible human male: a technical report. J. Am. Med. Inform. Assoc. 1996;3:118–30. doi: 10.1136/jamia.1996.96236280. [DOI] [PMC free article] [PubMed] [Google Scholar]
- Verhagen MAMT, van Schelven LJ, Samsom M, Smout AJPM. Pitfalls in the analysis of electrogastrographic recordings. Gastroenterology. 1999;177:453–60. doi: 10.1053/gast.1999.0029900453. [DOI] [PubMed] [Google Scholar]
- Yoshitomi S, Martin A, Murat J, Yamamoto M, Tanaka T, Ohshio G, Manabe T, Imamura M. Electrogastroenterographic examination of 22 patients before and after cholecystectomy. Dig. Dis. Sci. 1996:411700–5. doi: 10.1007/BF02088733. [DOI] [PubMed] [Google Scholar]


