

Abstract
Vitamin D is important for bone health, with low vitamin D levels being associated with skeletal fragility and fractures. Among its other biological activities, 1,25-dihydroxyvitamin D (1,25(OH)2D), stimulates the in vitro differentiation of human marrow stromal cells (hMSCs) to osteoblasts, which can be monitored by increases in Alkaline Phosphatase enzyme activity or osteocalcin gene expression. In this study, we tested the hypotheses that age and clinical attributes of subjects influence in vitro responsiveness of hMSCs to 1,25(OH)2D3. In a cohort of subjects whose hMSCs were isolated from bone marrow discarded during hip replacement surgery for osteoarthritis, there were significant inverse correlations with age for bone mineral density, renal function, body mass index, fat mass index, and lean mass index (n=36–53). There were significant correlations with serum 25(OH)D for serum PTH, body mass index, fat mass index, and lean mass index (n=47–50). In vivo-in vitro correlation analyses indicated that there were significantly greater in vitro effects of 1,25(OH)2D3 to stimulate osteoblast differentiation in hMSCs obtained from subjects who were younger than 65 years of age, or who had serum 25(OH)D ≤20 ng/mL, elevated serum PTH, or better renal function, assessed by estimated glomerular filtration rate. The greater in vitro stimulation of osteoblast differentiation by 1,25(OH)2D3 in hMSCs from vitamin D-deficient subjects suggests that vitamin D repletion may lead to more vigorous bone formation in subjects at risk.
Keywords: MARROW STROMAL CELLS, OSTEOBLAST DIFFERENTIATION, AGE, VITAMIN D, eGFR
Introduction
Clinical risk factors, low bone density, and an imbalance in bone remodeling contribute to increased fracture risk (1–3). Skeletal homeostasis is achieved through tissue remodeling by bone-resorbing osteoclasts and bone-forming osteoblasts. Many factors contribute to an imbalance of bone resorption and formation resulting in bone loss, including aging, low body mass index (BMI), and medical disorders such as hyperparathyroidism or renal insufficiency. Both aging and vitamin D-deficiency are associated with reduced bone density, osteoporosis, and increased risk of fragility fractures. We reported extreme vitamin D-deficiency in community-dwelling US women presenting with hip fracture (4). Whereas chronic vitamin D-deficiency causes impaired mineralization and osteomalacia, it may also contribute to reductions in bone formation and strength. Elucidation of the relative importance of clinical risk factors on bone formation in humans may lead to improved preventive and therapeutic strategies for osteoporosis (5).
Human marrow-derived stromal cells (hMSCs), also known as mesenchymal stem cells, are precursors of several mesenchymal cellular lineages, including osteoblasts (6–8). We (9–12) and others (13, 14) showed an age-dependent decline in osteoblast potential of hMSCs that may contribute to human skeletal aging. We found that other in vitro properties of hMSCs vary with the age of the subjects from whom the cells were obtained, including proliferation potential (10), production of cytokines (15, 16), expression of WNT genes (17), expression of the Parathyroid Hormone (PTH) receptor, and PTH signaling and osteoanabolic effects (11).
It is known that 1,25-dihydroxyvitamin D (1,25(OH)2D) stimulates the in vitro differentiation of hMSCs to osteoblasts (18). Finding that osteoblast differentiation was also stimulated by 25-hydroxyvitamin D3 (25OHD3) led to the discoveries that hMSCs have the capacity to enzymatically activate 25OHD3 to 1,25(OH)2D3 with CYP27B1/1α-hydroxylase (19), and that CYP27B1 is necessary for 25OHD3’s anti-proliferative and pro-differentiation actions in hMSCs (20). The constitutive level of expression of CYP27B1 in hMSCs in vitro was related to the vitamin D status (19) and age (12) of the subjects from whom these cells were obtained. Less is known, however, about the effect of age, BMI, adiposity, renal function, or other clinical characteristics on in vitro differentiation of osteoblasts. Given the importance of these clinical risk factors, and recent debates about the level of 25OHD optimal for bone health, translational studies that bridge in vivo clinical attributes with in vitro regulation of osteoblast formation provide a unique approach to identify factors that contribute to reduced bone mass in humans. In this study, we investigated the effects of age, serum 25OHD, 1,25(OH)2D, PTH, estimated glomerular filtration rate (eGFR), body mass index (BMI), and new standardized indices of fatand lean mass [fat mass index (FMI-fat mass/height2); lean mass index (LMI-lean mass/height2)] on in vitro hMSCs responsiveness to 1,25(OH)2D3.
Materials and Methods
Subjects and Clinical Characteristics
Bone marrow samples were obtained from discarded femoral tissue obtained during primary arthroplasty for osteoarthritis as previously described (19), through an institutional review board (IRB) approved study. Subjects were excluded if they were taking medications or had co-morbid conditions that could affect skeletal metabolism, including rheumatoid arthritis. A total of 53 subjects (aged 41–83 years, 21 men and 32 women) scheduled for hip arthroplasty were enrolled in this study; some data were not available for different subjects. Bone mineral density (BMD) of the spine (L1–L4) and proximal femur, and body composition were measured by dual X-ray absorptiometry (DXA) (Discovery H, Hologic Inc., Bedford, MA) in the Skeletal Health and Osteoporosis Center (19). Body composition values were analyzed with APEX Software Version 3.3 that allows calculation of fat and lean mass indices, FMI and LMI (47). FMI values were characterized according to new gender and age-specific thresholds from the NHANES database. Thresholds for individuals categorized as overweight (BMI >25 kg/m2) are set at FMI >6 kg/m2 for males and >9 kg/m2 for females, and thresholds for obesity (BMI>30 kg/m2) are >9 kg/m2 for males and >13 kg/m2 for females (48). CV% for fat and lean tissue measures in the Bone Density Unit were 1.09 ± 0.15% and 0.89 ± 0.28% (46). Blood chemistry tests, including measurements of serum 25OHD, 1,25(OH)2D, and PTH, and complete blood counts, were performed in hospital clinical laboratories or the Harvard Catalyst Core Laboratory as recently described (19). eGFR was estimated according to the Modification of Diet in Renal Disease (MDRD) Study equation [GFR (mL/min/1.73 m2) = 175 × (Scr)−1.154 × (Age)−0.203 × (0.742 if female) × (1.212 if African American) (conventional units)]. An additional set of bone marrow samples that were used for osteoblast differentiation experiments was obtained as discarded tissue from 13 de-identified individuals with IRB approval and the same pre-operative exclusion criteria.
Preparation of hMSCs
Low-density marrow mononuclear cells were isolated by centrifugation on Ficoll/Histopaque 1077 (Sigma, MO) (42). This procedure removes differentiated cells and enriches for undifferentiated, low-density marrow mononuclear cells that include a fraction of non-adherent hematopoietic cells and a fraction capable of adherence and differentiation into musculoskeletal cells. Adherent human MSCs were expanded at 37°C with 5% CO2 in monolayer culture with phenol red-free α-MEM medium, 10% Fetal Bovine Serum-Heat Inactivated (FBS-HI), 100 U/mL penicillin, and 100 μg/mL streptomycin (Invitrogen, Carlsbad, CA) as previously described (10). In some cases, MSCs were expanded in Dulbecco’s modified Eagle medium (DMEM), 10% FBS (Atlanta Biologicals, Norcross, GA), 100 U/mL penicillin, 100 μg/mL streptomycin and 292 μg/mL L-glutamine (Irvine Scientific).
Alkaline Phosphatase Enzyme Assay
Cells were cultured in triplicate in 12-well-plates in α-MEM with 10% FBS-HI until confluence; this required different times depending upon rates of proliferation. Upon confluence, medium was changed to osteogenic medium (α-MEM with 1% FBS-HI, 100 U/mL penicillin, 100 μg/mL streptomycin plus 10 nM dexamethasone, 5 mM β-glycerophosphate, 50 μg/mL ascorbate-2-phosphate) for 7 or 14 days. Some were supplemented with 10 nM 1,25(OH)2D3 (Sigma). Alkaline phosphatase (ALP) enzyme activity was measured after 7 or 14 days treatment; other cells were stained at day 14 with an alkaline phosphatase kit (86R, Sigma, MO) (39), or assayed at day 7 for ALP enzyme activity and was shown as μmol/min/g protein as previously described (42). Effects of 1,25(OH)2D3 are presented as relative to control.
Another set of MSCs from 13 men was also assessed for osteoblast differentiation. The medium was changed to an osteoblastogenic media containing DMEM, 10% FBS (Atlanta Biologicals), 5 mM β-glycerophosphate (Sigma, St. Louis, MO), and 170 μM ascorbic phosphate (WAKO, Osaka, Japan). Some were supplemented with 10 nM Dexmethasone and/or 10 nM 1,25(OH)2D3 (Sigma). After six days, alkaline phosphatase (ALP) activity was measured colorimetrically.
Matrix Mineralization Assay
For each sample assayed for mineralization, hMSCs were seeded in triplicate in 12-well-plates or quadruplicate in 24-well-plates in α-MEM with 10% FBS-HI. Upon confluence, the medium was replaced with osteogenic medium with or without 10 nM of 1,25(OH)2D3. Mineralization was assayed after 21 days with Alizarin red S staining; quantitative data are presented as nmole/well of Alizarin Red S (11).
RNA Isolation and RT-PCR
Total RNA was isolated from human MSCs with Trizol reagent (Invitrogen). For RT-PCR, 2 μg of total RNA was reverse-transcribed into cDNA with MMLV (Promega, WI), following the manufacturer’s instructions. One-twentieth of the cDNA was used in each 50 μL PCR reaction (30–40 cycles of 94° C for 1 minute, 55–60° C for 1 minute, and 72° C for 2 minutes) as described (42). The gene-specific primers for human Osteocalcin (43), IGF-I (44) and IGF-BP3 (45) were used for amplification. Concentration of cDNA and amplification conditions were optimize to reflect the exponential phase of amplification. Data were expressed by normalization of densitometric units to that for GAPDH (internal control) as described (10, 42).
Statistical Analyses
All experiments were performed at least in triplicate. Group data are presented as mean values ± SD. Unless otherwise indicated, quantitative data were analyzed with non-parametric tools, either the Mann-Whitney test for group comparisons or Spearman correlation test. If data allowed, parametric tools were used, either t-test for two group or one-way ANOVA for multiple group comparisons or Pearson correlation test. A value of p<0.05 was considered significant.
Results
Clinical attributes of the study subjects
There were 53 consented subjects, from whom MSCs were isolated from bone marrow discarded during orthopedic surgery (Table 1). The mean age was 65 years ± 10, ranging from 41–83 years. There were 21 men (65.0 ± 10.6 years) and 32 women (65.7 ± 10.3 years). There were wide ranges of values for serum 25OHD, 1,25(OH)2D, parathyroid hormone (PTH), estimated glomerular filtration rate (eGFR), body mass index (BMI), fat mass index (FMI), lean mass index (LMI), bone mineral density (BMD) of whole body (WB), femoral neck (FN) or femoral total (F-Tot), and BMD T-scores (Table 1). We found that 15% of the subjects had low 25OHD levels and were classified as vitamin D-deficient (≤20 ng/mL serum 25OHD), that 45% were “insufficient” with level from 21 to 29 ng/mL, and that 40% were vitamin D sufficient (≥30 ng/mL) (21).
Table 1.
Characteristics of the study subjects
| Mean±SD | Range | n | |
|---|---|---|---|
| Age (years) | 65±10 | 41–83 | 53 |
| 25OHD (ng/mL) (20–57) | 30.1±11.0 | 7.6–64.9 | 46 |
| 1,25(OH)2D (pg/mL) (18–62) | 42.3±13.0 | 20–71 | 44 |
| PTH (pg/mL) (10–65) | 36.4±15.0 | 3.3–83.7 | 47 |
| eGFR (mL/min/1.73m2) (>60) | 83.7±18.0 | 40–125 | 37 |
| BMD (FN) (g/cm2) | 0.82±0.17 | 0.51–1.28 | 42 |
| BMD (FN) T Score | −0.64±0.17 | −3.1–3.8 | 42 |
| BMD (WB) (g/cm2) | 1.2±0.2 | 1.0–1.8 | 49 |
| BMD (WB) T Score | 1.0±1.7 | −1.4 to 7.5 | 49 |
| BMI (kg/m2) | 28.8±7.2 | 19.9–49.3 | 53 |
| FMI (kg/m2) | 11.4±5.4 | 1.0–28.8 | 51 |
| LMI (kg/m2) | 15.6±2.3 | 11.3–21.9 | 51 |
Relationships for age and vitamin D status with clinical attributes of the study subjects
There was an inverse correlation between T-score for whole body BMD and age (r=−0.32, p=0.024, n=49; Fig. 1A), but there was only a trend for an effect of age on whole body BMD (gm/cm2; r=−0.25, p=0.077, n=49; Table 2). There were inverse relationships with age for BMD (r=−0.32, p=0.037, n=42; Table 2) and T-score at the femoral neck (FN, r=−0.44, p=0.0038, n=42; Fig. 1B) and a trend for an inverse correlation between total hip BMD and age (r=−0.28, p=0.084, n=39). There was an inverse correlation between estimated glomerular filtration rate (eGFR), an index of renal function, and age (r=−0.36, p=0.032, n=36; Fig. 1C). There were no effects of age (Table 2) or gender on serum 25OHD. There were significant inverse correlations with age for body mass index, BMI (Pearson r=−0.37, p=0.0065, n=53; Fig. 1D), FMI (r=−0.43, p=0.0018, n=51; Fig. 1E), and LMI (r=−0.35, p=0.011, n=51; Fig. 1F).
Fig. 1.

Effects of age on clinical attributes of study subjects. (A) There was an inverse correlation between Whole Body (WB) BMD T-score and age (r=−0.32, p=0.024, n=49). (B) There was an inverse correlation between femoral neck (FN) BMD T-score and age (r=−0.44, p=0.0038, n=42). (C) There was an inverse correlation between eGFR and age (r=−0.36, p=0.032, n=36). There were significant inverse correlation with age for (D) BMI (r=−0.37, p=0.0065, n=53), (E) FMI (r=−0.43, p=0.0018, n=51), and (F) LMI (r=−0.35, p=0.011, n=51). Pearson correlations were used in the Statistical Analyses.
Table 2.
Correlations for age, serum 25OHD, and ALP with other clinical parameters
| Age | s25OHD | s1,25(OH)2D | sPTH | eGFR | BMD (FN) | BMD (FN) T-score | BMD (WB) | BMD (WB) T-score | BMI | FMI | LMI | |
|---|---|---|---|---|---|---|---|---|---|---|---|---|
| Age | r=−0.027 | 0.037 | −0.065 | −0.36 | −0.32 | −0.44 | −0.25 | −0.32 | −0.37 | −0.43 | −0.35 | |
| p=0.86 | 0.81 | 0.66 | 0.032 | 0.037 | 0.0038 | 0.077 | 0.024 | 0.0065 | 0.0018 | 0.011 | ||
| n=47 | 44 | 47 | 36 | 42 | 42 | 49 | 49 | 53 | 51 | 51 | ||
|
| ||||||||||||
| s25OHD | 0.15 | −0.29 | 0.13 | 0.012 | 0.060 | 0.14 | 0.36 | −0.41 | −0.30 | −0.32 | ||
| 0.34 | 0.05 | 0.45 | 0.94 | 0.71 | 0.34 | 0.066 | 0.0029 | 0.033 | 0.023 | |||
| 44 | 47 | 36 | 41 | 41 | 46 | 27 | 50 | 50 | 50 | |||
|
| ||||||||||||
| ALP (1,25(OH)2D3/Control) | −0.18 | −0.36 | 0.10 | 0.49 | 0.37 | 0.059 | 0.11 | 0.35 | 0.39 | −0.017 | 0.17 | 0.11 |
| 0.19 | 0.03 | 0.55 | 0.0016 | 0.039 | 0.74 | 0.54 | 0.038 | 0.018 | 0.92 | 0.30 | 0.53 | |
| 53 | 37 | 36 | 38 | 31 | 33 | 33 | 36 | 36 | 36 | 37 | 36 | |
r: Pearson correlation coefficient, p: two-tailed p value, n: number of subjects.
ALP – Alkaline Phosphatase activity of hMSCs in vitro.
As expected, serum 25OHD was inversely correlated with serum PTH (r=−0.29, p=0.05, n=47); there were no correlations for 25OHD with BMD or serum 1,25(OH)2D for this cohort (Table 2). In addition, there were significant inverse correlations with serum 25OHD for BMI (r=−0.41, p=0.0029, n=50), FMI (r=−0.30, p=0.033, n=50), and LMI (r=−0.32, p=0.023, n=50) (Table 2, Fig. 2).
Fig. 2.

Correlations between body composition indices and serum 25OHD. There were significant correlations between serum 25OHD and (A) body mass index, BMI (Pearson, r=−0.41, p=0.0029, n=50), (B) FMI (r=−0.30, p=0.033, n=50), and (C) LMI (r=−0.32, p=0.023, n=50).
There were significant correlations for whole body BMD with BMI (Pearson, r=0.34, p=0.020, n=46) and LMI (r=0.60, p<0.0001, n=45), but not with FMI (r=0.15, p=0.33, n=45) (Fig. 3); this suggests that the association between BMI and BMD is mainly due to LMI. Although FMI was not correlated with BMD, applying the new gender-based thresholds for FMI (22) showed that the mean BMD of obese subjects (n=23) (FMI > 9 for men, >13 for women) was significantly higher than for over-weight subjects (n=13) (FMI >6 to 9 for men, >9 to 13 for women) (p<0.05, ANOVA), and for normal weight subjects (n=11) (FMI from 3 to 6 for men, from 5 to 9 for women) (p<0.05, ANOVA; Fig. 3D).
Fig. 3.

Correlations between Whole Body (WB) BMD and body composition indices. (A) There was a significant correlation between WB BMD and body mass index (BMI) (Pearson, r=0.34, p=0.020, n=46). (B) There was a significant correlation between WB BMD and lean mass index (LMI) (r=0.60, p<0.0001, n=45). (C) There was no apparent relationship between WB BMD and fat mass index (FMI). (D) Gender-specific FMI classification of normal, over-weight, and obese subjects revealed that WB BMD of obese subjects (n=23) was significantly higher than over-weight subjects (n=13) (p<0.05, ANOVA) and normal weight subjects (n=11) (p<0.05, ANOVA).
The in vitro effects of 1,25(OH)2D3 on osteoblastogenesis of hMSCs
After the hMSCs reached confluence, medium was changed to MEM-α with 1% FBS-HI plus osteogenic supplements (10 nM dexamethasone, 5 mM β-glycerophosphate, 50 μg/mL ascorbate-2-phosphate) for assessment of osteoblast differentiation. Representative studies showed that 1,25(OH)2D3 (10 nM) significantly stimulated ALP histochemical staining (Fig. 4A), and that there was a dose-dependent stimulation of ALP enzymatic activity (Fig. 4B). There was an average 160% increase in ALP activity with 10 nM 1,25(OH)2D3 in hMSCs from 53 subjects (Table 3). Further, after 21 days culture, 1,25(OH)2D3 (10 nM) significantly enhanced matrix accumulation of mineral (Fig. 4 C&D). There was an average 260% increase in mineral accumulation with 10 nM 1,25(OH)2D3 in hMSCs from 22 subjects (Table 3).
Fig. 4.

Stimulation of in vitro osteoblastogenesis of hMSCs by 1,25(OH)2D3. (A) Photograph shows that 10 nM 1,25(OH)2D3 stimulated histoenzymatic stain for alkaline phosphatase (ALP, MSCs obtained from a 37-year-old woman) 14 days after transfer to osteoblastogenic medium. (B) In a dose-dependent manner, 1,25(OH)2D3 stimulated alkaline phosphatase enzymatic activity (hMSCs from a 63-year-old woman) 7 days after transfer to osteoblastogenic medium (*p<0.05, 1 nM of 1,25(OH)2D3 treatment vs. control; **p<0.01, nM of 1,25(OH)2D3 vs. control). (C) Photograph shows that 10 nM 1,25(OH)2D3 stimulated Alizarin red stain for matrix mineralization (hMSCs from a 66-year old woman) 21 days after transfer to osteoblastogenic medium, (D) with statistical significance (***p<0.001, 1,25(OH)2D3 vs. control, Mann-Withney U-test).
Table 3.
The effects of 1,25(OH)2D3 on osteoblastogenesis and mineralization of hMSCs
| Osteogenic markers | % Difference (1,25(OH)2D3 vs. control) | Mean±SD (%) | Statistic* |
|---|---|---|---|
| Alkaline Phosphatase (Enzyme Assay) | 72.6–438 | 158.9±68.9 | P<0.0001, n=53 |
| Mineralization (Alizarin red) | 45.0–2020.0 | 257.3±433.5 | P=0.011, n=22 |
| Osteocalcin | 110.1–6612.0 | 1742.2±1682.9 | P<0.0001, n=28 |
| IGF-I | 82.0–229.0 | 137.6±32.0 | P<0.0001, n=21 |
| IGF-BP3 | 100.0–370.0 | 175.8±66.2 | P<0.0001, n=44 |
paired t test.
Effects of age on 1,25(OH)2D3 stimulation of osteoblastogenesis in hMSCs
A pilot study with a set of samples from 13 men (age range 27 – 79 yrs) showed that constitutive ALP activity in basal culture medium was low (Fig. 5). Osteoblastogenic supplements were added separately for assessment of osteoblast differentiation. A representative study showed that Dex (10 nM) ± 1,25(OH)2D3 (10 nM) significantly stimulated ALP activity in hMSCs (Fig. 5A). With this series of samples, Dex stimulated ALP (mean 266%, range 111–615%) and 1,25(OH)2D3 further stimulated ALP activity (mean 457%, range 85–1135%). There was a striking inverse correlation with age for the magnitude of stimulation of ALP enzymatic activity by 1,25(OH)2D3 plus Dex (r=−0.803, p=0.0009; Fig. 5).
Fig. 5.

Effects of age on in vitro responsiveness of hMSCs to 1,25(OH)2D3. (A) Dexamethasone (10 nM) and 1,25-dihydroxyvitamin D3 (10 nM) significantly stimulated alkaline phosphatase (ALP) activity in hMSCs (27-year-old woman, *p<0.05, Dex vs. Basal; ***p<0.001 1,25(OH)2D3+Dex vs. Basal; ***p<0.001 1,25(OH)2D3+Dex vs. Dex, n=6, ANOVA). (B) There was an age-related decline in in vitro ALP activity in response to 1,25(OH)2D3+Dex relative to Basal (n=13 men, 27–79 years-old)(Spearman, r=−0.803, p=0.0009). (C) There was an age-related decline in in vitro ALP activity in response to 1,25(OH)2D3+Dex relative to Dex (Spearman, r=−0.57, p=0.0412).
With a larger set of samples from well-characterized, enrolled subjects, there was an inverse correlation between stimulation of ALP enzymatic activity by 1,25(OH)2D3 and subject age with hMSCs obtained from subjects >55-year-old (r=−0.46, p=0.032, n=46; Pearson correlation) (Fig. 6A). The effects of 1,25(OH)2D3 on osteoblast differentiation were also monitored by changes in expression of osteoblast signature genes. Assessment of effects on expression of early osteoblast signature genes (day 2) showed that 1,25(OH)2D3 significantly upregulated IGF-I (138% ± 32, p<0.0001, n=21) and IGFBP-3 (176% ± 66, p<0.0001, n=44; Table 3). After 14 days in osteogenic media, 1,25(OH)2D3 stimulated osteocalcin (OC) gene expression (1742% ± 1683, n=28; Fig 6B). There was an inverse correlation between magnitude of upregulation of OC by 1,25(OH)2D3 and subject age (r=−0.56, p=0.0019, n=28; Fig. 6C). There was 33% greater expression of OC in hMSCs obtained from younger subjects (< 65-years) subjects (25.9 ± 18.4, n=13) than in hMSCs from older (≥ 65-years) subjects (7.8 ± 5.3, n=15, p=0.0045, t-test).
Fig. 6.
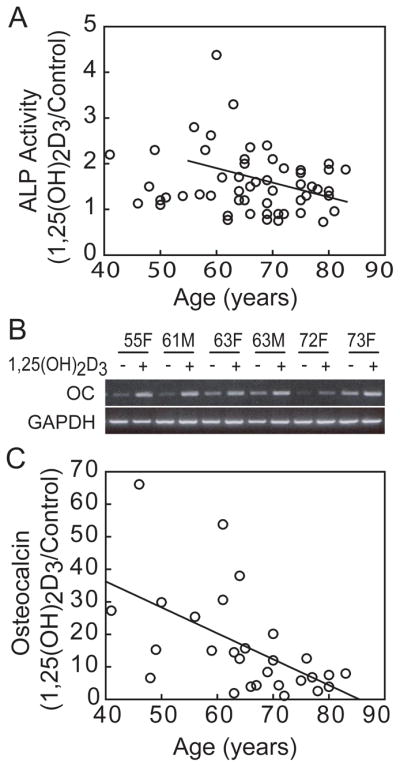
Effects of age on in vitro responsiveness of hMSCs to 1,25(OH)2D3. (A) There was an inverse correlation between in vitro ALP activity in response to 10 nM 1,25(OH)2D3 and subject age for hMSCs obtained from subjects older than 55 years (r=−0.46, p=0.032, n=46; Pearson correlation). (B) Electrophoretogram shows effect of 10 nM 1,25(OH)2D3 on expression of osteocalcin (OC) 14 days after transfer to osteoblastogenic medium in 6 representative samples. (C) There was an inverse correlation between the magnitude of stimulation of osteocalcin gene expression by 1,25(OH)2D3 and subject age (Pearson, r=−0.56, p=0.0019, n=28).
In vivo attributes that influence in vitro stimulation of osteoblastogenesis by 1,25(OH)2D3
To test the hypothesis that clinical parameters of these subjects affected the osteoblastogenic response of hMSCs to 1,25(OH)2D3 in vitro, we performed correlation analyses for the stimulation of 1,25(OH)2D3 on ALP activity with clinical attributes of the individual from whom the hMSCs were obtained (Fig. 7 and Table 2). There was significantly greater responsiveness to 1,25(OH)2D3 for hMSCs obtained from subjects who had lower serum 25(OH)D (r=−0.36, p=0.03, n=37; Fig. 7A). Osteoblastogenesis was stimulated to a greater degree by 1,25(OH)2D3 in hMSCs that were obtained from subjects with inadequate or deficient 25OHD levels (≤ 20 ng/mL, n=5) than the subjects who were vitamin D “insufficient” (21–29 ng/mL, n=17) or vitamin D sufficient (≥ 30 ng/mL, n=15) (p<0.05, ANOVA; Fig. 7B). The osteoblastogenic response to 1,25(OH)2D3 was greater in hMSCs obtained from subjects with higher serum PTH (r=0.49, p=0.0016, n=38; Fig. 7C) and with higher eGFR (r=0.37, p=0.039, n=31; Fig. 7D). The two other in vivo parameters that were significantly correlated with in vitro responsiveness to 1,25(OH)2D3 were higher whole body BMD (r=0.35, p=0.038, n=36) and whole body BMD T-scores (r=0.39, p=0.018, n=36; Table 2).
Fig. 7.

Effects of in vivo clinical attributes on in vitro magnitude of stimulation of ALP activity in hMSCs by 10 nM 1,25(OH)2D3. (A) There was a significant inverse correlation between osteoblastogenic response to 1,25(OH)2D3 and serum 25OHD (r=−0.36, p=0.030, n=37). (B) Osteoblastogenesis was stimulated to a greater degree by 1,25(OH)2D3 in hMSCs obtained from subjects with serum 25OHD levels ≤ 20 ng/mL (n=5) than for subjects whose serum 25OHD levels were 21–29 ng/mL (n=17), or ≥ 30 ng/mL (n=15) (p<0.05, ANOVA). (C) There was a significant correlation between osteoblastogenic response to 1,25(OH)2D3 and serum PTH (r=0.49, p=0.0016, n=38). (D) There was a significant correlation between osteoblastogenic response to 1,25(OH)2D3 and subject eGFR (r=0.37, p=0.039, n=31; Pearson correlations).
Discussion
Research related to the differentiation of adult human mesenchymal stem cells is increasing, but often there is no information about the clinical characteristics of the subjects from whom the cells were obtained. We recently observed that primary cultures of hMSCs are influenced by the clinical environment from which the cells were obtained. For example, there were discrepancies in the literature regarding expression of WNT genes in studies using a single sample of human MSCs that led us to discover that age and gender accounted for significant differences in their expression (17). Marrow discarded from well-characterized subjects provides an opportunity to evaluate regulation of differentiation of human MSCs and to define the contributions of extrinsic factors and intrinsic mechanisms of skeletal aging. Extrinsic refers to systemic age-related changes that have an impact on the skeleton, such as the menopause and hormone replacement therapy (15, 23, 24). Intrinsic refers to fundamental cellular properties that are altered with age, such as a decrease in in vitro proliferation of hMSCs, and increases in apoptosis and Senescence Associated-β-galactosidase (10), a marker for in vivo age or in vitro senescence. Using early passage hMSCs avoids senescent effects of expansion in culture. Advanced subject age was also related to impaired in vitro responsiveness of hMSCs to PTH signaling (11) and reduced biosynthesis of 1,25(OH)2D (12). Those inherent age-related properties of hMSCs may contribute to skeletal aging. In this study, we tested whether in vivo clinical attributes influenced the in vitro osteoblast potential of MSCs. We first evaluated the effect of age on serum parameters and body composition indices in a cohort of osteoarthritic subjects for whom surgical marrow was available. Consistent with data for non-osteoarthritic subjects (25, 26), femoral neck BMD and renal function were inversely associated with age. As part of the aging process, a measurable decline in renal function occurs in most people (27), and appears to be a part of the normal physiologic process of cellular and organ senescence associated with structural changes in the kidneys (28). This study indicates that subjects with advanced osteoarthritis are similar to non-osteoarthritic subjects regarding the effects of age on BMD and on eGFR.
Clinical and epidemiological studies indicate the vitamin D is important for bone health, but there is little information about the effects of circulating 25OHD levels on in vitro properties of marrow cells. We reported that human MSCs express vitamin D-hydroxylating enzymes and that serum 25OHD levels were related to levels of expression and activity of CYP27B1/1α-hydroxylase (10). This study was designed to test whether vitamin D status of the subject influenced the in vitro effect of 1,25(OH)2D3 onosteoblast differentiation. The serum 25OHD levels for this cohort ranged from 7.6 to 64.9 ng/mL. As expected (29, 30), serum 25OHD was inversely correlated with serum PTH. Vitamin D deficiency in adults is associated with reduced bone density and an increased risk of fractures (31). There has been considerable debate about what constitutes vitamin D deficiency and sufficiency. Prior studies considered 25OHD levels below 50 nmol/L (20 ng/ml) as deficiency, and sufficiency as greater than 62.5 to 80 nmol/L (25 to 32 ng/mL) or as 75 to 80 nmol/L (30 to 32 ng/mL) (25, 32, 33). The recent IOM report supported a 25OHD level of 50 nmol/L (20 ng/mL) as an adequate vitamin D level for the general population in North America (34, 49). Other organizations including the International Osteoporosis Foundation (35) and the Endocrine Society proposed 25OHD levels above 75 nmol/L (30 ng/mL) as sufficient for bone health (21). The circulating 25OHD level may be very important to support non-renal production of 1,25-dihydroxyvitamin D (35).
This cohort showed a range of values for BMD and body composition indices. High values for BMD, BMI, and FMI were not unexpected because these subjects presented to orthopedic surgery for advanced hip osteoarthritis. Finding a subset of osteoarthritic subjects with low values for BMD, BMI, and FMI is similar to a previous cohort of osteoarthritic subjects in which 25% had occult osteoporosis (36, 50). It is appreciated that both fat mass and lean mass contribute to the effect of body weight on bone (37). Our data indicate that BMI, FMI, and LMI were inversely associated with age and serum 25OHD, and were positively correlated with whole body BMD; the strongest contribution to BMD was LMI, not FMI.
This research identified several clinical attributes that were associated with greater in vitro stimulation of osteoblastogenesis by 1,25(OH)2D3, including age less than 65 years, vitamin D-insufficiency, elevated PTH, and normal eGFR. Animal studies indicated that effects of some clinical features are likely to influence marrow stromal cells. For example, Noh and co-workers demonstrated functional incompetence of murine MSCs from mice made uremic by partial kidney ablation (38). In the mouse ovariectomy (OVX) model, MSCs obtained from OVX mice had lower constitutive ALP activity, gene expression of RUNX2, TGF-β1 and BMP-2, and proliferation capacity, and more apoptotic cells than cells from sham mice (39). In a study with rats, Huff et al. reported that there was impaired expansion and multipotentiality of marrow stromal cells from rats after chronic alcohol abuse (40). Our finding that in vitro stimulation of osteoblast differentiation by 1,25(OH)2D3 was greatest in cells from vitamin D-deficient elders may mean that repletion of vitamin D-deficient subjects may lead to more vigorous bone formation. Consistent with this idea, von Hurst et al. reported that vitamin D suppressed the age-induced increase in bone turnover and reduced bone resorption only in vitamin D-deficient older women (41).
We found that there were better responses to 1,25(OH)2D3 in hMSCs from subjects with better renal function as indicated by higher eGFR, but there was not a significant correlation between serum 1,25(OH)2D and eGFR, nor between serum 25OHD and eGFR. A limitation of this study is that was not possible to estimate the relative contributions of age, vitamin D status, and renal function on in vitro responsiveness of MSCs to 1,25(OH)2D3, but finding these associations should stimulate further research on the impact of vitamin D status on bone formation. Classically, 1,25(OH)2D3 mediates its actions through activation of the Vitamin D Receptor (VDR), a ligand-dependent transcription factor. There may be additional effects of polymorphisms or epigenetic regulation of VDR in osteoblast progenitors.
These studies indicate greater stimulation of in vitro osteoblast differentiation by 1,25(OH)2D3 in hMSCs from younger subjects (< 65-year-old), subjects with inadequate circulating 25OHD levels, and those with better renal function. Our results suggest that it is clinically important to correct vitamin D deficiency to enhance bone formation at the cellular level. In vivo-in vitro studies with hMSCs from well-characterized subjects provide an innovative opportunity to evaluate effects of clinical attributes such as age, body composition, vitamin D status, and renal status on regulation of osteoblastogenesis of hMSCs.
Acknowledgments
The authors greatly appreciate helps from S. Anderson, K. Johnson, N. Glass, L. Gao, N. Setty, M. Tuteja, and C. Yu for aspects of these experiments. This study was supported by grants from the National Institutes of Health R01 AG 025015 and R01 AG 028114 (J.G.), the Swiss National Science Foundation Fellowship award 81BE-53101 (S.M.M.), the China Scholarship Council (S.G.), the American Federation for Aging Research grant A09052 (S.Z.), and BWH-BRI Fund (S.Z.). The research laboratory tests were supported by the General Clinical Research Center, National Institutes of Health grant RR-02635 (M.L.). The discarded marrow was obtained and studied with approval and annual review from the Partners Human Research Committee.
Footnotes
Conflict of interests: The authors declare that they have no competing interests.
Author’s roles: Study design, data collection, analysis and interpretation, and manuscript preparation: S.Z., J.G., M.L.; Experimental work: S.Z., S.W.K., J.H., S.G.,S.M.M.,L.S., I.B.; All authors approved the submitted version of this manuscript.
References
- 1.Watts NB, Ettinger B, LeBoff MS. Perspective: FRAX Facts. Journal of Bone and Mineral Research. 2009;24(6):975–979. doi: 10.1359/jbmr.090402. [DOI] [PubMed] [Google Scholar]
- 2.Kanis JA, Borgstrom F, De Laet C, Johansson H, Johnell O, Jonsson B, Oden A, Zethraeus N, Pfleger B, Khaltaev N. Assessment of fracture risk. Osteoporos Int. 2005;16(6):581–589. doi: 10.1007/s00198-004-1780-5. [DOI] [PubMed] [Google Scholar]
- 3.Setty N, Leboff MS, Thornhill TS, Rinaldi G, Glowacki J. Underestimated Fracture Probability in Patients With Unilateral Hip Osteoarthritis as Calculated by FRAX. J Clin Densitom. 2011;14(4):447–452. doi: 10.1016/j.jocd.2011.06.001. [DOI] [PMC free article] [PubMed] [Google Scholar]
- 4.LeBoff MS, Kohlmeier L, Hurwitz S, Franklin J, Wright J, Glowacki J. Occult vitamin D deficiency in postmenopausal US women with acute hip fracture. JAMA. 1999;281(16):1505–1511. doi: 10.1001/jama.281.16.1505. [DOI] [PubMed] [Google Scholar]
- 5.Clarke BL, Khosla S. Physiology of bone loss. Radiol Clin North Am. 2010;48(3):483–495. doi: 10.1016/j.rcl.2010.02.014. [DOI] [PMC free article] [PubMed] [Google Scholar]
- 6.Prockop DJ. Marrow stromal cells as stem cells for nonhematopoietic tissues. Science. 1997;276(5309):71–74. doi: 10.1126/science.276.5309.71. [DOI] [PubMed] [Google Scholar]
- 7.Pittenger MF, Mackay AM, Beck SC, Jaiswal RK, Douglas R, Mosca JD, Moorman MA, Simonetti DW, Craig S, Marshak DR. Multilineage potential of adult human mesenchymal stem cells. Science. 1999;284(5411):143–147. doi: 10.1126/science.284.5411.143. [DOI] [PubMed] [Google Scholar]
- 8.Zhou S. From Bone to Brain: Human Skeletal Stem Cell Therapy for Stroke. Central Nervous System Agents in Medicinal Chemistry. 2011;11(2):157–163. doi: 10.2174/187152411796011376. [DOI] [PubMed] [Google Scholar]
- 9.Mueller SM, Glowacki J. Age-related decline in the osteogenic potential of human bone marrow cells cultured in three-dimensional collagen sponges. J Cell Biochem. 2001;82(4):583–590. doi: 10.1002/jcb.1174. [DOI] [PubMed] [Google Scholar]
- 10.Zhou S, Greenberger JS, Epperly MW, Goff JP, Adler C, Leboff MS, Glowacki J. Age-related intrinsic changes in human bone-marrow-derived mesenchymal stem cells and their differentiation to osteoblasts. Aging Cell. 2008;7(3):335–343. doi: 10.1111/j.1474-9726.2008.00377.x. [DOI] [PMC free article] [PubMed] [Google Scholar]
- 11.Zhou S, Bueno EM, Kim SW, Amato I, Shen L, Hahne J, Bleiberg I, Morley P, Glowacki J. Effects of age on parathyroid hormone signaling in human marrow stromal cells. Aging Cell. 2011;10(5):780–788. doi: 10.1111/j.1474-9726.2011.00717.x. [DOI] [PMC free article] [PubMed] [Google Scholar]
- 12.Geng S, Zhou S, Glowacki J. Age-related Decline in Osteoblastogenesis and 1α-Hydroxylase/CYP27B1 in Human Mesenchymal Stem Cells: Stimulation by Parathyroid Hormone. Aging Cell. 2011;10(6):962–971. doi: 10.1111/j.1474-9726.2011.00735.x. [DOI] [PMC free article] [PubMed] [Google Scholar]
- 13.Nishida S, Endo N, Yamagiwa H, Tanizawa T, Takahashi HE. Number of osteoprogenitor cells in human bone marrow markedly decreases after skeletal maturation. J Bone Miner Metab. 1999;17(3):171–177. doi: 10.1007/s007740050081. [DOI] [PubMed] [Google Scholar]
- 14.D’Ippolito G, Diabira S, Howard GA, Roos BA, Schiller PC. Low oxygen tension inhibits osteogenic differentiation and enhances stemness of human MIAMI cells. Bone. 2006;39(3):513–522. doi: 10.1016/j.bone.2006.02.061. [DOI] [PubMed] [Google Scholar]
- 15.Cheleuitte D, Mizuno S, Glowacki J. In vitro secretion of cytokines by human bone marrow: effects of age and estrogen status. J Clin Endocrinol Metab. 1998;83(6):2043–2051. doi: 10.1210/jcem.83.6.4848. [DOI] [PubMed] [Google Scholar]
- 16.Makhluf HA, Mueller SM, Mizuno S, Glowacki J. Age-related decline in osteoprotegerin expression by human bone marrow cells cultured in three-dimensional collagen sponges. Biochem Biophys Res Comm. 2000;268(3):669–672. doi: 10.1006/bbrc.2000.2182. [DOI] [PubMed] [Google Scholar]
- 17.Shen L, Zhou S, Glowacki J. Effects of age and gender on Wnt gene expression in human bone marrow stromal cells. J Cell Biochem. 2009;106(2):337–343. doi: 10.1002/jcb.22010. [DOI] [PMC free article] [PubMed] [Google Scholar]
- 18.Liu P, Oyajobi BO, Russell RG, Scutt A. Regulation of osteogenic differentiation of human bone marrow stromal cells: interaction between transforming growth factor-β and 1,25(OH)2vitamin D3 In vitro. Calcif Tissue Int. 1999;65(2):173–180. doi: 10.1007/s002239900678. [DOI] [PubMed] [Google Scholar]
- 19.Zhou S, LeBoff MS, Glowacki J. Vitamin D metabolism and action in human bone marrow stromal cells. Endocrinology. 2010;151(1):14–22. doi: 10.1210/en.2009-0969. [DOI] [PMC free article] [PubMed] [Google Scholar]
- 20.Geng S, Zhou S, Glowacki J. Effects of 25-hydroxyvitamin D3 on proliferation and osteoblast differentiation of human marrow stromal cells require CYP27B1/1α-hydroxylase. J Bone Miner Res. 2011;26(5):1145–1153. doi: 10.1002/jbmr.298. [DOI] [PMC free article] [PubMed] [Google Scholar]
- 21.Holick MF, Binkley NC, Bischoff-Ferrari HA, Gordon CM, Hanley DA, Heaney RP, Murad MH, Weaver CM. Evaluation, Treatment, and Prevention of Vitamin D Deficiency: an Endocrine Society Clinical Practice Guideline. J Clin Endocrinol Metab. 2011;96(7):1911–1930. doi: 10.1210/jc.2011-0385. [DOI] [PubMed] [Google Scholar]
- 22.Kelly TL, Wilson KE, Heymsfield SB. Dual energy X-Ray absorptiometry body composition reference values from NHANES. PLoS One. 2009;4(9):e7038. doi: 10.1371/journal.pone.0007038. [DOI] [PMC free article] [PubMed] [Google Scholar]
- 23.Rosen CJ, Glowacki J, Craig W. Sex steroids, the insulin-like growth factor regulatory system, and aging: implications for the management of older postmenopausal women. J Nutr Health Aging. 1998;2(1):39–44. [PubMed] [Google Scholar]
- 24.Gordon CM, LeBoff MS, Glowacki J. Adrenal and gonadal steroids inhibit IL-6 secretion by human marrow cells. Cytokine. 2001;16(5):178–186. doi: 10.1006/cyto.2001.0962. [DOI] [PubMed] [Google Scholar]
- 25.Looker AC, Dawson-Hughes B, Calvo MS, Gunter EW, Sahyoun NR. Serum 25-hydroxyvitamin D status of adolescents and adults in two seasonal subpopulations from NHANES III. Bone. 2002;30(5):771–777. doi: 10.1016/s8756-3282(02)00692-0. [DOI] [PubMed] [Google Scholar]
- 26.Ferrari P, Xiao J, Ukich A, Irish A. Estimation of glomerular filtration rate: does haemoglobin discriminate between ageing and true CKD? Nephrol Dial Transplant. 2009;24(6):1828–1833. doi: 10.1093/ndt/gfn738. [DOI] [PubMed] [Google Scholar]
- 27.Choudhury D, Levi M. Kidney aging-inevitable or preventable? Nat Rev Nephrol. 2011;7(12):706–717. doi: 10.1038/nrneph.2011.104. [DOI] [PubMed] [Google Scholar]
- 28.Glassock RJ, Winearls C. Ageing and the glomerular filtration rate: truths and consequences. Trans Am Clin Climatol Assoc. 2009;120:419–428. [PMC free article] [PubMed] [Google Scholar]
- 29.Rejnmark L, Vestergaard P, Heickendorff L, Mosekilde L. Determinants of plasma PTH and their implication for defining a reference interval. Clin Endocrinol. 2011;74(1):37–43. doi: 10.1111/j.1365-2265.2010.03894.x. [DOI] [PubMed] [Google Scholar]
- 30.Carnevale V, Nieddu L, Romagnoli E, Battista C, Mascia ML, Chiodini I, Eller-Vainicher C, Frusciante V, Santini SA, La Porta M, Minisola S, Scillitani A. Regulation of PTH secretion by 25-hydroxyvitamin D and ionized calcium depends on vitamin D status: a study in a large cohort of healthy subjects. Bone. 2010;47(3):626–630. doi: 10.1016/j.bone.2010.06.013. [DOI] [PubMed] [Google Scholar]
- 31.Holick MF. Vitamin D deficiency. N Engl J Med. 2007;357(3):266–281. doi: 10.1056/NEJMra070553. [DOI] [PubMed] [Google Scholar]
- 32.Bischoff-Ferrari HA, Giovannucci E, Willett WC, Dietrich T, Dawson-Hughes B. Estimation of optimal serum concentrations of 25-hydroxyvitamin D for multiple health outcomes. Am J Clin Nutr. 2006;84(1):18–28. doi: 10.1093/ajcn/84.1.18. [DOI] [PubMed] [Google Scholar]
- 33.Holick MF, Siris ES, Binkley N, Beard MK, Khan A, Katzer JT, Petruschke RA, Chen E, de Papp AE. Prevalence of Vitamin D inadequacy among postmenopausal North American women receiving osteoporosis therapy. J Clin Endocrinol Metab. 2005;90(6):3215–3224. doi: 10.1210/jc.2004-2364. [DOI] [PubMed] [Google Scholar]
- 34.Institute of Medicine. 2011 Dietary reference intakes for calcium and vitamin D. Washington, DC: The National Academies Press; 2011. [PubMed] [Google Scholar]
- 35.Dawson-Hughes B, Mithal A, Bonjour JP, Boonen S, Burckhardt P, Fuleihan GE, Josse RG, Lips P, Morales-Torres J, Yoshimura N. IOF position statement: vitamin D recommendations for older adults. Osteoporos Int. 2010;21(7):1151–1154. doi: 10.1007/s00198-010-1285-3. [DOI] [PubMed] [Google Scholar]
- 36.Glowacki J, Hurwitz S, Thornhill TS, Kelly M, LeBoff ML. Osteoporosis and vitamin D deficiency among postmenopausal osteoarthritic women undergoing total hip arthroplasty. J Bone Joint Surg. 2003;85A(12):2371–2377. doi: 10.2106/00004623-200312000-00015. [DOI] [PubMed] [Google Scholar]
- 37.Reid IR. Relationships between fat and bone. Osteoporos Int. 2008;19(5):595–606. doi: 10.1007/s00198-007-0492-z. [DOI] [PubMed] [Google Scholar]
- 38.Noh H, Yu MR, Kim HJ, Jeon JS, Kwon SH, Jin SY, Lee J, Jang J, Park JO, Ziyadeh F, Han DC, Lee HB. Uremia induces functional incompetence of bone marrow-derived stromal cells. Nephrol Dial Transplant. 2011 May 28; doi: 10.1093/ndt/gfr267. [Epub ahead of print] [DOI] [PubMed] [Google Scholar]
- 39.Zhou S, Zilberman Y, Wassermann K, Bain SD, Sadovsky Y, Gazit D. Estrogen modulates estrogen receptor alpha and beta expression, osteogenic activity, and apoptosis in mesenchymal stem cells (MSCs) of osteoporotic mice. J Cell Biochem. 2001;(Suppl 36):144–155. doi: 10.1002/jcb.1096. [DOI] [PubMed] [Google Scholar]
- 40.Huff NK, Spencer ND, Gimble JM, Bagby GJ, Nelson S, Lopez MJ. Impaired expansion and multipotentiality of adult stromal cells in a rat chronic alcohol abuse model. Alcohol. 2011;45(4):393–402. doi: 10.1016/j.alcohol.2010.12.005. [DOI] [PMC free article] [PubMed] [Google Scholar]
- 41.von Hurst PR, Stonehouse W, Kruger MC, Coad J. Vitamin D supplementation suppresses age-induced bone turnover in older women who are vitamin D deficient. J Steroid Biochem Mol Biol. 2010;121(1–2):293–296. doi: 10.1016/j.jsbmb.2010.03.054. [DOI] [PubMed] [Google Scholar]
- 42.Zhou S, Lechpammer S, Greenberger JS, Glowacki Hypoxia inhibition of adipocytogenesis in human bone marrow stromal cells requires transforming growth factor-β/Smad3 signaling. J Biol Chem. 2005;280(24):22688–22696. doi: 10.1074/jbc.M412953200. [DOI] [PMC free article] [PubMed] [Google Scholar]
- 43.Lomri A, Fromigue O, Hott M, Marie PJ. Genomic insertion of the SV-40 large T oncogene in normal adult human trabecular osteoblastic cells induces cell growth without loss of the differentiated phenotype. Calcif Tissue Int. 1999;64(5):394–401. doi: 10.1007/pl00005821. [DOI] [PubMed] [Google Scholar]
- 44.Gordeladze JO, Drevon CA, Syversen U, Reseland JE. Leptin stimulates human osteoblastic cell proliferation, de novo collagen synthesis, and mineralization: Impact on differentiation markers, apoptosis, and osteoclastic signaling. J Cell Biochem. 2002;85(4):825–836. doi: 10.1002/jcb.10156. [DOI] [PubMed] [Google Scholar]
- 45.Zhou S, Glowacki J, Yates KE. Comparison of TGF-β/BMP pathways signaled by demineralized bone powder and BMP-2 in human dermal fibroblasts. J Bone Miner Res. 2004;19(10):1732–1741. doi: 10.1359/JBMR.040702. [DOI] [PubMed] [Google Scholar]
- 46.Byrne TA, Morrissey TB, Gatzen C, Benfell K, Nattakom TV, Scheltinga MR, LeBoff MS, Ziegler TR, Wilmore DW. Anabolic therapy with growth hormone accelerates protein gain in surgical patients requiring nutritional rehabilitation. Ann Surg. 1993;218(4):400–416. doi: 10.1097/00000658-199310000-00002. discussion 416–408. [DOI] [PMC free article] [PubMed] [Google Scholar]
- 47.Gordon AM, Hurwitz S, Shapiro CL, Leboff MS. Premature ovarian failure and body composition changes with adjuvant chemotherapy for breast cancer. Menopause. 2011;18(11):1244–1248. doi: 10.1097/gme.0b013e31821b849b. [DOI] [PubMed] [Google Scholar]
- 48.Kelly TL, Wilson KE, Heymsfield SB. Dual energy X-Ray absorptiometry body composition reference values from NHANES. PLoS One. 2009;4(9):e7038. doi: 10.1371/journal.pone.0007038. [DOI] [PMC free article] [PubMed] [Google Scholar]
- 49.Ross AC, Manson JE, Abrams SA, Aloia JF, Brannon PM, Clinton SK, Durazo-Arvizu RA, Gallagher JC, Gallo RL, Jones G, Kovacs CS, Mayne ST, Rosen CJ, Shapses SA. The 2011 report on dietary reference intakes for calcium and vitamin D from the Institute of Medicine: what clinicians need to know. J Clin Endocrinol Metab. 2011;96(1):53–58. doi: 10.1210/jc.2010-2704. [DOI] [PMC free article] [PubMed] [Google Scholar]
- 50.Glowacki J. Osteoarthritis and osteoporosis: Coexistence of osteoporosis in patients with osteoarthritis. Minerva Ortoped Traum. 2010;61:115–122. [Google Scholar]