

Abstract
The initiation of T-cell responses requires rare precursors to locate a draining lymph node (dLN) and encounter dendritic cells (DCs) presenting peptide-major histocompatibility complexes (pMHCs). To locate this needle in the haystack rapidly, T cells face an optimization problem—what is the most efficient trafficking strategy for surveillance and recirculation through blood? Two extremes are scanning low numbers of DCs per node with frequent recirculation, or meticulous surveillance with infrequent recirculation. Naive T cells also require stimulation by self-pMHCs. To enable efficient location of both foreign and self, has evolution settled on an optimum time for T cells to spend surveying each lymph node? Using a data-driven mathematical model, we show the most efficient strategy for detecting antigen in a dLN depends on its abundance. Detection of low-density antigen is optimized with systemically slow transit. In contrast, at high densities or if dLN egress is restricted, rapid transit through other nodes is optimal. We argue that blood-lymph recirculation dynamics facilitate a trade-off, and are consistent with dominant roles for the very early detection of rare foreign antigens in a dLN, and the efficient accumulation of signals from systemically distributed self-antigens.
Introduction
Naive T cells have the task of surveying both for foreign antigens and for weak interactions with self, which are required for optimal function.1–3 Recognition of both takes place in lymph nodes, exquisitely constructed environments that facilitate the encounter of T and B lymphocytes with antigens. In mice, the naive CD4 and CD4 T-cell pools each comprise roughly 5 × 10⁷ cells, but the diversity of T-cell receptor (TCR) sequences is such that a remarkably small proportion are capable of recognizing a given antigen with sufficient affinity to reach an activation threshold. Estimates of the typical antigen-specific pool size in mice are in the range 10 to 1200 cells.4–9 A high degree of polyclonality ensures both broad coverage and fine specificity of the TCR repertoire, but comes at the price of increasing the time required for the relevant cells in the total repertoire to locate a given peptide-MHC complex.
In their search for TCR stimulation, naive T cells circulate continuously through the spleen, lymph nodes, lymphatic vessels, and blood.10 At steady state, naive T cells enter lymph nodes from the blood at random through the high endothelial venules (HEVs), taking a few minutes to cross into the lymph node cortex.11,12 There they encounter and survey DC presenting peptide-MHC ligands. While in the cortical region, T cells acquire competence to egress, at most 4 hours,13 but possibly as little as 20 minutes14 after crossing the HEV. T cells exit from the lymph node through lymphatic sinuses and return to the blood, first through lymphatics, and finally through the thoracic duct. Smith and Ford studied lymphocyte recirculation in rats and found that intravenously injected cells returned to the thoracic duct 4 to 16 hours later.11 They estimated that at steady state approximately 1% to 3% of the transferred cells were in blood, and blood residence times were exponentially distributed with mean 25 minutes. Thus the majority of a naive T cell's time is spent in lymphoid organs.
The benefit of this skewed allocation of attention between blood and lymph appears obvious; time spent in blood is wasted as far as identifying antigen is concerned. However, recirculation is essential to allow rare T cells to encounter rare antigens, such as those appearing in a single lymph node draining a site of infection. To search for pMHC ligands, a circulating T cell might then in principle take strategies ranging from making small numbers of DC encounters in each transit of a lymph node, with frequent recirculation, to more numerous DC encounters per transit but sampling fewer nodes in a given time interval. Here we explore how these strategies influence the efficiency with which a population of relevant T cells locates a specific antigen, and identify the constraints that may have shaped the optimal surveillance strategy for a naive T cell.
Methods
Modeling lymph node transit and recirculation
After systemic blocking of entry to HEVs, naive CD4 and CD8 T cells egress from inguinal, brachial, and mesenteric lymph nodes in mice with exponentially distributed transit times with mean 12 hours for CD4 T cells and 21 hours for CD8 T cells (J.N.M., R. Liou, F. Klauschen, N. Vrisekoop, J. P. Monteiro, A.J.Y., A. Y. Huang, and R.N.G., Quantification of lymph node transit times reveals unexpected differnces in antigen surveillance strategies of CD4+ and CD8+ T cells, article submitted July 9, 2012). These estimates are comparable to those of 7 to 12 hours obtained from lymphocyte recirculation experiments in rats.11,15 While in lymph nodes, in the absence of foreign antigen, T cells make sequential contacts with DCs with mean duration of approximately 3 to 4 minutes (J.N.M., R. Liou, F. Klauschen, N. Vrisekoop, J. P. Monteiro, A.J.Y., A. Y. Huang, and R.N.G., Quantification of lymph node transit times reveals unexpected differnces in antigen surveillance strategies of CD4+ and CD8+ T cells, article submitted July 9, 2012, and Miller et al17). For CD4 T cells the durations of these contacts with DCs are influenced by processes that involve recognition of self-pMHC class II ligands, as mean contact times are approximately 50% shorter when the DCs lack such ligands (J.N.M., R. Liou, F. Klauschen, N. Vrisekoop, J. P. Monteiro, A.J.Y., A. Y. Huang, and R.N.G., Quantification of lymph node transit times reveals unexpected differnces in antigen surveillance strategies of CD4+ and CD8+ T cells, article submitted July 9, 2012). The mechanisms underlying a cell's decision to egress from a lymph node are complex,17,18 but these observations suggest a remarkably simple explanatory model; in the absence of inflammation, T cells typically make several hundred encounters with DCs while transiting a lymph node, and leave via efferent lymphatics with a constant probability after each encounter (J.N.M., R. Liou, F. Klauschen, N. Vrisekoop, J. P. Monteiro, A.J.Y., A. Y. Huang, and R.N.G., Quantification of lymph node transit times reveals unexpected differnces in antigen surveillance strategies of CD4+ and CD8+ T cells, article submitted July 9, 2012).
Mathematical models have been used to describe lymphocyte recirculation,15 using data from experiments in rats11 and sheep.19 Together these suggest that different lymphoid organs exhibit different efficiencies of lymphocyte recruitment, perhaps in part because of differences in local rates of blood flow. There is also a distribution of lymph node sizes within an individual, and any variation in the density of lymphatic sinuses in the cortical region may mean that the probability of egress per unit time (and hence transit time) could vary from node to node. Thus, after each transit through blood, naive T cells may enter different lymph nodes with different probabilities, and potentially take different times to transit the node that they enter. However, for our purposes the important features of T-cell trafficking are the following: (1) naive T cells move continuously between blood and the lymphoid compartment, entering lymph nodes at random; (2) the typical time spent between lymph nodes, in blood, TB, is approximately 30 minutes; (3) in the absence of infection there is a mean time, TL, taken for transit through each lymph node; and (4) the appearance of foreign antigen in a node may eventually result in (possibly transient) restriction of egress from that node. In the supplemental Analysis (available on the Blood Web site; see the Supplemental Materials link at the top of the online article) we show that our results hold when we relax the third assumption and allow heterogeneity in mean transit times through lymph nodes.
We encapsulate these observations and assumptions in a mathematical model, illustrated in Figure 1 and described in the following section. The model follows a population of antigen-specific T cells circulating between blood and lymph. To model the search for antigen, we assume that in a lymph node bearing antigen, every encounter between one of the specific T cells and a DC results in recognition of the cognate foreign pMHC with probability f. We refer to f as the antigen density. Assuming random encounters between T cells and DC, f can be interpreted either as the proportion of DC that present cognate pMHC at an adequate level to trigger an activation response by that T cell, or the proportion of MHC molecules in the lymph node as a whole that bear the relevant pathogen-derived peptides. More generally, if τ is the mean time between encounters with DC, f is interpreted as the probability per time interval τ that a T cell accumulates multiple signals from pMHCs above some threshold required for activation. This more general measure allows for nonrandom sampling of DCs by T cells—activated DCs may attract T cells in their vicinity to increase their rate of contacts.20,21
Figure 1.

A model of naive T-cell trafficking and surveillance. A naive T cell enters one of N LNs at random, from the blood. It transits the node making contacts of duration τ with DCs (shown in blue), surveying for antigen; it egresses with a constant probability per DC encounter, returning to blood after a mean transit time TL. (If q is the probability of egress per DC encounter, TL = τ/q.) It then spends an average time TB in the blood before re-entering a LN, again at random. In 1 node (orange), antigen is present on a proportion f of DCs (purple) and contact between a T cell and antigen-bearing DCs results in detection. The rate of egress from this node may also be reduced in an infection scenario.
Given specific antigen in one lymph node, the model yields the cumulative probability P(t) of recognition of that antigen within a time t. This is the probability that at least 1 specific T cell has been triggered by interacting with cognate pMHC within a time interval t. Note that we are concerned with the time until the first cognate recognition event, and not the time until such events as the onset of clonal expansion, recruitment of all antigen-specific cells into a response, or migration to infection sites. In what follows, we model naive T-cell circulation in mice, assuming N = 30 lymph nodes22 and antigen-specific populations of 10 and 100 T cells.
Mathematical formulation
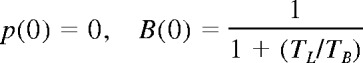
At a time t after antigen appears in one lymph node at density f, a given specific T cell is any of the following locations; the blood with probability B(t), the antigen-bearing (draining) node with probability Y(t), and one of the N−1 other lymph nodes with probability Xi(t). Each contact with a DC has mean duration τ, and the mean times spent in each lymph node and blood are TL and TB, respectively. The cumulative probability that this particular T cell has encountered antigen by a time t is denoted p(t); successful encounters occur with probability f per T-DC encounter in the draining lymph node, and so with rate f/τ per cell per unit time. The “leakiness” parameter λ is 1 for normal egress from the antigen-bearing node, and 0 for blocked egress. The initial conditions p(0), B(0), Xi(0), Y(0) reflect the T cell being randomly located in the system at time t = 0, with λ = 1 initially (no restriction of egress). If there are s antigen-specific cells in the body, the probability that at least one of them has encountered antigen by time t is P(t) = 1−(1− p(t))s. This is the quantity presented in Figures 2 through 4. The equations representing the model are as follows:
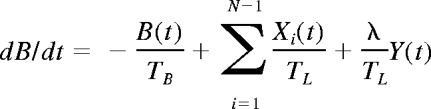 |
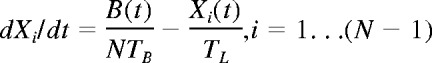 |
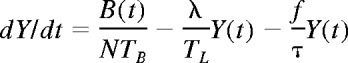 |
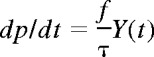 |
 |
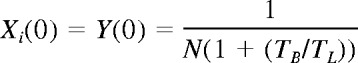 |
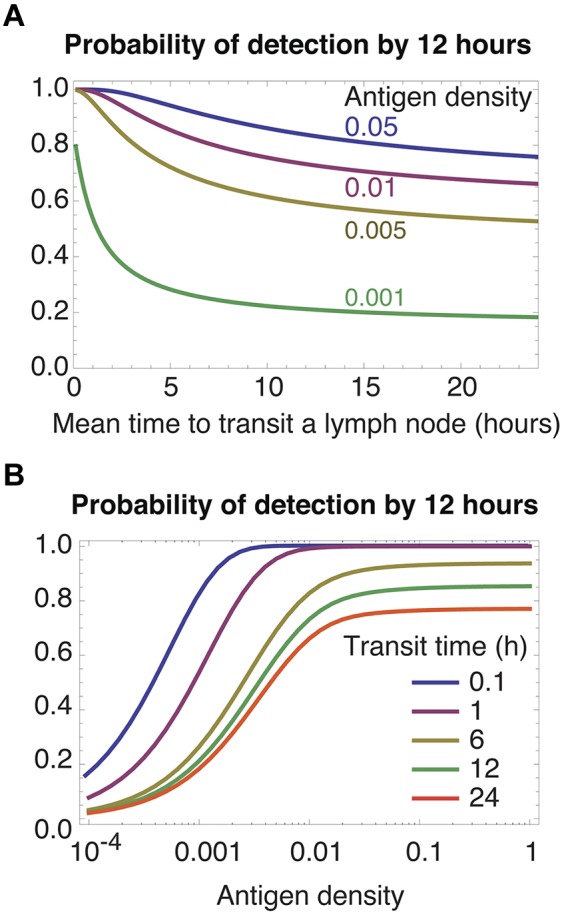
Figure 2.

Conservative estimates of the efficiency of detection depend on antigen abundance, precursor numbers, and LN transit time. We consider detection without blocking of egress from a dLN. When precursors are rare (A-C), slow LN transit favors the detection of rare antigen in the dLN (A lower curves, and B) but increasingly rapid transit is optimal for antigen at higher densities (A lower curves, and C). At higher precursor frequencies, when every node is likely to contain at least 1 specific cell at steady state, slower transit is optimal at all antigen densities (D-F).
Figure 4.
Slow transit facilitates the detection of rare self-antigens. The self-pMHC ligands required for survival by a given clone are assumed to be distributed at random across all LNs. (A) Cumulative probability of a single cell encountering a self-antigen present a frequency of 1 in 105, for different transit times. (B) The probability of detection by 180 days as function of self-antigen density. In both panels predictions quickly saturate for transit times longer than 12 hours (not shown).
Results
Antigen density and precursor frequency influence the optimum lymph node transit time
We begin by calculating the probability that, after the appearance of antigen in a lymph node, at least 1 antigen-specific T cell has arrived in that node and detected antigen within 12 hours. We do this for different LN transit times, antigen densities, and specific population sizes (Figure 2). Initially we assume that egress from the draining node is not restricted (λ = 1), recruitment to this node is not increased, and that T cells within the node do not preferentially home to antigen-bearing DCs. This calculation then provides a lower bound on the predicted efficiency of detection.
With a population of 10 specific cells and 30 LNs, there is a substantial probability (≈ 70%) that any given node will not contain an antigen-specific cell. In this scenario, when antigen is rare in the target node, slow transit maximizes the rate of detection (Figure 2A top curves) but as antigen density increases, more rapid transit becomes optimal (Figure 2A lower curves). The probability of detection by 12 hours saturates with increasing transit times. In this regime, the majority of cells have surveyed only 1 lymph node by 12 hours. In this case detection occurs within 12 hours only if specific cells are already resident in the target node.
At this low precursor frequency (1 in 5 × 10⁶), the influence of antigen density on the optimal strategy is the result of the 2-step process of locating antigen. Cells must first enter the correct LN; this is facilitated by rapid transit and frequent recirculation. Once in the correct node, their probability of detecting antigen is increased with slower transit. When antigen is rare, the importance of thorough scanning dominates and longer transit times are the best strategy (Figure 2B). In contrast, when antigen is abundant the rate-limiting step becomes locating the correct LN, so rapid transit is optimal (Figure 2C).
We see a trade-off in Figures 2A and D. The probability of early detection drops sharply for all antigen densities when transit times are very short compared with the mean time transiting between LNs. In this regime an increasingly large proportion of specific cells are expected to be in the blood at any time. So the effective precursor frequency falls, reducing the net surveillance rate; thus very rapid transit through LNs (TL << TB) is not optimal at any density of antigen.
When populations of specific cells are larger than the number of LNs—in the example that follows, 100 cells (a precursor frequency of 1 in 5 × 10⁵) distributed across 30 nodes—the probability of the target node being initially devoid of specific cells is much lower (≈ 3%). Here the situation is different (Figure 2D-F). Recirculation has the effect of resampling for the possibility of a specific cell arriving in the correct node. However, because it is likely that a node already contains a specific cell, the benefit of rapid transit (frequent resampling) is lost and detection efficiency becomes weakly dependent on transit time (Figure 2D). As before, detection efficiency declines at low transit times because of the increasing proportion of specific cells resident in the blood. This insensitivity to transit time becomes more pronounced as antigen densities increase (Figure 2E-F), as resampling from the circulation becomes even less important for efficient detection.
In summary, when precursor frequencies are low (less than 1 specific T cell per node on average), rapid transit is optimal for the detection of abundant antigen in a single draining lymph node. Slower transit is optimal for rarer antigens. If the mean number of specific cells per node is greater than 1, a wide range of transit times suffices for all antigen densities. This condition may be important with respect to the activation of central memory cells present at larger precursor frequencies than naive T cells.
Restriction of egress favors rapid transit of nontarget nodes
Activated antigen-bearing DCs usually migrate from the site of infection to a draining LN. For some infections, inflammatory signals then begin to restrict egress of lymphocytes from that node23–25 and enrich the node for antigen-specific cells.26 If we alter the model to include restriction of egress by setting the parameter λ = 0, faster transit through other nodes increases the rate of recruitment of specific T cells to the draining node, and so increases rates of detection for all densities of specific antigen and for all precursor frequencies (Figure 3 both panels; we use a specific population size of 100 cells, and results for 10 cells are qualitatively similar). Retention of T cells in the target LN removes the cost of frequent recirculation, and the best transit strategy then is to move through other nodes as rapidly as possible (Figure 3A green curve). Blocking of egress in a target node may be transient,23 perhaps to allow the continued recruitment of antigen specific cells into a node of finite capacity. By this time antigen will have accumulated in the target LN, and rapid transit gives efficient detection of abundant antigen at all precursor frequencies (Figure 2C-F). Thus the optimal strategy when egress from a dLN is only transiently restricted is still to transit nodes rapidly.
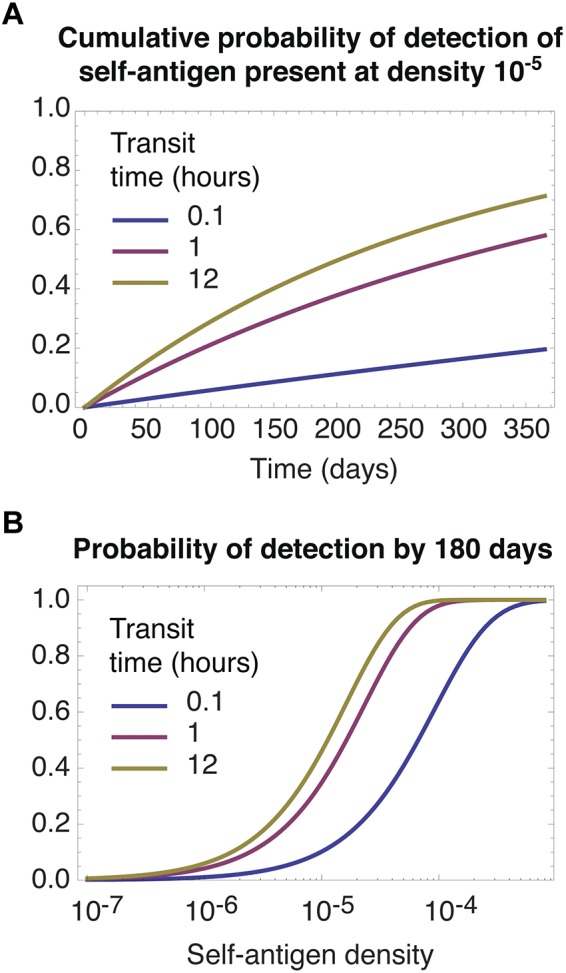
Figure 3.
Restricting egress from an infected LN. The rate-limiting step is recruitment into the correct LN; thus rapid transit (A left-most region, B top curves) yields more efficient detection.
Antigen density is effectively increased by DC activation
Miller et al estimated that after an infection, an activated DC in a dLN encounters 80 new T cells per minute and is in contact with approximately 250 T cells at any time.16 From this they calculated that with 100 antigen-bearing DCs in a node, and a CD4 T-cell precursor frequency of 1 in 106, this rate of turnover provides a 95% chance of at least 1 encounter between a specific T cell and an antigen-bearing DC within approximately 6 hours.
This calculation makes the implicit assumption that T cells compete for residence or contact sites on DC, for which there is evidence,27,28 and it does not consider the timescale of recruitment of specific cells to the relevant LN. However we can use it to show how the activation status of antigen-bearing DCs might influence the estimation of the antigen density f. Under steady-state conditions in the absence of infection, a LN may contain of the order 106 CD4 T cells and approximately 5 to 40 × 104 DCs. So under normal conditions there will be approximately 10 naive CD4 T cells in contact with each resting DC at any time, and with a mean contact time of 3 minutes each DC makes new encounters with approximately 3 T cells per minute. This together with the calculation by Miller et al suggests that DC activation may boost the rate at which a DC encounters T cells as much as 30-fold, perhaps because of increased T-cell densities in the draining LN and/or preferential homing to activated DCs.21
Directed motion of a T cell toward relevant DCs clearly will increase its probability of encountering antigen per unit time and so increase the effective density of antigen. To illustrate, assume a LN contains 1 specific T cell on average, corresponding to a precursor frequency of approximately 10−6. We predict that to achieve a 95% probability of detection by 6 hours requires antigen to be present at density f ≈ 0.02, or roughly 1 in 50. Miller et al estimate that this detection efficiency can be achieved with only 100 antigen-bearing DCs in a node, which yields a naive estimate of antigen density of between 1 in 40 000 and 1 in 500. Thus, unsurprisingly, increased recruitment of T cells to activated DCs will boost the effective antigen density above the simple estimate of the proportion of DC in the node presenting relevant antigens, and increase the detection efficiency after recruitment of specific cells to the dLN.
Surveillance for self-antigens
In the first section we modeled the search by a population of antigen-specific T cells for antigen immediately after its appearance in a draining LN, without restricted egress. This model can equally well be used to describe a single cell's search for self-antigens in the absence of infection.
The nature of naive T cells' requirement for interactions with self-pMHCs is unclear, and the signals may operate at several levels. Very low-level stimulation could be obtainable from a broad spectrum of ligands and frequent “tonic” signaling from these contacts may contribute to the maintenance of TCR responsiveness.29 Signals from self-pMHCs may also be required for homeostasis. Some studies suggest that the absence of MHC impairs survival, with mature CD4 and CD8 T cells declining with half lives of a few weeks.3,30–32 These observations support the idea that cells can survive on signals derived from infrequent encounters, or sequences of encounters, with self-pMHCs. Thus, under nonlymphopenic conditions in which other survival factors such as cytokines may be limiting, it may be that only rare encounters with a subset of self-pMHCs occur that promote survival or (even more rarely, in mice) induce division.
Whatever the frequency of relevant ligands, if we assume they are distributed at random among all nodes, a cell's rate of encounter with them can be modeled by grouping all N LNs into effectively a single lymphoid compartment. Modifying the model appropriately, we see in Figure 4 that longer LN transit times always favor the accumulation of contacts with relevant self-pMHCs, irrespective of their abundance. The model predicts that meticulous scanning of each LN facilitates the acquisition of signals from self, simply because this strategy minimizes the proportion of time spent in blood; if relevant self-antigens are distributed at random, recirculation between nodes confers no benefit, on average. Diminishing returns are obtained from slower transit as the proportion of time spent surveying for antigen in LNs, TL/(TL + TB), approaches 1; notably, the transit times of 12 hours or more that are observed in mice are close to this saturating regime of maximum efficiency of detection (Figure 4B). We also note that slow transit may maximize the rate of tolerance induction in the periphery, by minimizing the time taken for a naive T cell to encounter rare high-affinity self–peptide ligands that were not encountered in the thymus.
Figure 4A shows that the timescale for detection of antigens at frequencies of 1 in 105 or less is of the order months to years. Homeostatic turnover of naive T cells is almost undetectable in healthy mice and may be as slow as once every several months to years in adult humans.33–35 Together these observations are consistent with a model of homeostasis in which, under normal conditions, division of naive T cells is induced by encounters of sufficient duration and affinity with rare self-pMHC ligands. These may be rare in absolute terms, or effectively at very low frequency because of competition within T cell clones.
Discussion
To identify optimal strategies in biology risks conjuring just-so stories using convenient assumptions, perhaps missing other constraints that are the true determinants of behavior. However, establishing that trade-offs exist at all in a naive T cell's surveillance strategy requires only a few biologically grounded assumptions. Our understanding of the trafficking patterns of naive T cells and their clear purpose—to search for ligands, both self and foreign—quite straightforwardly reveals conflicting demands.
We have shown that rates of transit through LNs influences how well T cells satisfy these demands. The strategies vary slightly with precursor frequency, but the consistent findings are that slow transit optimizes the very early detection of rare foreign antigen, when the density of antigen in the LN draining an infection site is low and egress is yet to be restricted; and is also optimal for the acquisition of signals from self-pMHCs (for function, survival, division, or for the induction of peripheral tolerance). In contrast, faster transit improves response times when antigen is abundant or when egress from an antigen-bearing LN is restricted. We argue here that LN transit times reflect a strategy that is the result of a compromise between these conflicting demands.
Adaptive behavior
Within the “goldilocks” region described by our analysis, the immune system may adaptively switch between different modes of behavior that facilitate the search for self- or foreign antigens when appropriate. For example, inflammatory signals that increase the probability per blood transit that a cell enters an antigen-bearing node36 will effectively reduce the number of nodes to be searched (N). Similarly, preferential homing of T cells to activated DCs within a LN21 boosts the effective antigen density. Both of these adaptive changes facilitate the recruitment of naive precursors, which for many responses may be complete.9,37 The ability of the immune system to modulate the surveillance process in these ways suggests that transit rates may be optimized most strongly for the detection of rare or self-antigens in the absence of inflammation, consistent with the transit times observed experimentally, and that other mechanisms specific to the dLN come into play to progressively increase the rate of recruitment to the dLN and homing to antigen-bearing DCs.
External constraints
We have assumed that any optimization has occurred against a background of (1) a constant mean transit time through blood, and (2) a constant mean time for a T cell to survey a DC. The first assumption seems reasonable because this is determined, at least in part, by external factors such as lymphatic and blood pressure, and the distances cells must travel in the vasculature between exit from the thoracic duct and reaching a HEV. The second assumption is reasonable because the efficiency of detection depends on the machinery of TCR-pMHC recognition, which is presumably tuned to give a balance between sensitivity and specificity within as short a time as possible.
Body mass may also influence the optimal strategy. Humans have many more LNs compared with the 30 we assume for mice, and the increased mean distance from thoracic duct to HEVs means recirculation times may be longer. The typical size of antigen-specific naive T-cell populations may also be larger in humans. T-cell repertoire diversity has proved difficult to measure, in part because of potential cross-reactivity of different TCRs for the same pMHC ligands; but in humans, number of different TCRβ chains in the naive T-cell pool is estimated to be approximately 106,38,39 generating approximately 2.5 × 10⁷ distinct TCRαβ sequences.38 Assuming a naive T-cell compartment size of 1011, this suggests naive T clone sizes may be of the order 103 to 104 cells in humans. These mouse-human differences will probably alter the optimal transit time, although the direction of the effect is unclear. For given LN and blood transit times, the increasing the number of LNs reduces the efficiency of recognition, but larger clone sizes will increase it.
Stochasticity in LN transit
In our analysis the existence of a trade-off determining an optimal mean transit time is independent of whether transit is of a fixed duration or is a random variable. Nevertheless, it can be shown that for a search process through patches (LNs) with unknown and possibly time-varying probabilities of detecting a target (antigen) at each timestep, a fixed transit time through each patch is the optimal strategy for rapid detection,40 an assumption made in a recently study of LN transit.41 However, the duration of a given naive T cell's transit through LN from blood is probably a sum of random variables corresponding to crossing HEV, migrating throughout paracortical regions surveying DCs, and egressing via cortical sinusoid structures.12 Our observation that transit time is approximately exponentially distributed suggests that one of these processes accounts for the majority of transit time, probably the movement within the paracortex; superimposed on this is a constant probability per unit time of initiating egress, which then occurs relatively rapidly. DCs are broadly distributed throughout the paracortex, and to a good approximation T cells perform random walks among them,42 guided by the fibroblastic reticular network.43 Rapid detection of antigen is probably facilitated by each T cell performing independent random sampling of DCs; thus the spatial distribution of DCs within the paracortex may dictate that random walks with stochastic egress are optimal for surveillance, rather than (for example) directed transit between entry and exit sites.
Lymphocyte ecology
The study of the population dynamics of lymphocytes might be described as lymphocyte ecology. Optimizing the rate of accumulation of signals from self-antigens (rather than optimizing the time to encounter an antigen for the first time, for the initiation of an immune response) has some analogies to the use of foraging theory to determine how predators maximize their rate of encounter with resources as they move between spatial patches. Here predators, resources, and patches are the obvious analogs of naive T cells, their required self-pMHC ligands, and LNs. Iwasa et al show that the best strategy depends on the variance of the distribution of resources between patches.44 If resources are distributed randomly (with Poisson statistics), maximal uptake comes from a fixed time spent in each patch. High variance in resources, corresponding to ligands that are relatively abundant in some nodes and scarce in others, leads to an optimal strategy in which a predator leaves a patch if the interval between successive detection of resources (here, ligands) exceeds a certain threshold. This suggests a more sophisticated model of transit in which a naive T cell's number of encounters with DCs in LNs may depend on the availability of patchily distributed pMHC ligands. We find some experimental support for this.15 In inguinal and brachial LNs in mice, polyclonal naive CD4 T cells make approximately 110 to 180 contacts with DCs during transits of duration 9 to 12 hours. In the absence of MHCII, naive CD4 T cells make many more DC contacts (200-300) of shorter duration, but egress more rapidly, within 7 to 8 hours. Conversely, recirculation is slower under lymphopenic conditions when competition for ligands is presumably reduced.15,45 Our model assumes that cells are memoryless over timescales of hours, and that the quality of stimulation received has no effect on transit times. However, these data suggest T cells sense their recent history of stimulation, and may make the decision to egress informed by their perceived measure of the local abundance of ligands.
Naive T-cell homeostasis and ligand availability
We suggest that any pMHC ligands required for naive T-cell survival or division under nonlymphopenic conditions may be rare and randomly distributed, perhaps with affinities for the TCR that are above a certain threshold. We were motivated here in part by the ecologic principle of competitive exclusion.46 This suggests that stable coexistence of multiple species (TCR specificities) reliant on resources (self-pMHCs) requires a diversity of resources or ecologic niches comparable with the diversity of species. This avoids the eventual outgrowth of the strongest competitor for a common resource. The idea of the diversity of self-antigens reflecting the diversity of the TCR repertoire has also been raised in the context of self-tolerance47 and may underlie the relation between abundance and survival of naive CD4 T-cell clones.48
Supplementary Material
Acknowledgments
All computation was performed in Mathematica (Wolfram Research Inc, Champaign, IL). The authors thank Johannes Textor, Rob de Boer, Andras Fiser, Charles Sinclair, and Benedict Seddon for comments and discussions.
This study was supported by the National Institutes of Health (R01 AI093870-01 to A.J.Y.).
Footnotes
The online version of this article contains a data supplement.
The publication costs of this article were defrayed in part by page charge payment. Therefore, and solely to indicate this fact, this article is hereby marked “advertisement” in accordance with 18 USC section 1734.
Authorship
Contribution: M.L. performed the analyses of the model supervised by A.J.Y.; J.N.M. and R.N.G. provided experimental data; and A.J.Y. formulated the question and the model and wrote the paper with input and discussion from all coauthors. This study arose from discussions between J.N.M. and A.J.Y. regarding lymphocyte trafficking and surveillance.
Conflict-of-interest disclosure: The authors declare no competing financial interests.
Correspondence: Andrew J. Yates, Department of Systems and Computational Biology, Albert Einstein College of Medicine, 1300 Morris Park Ave, Bronx, NY 10461; e-mail: andrew.yates@einstein.yu.edu.
References
- 1.Kirberg J, Berns A, von Boehmer H. Peripheral T cell survival requires continual ligation of the T cell receptor to major histocompatibility complex-encoded molecules. J Exp Med. 1997;186(8):1269–1275. doi: 10.1084/jem.186.8.1269. [DOI] [PMC free article] [PubMed] [Google Scholar]
- 2.Viret C, Wong FS, Janeway CA., Jr Designing and maintaining the mature TCR repertoire: the continuum of self-peptide:self-MHC complex recognition. Immunity. 1999;10(5):559–568. doi: 10.1016/s1074-7613(00)80055-2. [DOI] [PubMed] [Google Scholar]
- 3.Martin B, Bécourt C, Bienvenu B, Lucas B. Self-recognition is crucial for maintaining the peripheral CD4+ T-cell pool in a nonlymphopenic environment. Blood. 2006;108(1):270–277. doi: 10.1182/blood-2006-01-0017. [DOI] [PubMed] [Google Scholar]
- 4.Casrouge A, Beaudoing E, Dalle S, Pannetier C, Kanellopoulos J, Kourilsky P. Size estimate of the alpha beta TCR repertoire of naive mouse splenocytes. J Immunol. 2000;164(11):5782–5787. doi: 10.4049/jimmunol.164.11.5782. [DOI] [PubMed] [Google Scholar]
- 5.Blattman JN, Antia R, Sourdive DJD, et al. Estimating the precursor frequency of naive antigen-specific CD8 T cells. J Exp Med. 2002;195(5):657–664. doi: 10.1084/jem.20001021. [DOI] [PMC free article] [PubMed] [Google Scholar]
- 6.Nikolich-Zugich J, Slifka MK, Messaoudi I. The many important facets of T-cell repertoire diversity. Nat Rev Immunol. 2004;4(2):123–132. doi: 10.1038/nri1292. [DOI] [PubMed] [Google Scholar]
- 7.Moon JJ, Chu HH, Pepper M, et al. Naive CD4(+) T cell frequency varies for different epitopes and predicts repertoire diversity and response magnitude. Immunity. 2007;27(2):203–213. doi: 10.1016/j.immuni.2007.07.007. [DOI] [PMC free article] [PubMed] [Google Scholar]
- 8.Obar JJ, Khanna KM, Lefrancois L. Endogenous naive CD8+T cell precursor frequency regulates primary and memory responses to infection. Immunity. 2008;28(6):859–869. doi: 10.1016/j.immuni.2008.04.010. [DOI] [PMC free article] [PubMed] [Google Scholar]
- 9.La Gruta NL, Rothwell WT, Cukalac T, et al. Primary CTL response magnitude in mice is determined by the extent of naive t cell recruitment and subsequent clonal expansion. J Clin Invest. 2010;120(6):1885–1894. doi: 10.1172/JCI41538. [DOI] [PMC free article] [PubMed] [Google Scholar]
- 10.Gowans JL, Knight EJ. The route of re-circulation of lymphocytes in the rat. Proc R Soc Lond B Biol Sci. 1964;159:257–282. doi: 10.1098/rspb.1964.0001. [DOI] [PubMed] [Google Scholar]
- 11.Smith ME, Ford WL. The recirculating lymphocyte pool of the rat: a systematic description of the migratory behaviour of recirculating lymphocytes. Immunology. 1983;49(1):83–94. [PMC free article] [PubMed] [Google Scholar]
- 12.Mionnet C, Sanos SL, Mondor I, et al. High endothelial venules as traffic control points maintaining lymphocyte population homeostasis in LNs. Blood. 2011;118(23):6115–6122. doi: 10.1182/blood-2011-07-367409. [DOI] [PMC free article] [PubMed] [Google Scholar]
- 13.Lo CG, Xu Y, Proia RL, Cyster JG. Cyclical modulation of sphingosine-1-phosphate receptor 1 surface expression during lymphocyte recirculation and relationship to lymphoid organ transit. J Exp Med. 2005;201(2):291–301. doi: 10.1084/jem.20041509. [DOI] [PMC free article] [PubMed] [Google Scholar]
- 14.Grigorova IL, Panteleev M, Cyster JG. LN cortical sinus organization and relationship to lymphocyte egress dynamics and antigen exposure. Proc Natl Acad Sci U S A. 2010;107(47):20447–20452. doi: 10.1073/pnas.1009968107. [DOI] [PMC free article] [PubMed] [Google Scholar]
- 15.Stekel DJ, Parker CE, Nowak MA. A model of lymphocyte recirculation. Immunol Today. 1997;18(5):216–221. doi: 10.1016/s0167-5699(97)01036-0. [DOI] [PubMed] [Google Scholar]
- 16.Miller MJ, Hejazi AS, Wei SH, Cahalan MD, Parker I. Tcell repertoire scanning is promoted by dynamic dendritic cell behavior and random T cell motility in the LN. Proc Natl Acad Sci U S A. 2004;101(4):998–1003. doi: 10.1073/pnas.0306407101. [DOI] [PMC free article] [PubMed] [Google Scholar]
- 17.Rosen H, Sanna G, Alfonso C. Egress: a receptor-regulated step in lymphocyte trafficking. Immunol Rev. 2003;195:160–177. doi: 10.1034/j.1600-065x.2003.00068.x. [DOI] [PubMed] [Google Scholar]
- 18.Schwab SR, Cyster JG. Finding a way out: lymphocyte egress from lymphoid organs. Nat Immunol. 2007;8(12):1295–1301. doi: 10.1038/ni1545. [DOI] [PubMed] [Google Scholar]
- 19.Smith JB, McIntosh GH, Morris B. The traffic of cells through tissues: a study of peripheral lymph in sheep. J Anat. 1970;107(Pt 1):87–100. [PMC free article] [PubMed] [Google Scholar]
- 20.Miller MJ, Safrina O, Parker I, Cahalan MD. Imaging the single cell dynamics of CD4+ T cell activation by DCs in LNs. J Exp Med. 2004;200(7):847–856. doi: 10.1084/jem.20041236. [DOI] [PMC free article] [PubMed] [Google Scholar]
- 21.Castellino F, Huang AY, Altan-Bonnet G, Stoll S, Scheinecker C, Germain RN. Chemokines enhance immunity by guiding naive CD8+ T cells to sites of CD4+ T cell-dendritic cell interaction. Nature. 2006;440(7086):890–895. doi: 10.1038/nature04651. [DOI] [PubMed] [Google Scholar]
- 22.Van den Broeck W, Derore A, Simoens P. Anatomy and nomenclature of murine LNs: Descriptive study and nomenclatory standardization in BALB/cAnNCrl mice. J Immunol Methods. 2006;312(1-2):12–19. doi: 10.1016/j.jim.2006.01.022. [DOI] [PubMed] [Google Scholar]
- 23.Cahill RN, Frost H, Trnka Z. The effects of antigen on the migration of recirculating lymphocytes through single LNs. J Exp Med. 1976;143(4):870–888. doi: 10.1084/jem.143.4.870. [DOI] [PMC free article] [PubMed] [Google Scholar]
- 24.Hall JG, Morris B. The immediate effect of antigens on the cell output of a LN. Br J Exp Pathol. 1965;46(4):450–454. [PMC free article] [PubMed] [Google Scholar]
- 25.Shiow LR, Rosen DB, Brdicková N, et al. CD69 acts downstream of interferon-alpha/beta to inhibit S1P1 and lymphocyte egress from lymphoid organs. Nature. 2006;440(7083):540–544. doi: 10.1038/nature04606. [DOI] [PubMed] [Google Scholar]
- 26.Sprent J, Miller JF, Mitchell GF. Antigen-induced selective recruitment of circulating lymphocytes. Cell Immunol. 1971;2(2):171–181. doi: 10.1016/0008-8749(71)90036-0. [DOI] [PubMed] [Google Scholar]
- 27.Jenkins MR, Webby R, Doherty PC, Turner SJ. Addition of a prominent epitope affects influenza A virus-specific CD8+ T cell immunodominance hierarchies when antigen is limiting. J Immunol. 2006;177(5):2917–2925. doi: 10.4049/jimmunol.177.5.2917. [DOI] [PubMed] [Google Scholar]
- 28.Kedl RM, Rees WA, Hildeman DA, et al. T cells compete for access to antigen-bearing antigen-presenting cells. J Exp Med. 2000;192(8):1105–1113. doi: 10.1084/jem.192.8.1105. [DOI] [PMC free article] [PubMed] [Google Scholar]
- 29.Hochweller K, Wabnitz GH, Samstag Y, Suffner J, Hämmerling GJ, Garbi N. DCs control T cell tonic signaling required for responsiveness to foreign antigen. Proc Natl Acad Sci U S A. 2010;107(13):5931–5936. doi: 10.1073/pnas.0911877107. [DOI] [PMC free article] [PubMed] [Google Scholar]
- 30.Brocker T. Survival of mature CD4 T lymphocytes is dependent on major histocompatibility complex class II-expressing DCs. J Exp Med. 1997;186(8):1223–1232. doi: 10.1084/jem.186.8.1223. [DOI] [PMC free article] [PubMed] [Google Scholar]
- 31.Witherden D, van Oers N, Waltzinger C, Weiss A, Benoist C, Mathis D. Tetracycline-controllable selection of CD4(+) T cells: half-life and survival signals in the absence of major histocompatibility complex class II molecules. J Exp Med. 2000;191(2):355–364. doi: 10.1084/jem.191.2.355. [DOI] [PubMed] [Google Scholar]
- 32.Takada K, Jameson SC. Self-class I MHC molecules support survival of naive CD8 T cells, but depress their functional sensitivity through regulation of CD8 expression levels. J Exp Med. 2009;206(10):2253–2269. doi: 10.1084/jem.20082553. [DOI] [PMC free article] [PubMed] [Google Scholar]
- 33.Michie CA, McLean A, Alcock C, Beverley PC. Lifespan of human lymphocyte subsets determined by CD45 isoforms. Nature. 1992;360(6401):264–265. doi: 10.1038/360264a0. [DOI] [PubMed] [Google Scholar]
- 34.Hellerstein MK, Hoh RA, Hanley MB, et al. Subpopulations of long-lived and short-lived T cells in advanced HIV-1 infection. J Clin Invest. 2003;112(6):956–966. doi: 10.1172/JCI17533. [DOI] [PMC free article] [PubMed] [Google Scholar]
- 35.Vrisekoop N, den Braber I, deBoer AB, et al. Sparse production but preferential incorporation of recently produced naive T cells in the human peripheral pool. Proc Natl Acad Sci U S A. 2008;105(16):6115–6120. doi: 10.1073/pnas.0709713105. [DOI] [PMC free article] [PubMed] [Google Scholar]
- 36.Soderberg KA, Payne GW, Sato A, Medzhitov R, Segal SS, Iwasaki A. Innate control of adaptive immunity via remodeling of LN feed arteriole. Proc Natl Acad Sci U S A. 2005;102(45):16315–16320. doi: 10.1073/pnas.0506190102. [DOI] [PMC free article] [PubMed] [Google Scholar]
- 37.van Heijst JWJ, Gerlach C, Swart E, et al. Recruitment of antigen-specific CD8+ T cells in response to infection is markedly efficient. Science. 2009;325(5945):1265–1269. doi: 10.1126/science.1175455. [DOI] [PubMed] [Google Scholar]
- 38.Arstila TP, Casrouge A, Baron V, Even J, Kanellopoulos J, Kourilsky P. A direct estimate of the human alphabeta T cell receptor diversity. Science. 1999;286(5441):958–961. doi: 10.1126/science.286.5441.958. [DOI] [PubMed] [Google Scholar]
- 39.Warren RL, Freeman JD, Zeng T, et al. Exhaustive T-cell repertoire sequencing of human peripheral blood samples reveals signatures of antigen selection and a directly measured repertoire size of at least 1 million clonotypes. Genome Res. 2011;21(5):790–797. doi: 10.1101/gr.115428.110. [DOI] [PMC free article] [PubMed] [Google Scholar]
- 40.Luby M, Sinclair A, Zuckerman D. Optimal speedup of Las Vegas algorithms. Inf Process Lett. 1993;47:173–180. [Google Scholar]
- 41.Reischuk R, Textor J. Stochastic Search with Locally Clustered Targets: Learning from T Cells. In: Lio P, Nicosia G, Stibor T, editors. ICARIS 2011. Berlin, Heidelberg: Springer-Verlag; 2011. pp. 146–159. Vol LNCS 6825. [Google Scholar]
- 42.Textor J, Peixoto A, Henrickson SE, Sinn M, von Andrian UH, Westermann J. Defining the quantitative limits of intravital two-photon lymphocyte tracking. Proc Natl Acad Sci U S A. 2011;108(30):12401–12406. doi: 10.1073/pnas.1102288108. [DOI] [PMC free article] [PubMed] [Google Scholar]
- 43.Bajénoff M, Egen JG, Koo LY, et al. Stromal cell networks regulate lymphocyte entry, migration, and territoriality in LNs. Immunity. 2006;25(6):989–1001. doi: 10.1016/j.immuni.2006.10.011. [DOI] [PMC free article] [PubMed] [Google Scholar]
- 44.Iwasa Y, Higashi M, Yamamura N. Prey distributions as a factor determining the choice of optimal foraging strategy. Am Nat. 1981;117:710–723. [Google Scholar]
- 45.Fossum S, Smith ME, Ford WL. The recirculation of T and B lymphocytes in the athymic, nude rat. Scand J Immunol. 1983;17(6):551–557. doi: 10.1111/j.1365-3083.1983.tb00823.x. [DOI] [PubMed] [Google Scholar]
- 46.Hardin G. The competitive exclusion principle. Science. 1960;131(3409):1292–1297. doi: 10.1126/science.131.3409.1292. [DOI] [PubMed] [Google Scholar]
- 47.De Boer RJ, Perelson AS. How diverse should the immune system be? Proc Biol Sci. 1993;252(1335):171–175. doi: 10.1098/rspb.1993.0062. [DOI] [PubMed] [Google Scholar]
- 48.Hataye J, Moon JJ, Khoruts A, Reilly C, Jenkins MK. Naive and memory CD4+ T cell survival controlled by clonal abundance. Science. 2006;312(5770):114–116. doi: 10.1126/science.1124228. [DOI] [PubMed] [Google Scholar]
Associated Data
This section collects any data citations, data availability statements, or supplementary materials included in this article.