Abstract
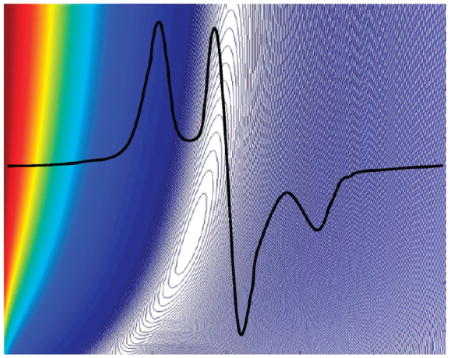
Dendrimers are attractive templates to display functional molecular components. Since the behavior of dendrimer systems can depend greatly on the accessibility of these molecular components to the external environment, and on the spatial arrangement of functional groups attached to the dendrimer terminal branches (end-groups), techniques to determine the locations of end-groups are highly desirable. In this report, we describe a method to analyze the EPR spectra of multiple generations of poly(amidoamine) (PAMAM) dendrimers which have spin-labels attached to end-groups in variable percentages of the total number of available sites. The spectra are treated as a convolution of a narrow spin-label spectrum and a variable line broadening function. Trends in the parameters that describe the best-fit line broadening function with spin-label loading reveal the spatial arrangements and homogeneity of spin environments of the labels. We observe a shift in the end-group distribution from generation 3 (G(3)) to G(4) dendrimers that indicates a change in morphology from an open, extended structure to a more dense, compact arrangement.
INTRODUCTION
Dendrimers are nanometer size, highly branched, polymeric molecules that are constructed iteratively on a multifunctional initiator core. They have been the focus of a great number of studies due to their prospects to advance technologies in medicine,1–5 catalysis,6 sensing,7,8 and light harvesting.9–11 The allure of dendrimers lies in their compact structure, mono-dispersity, controllable size, and large number of terminal branches (end-groups) which increases exponentially with the number of iterative branching steps or “generations” completed during synthesis.12–14 Dendrimer end-groups can be coupled to one or more functional groups to impart specific properties to the molecules. The variability of the dendrimer backbone and core composition in conjunction with end-group functionality provides endless possibilities to the types of conceivable systems.12 Since the active components of dendrimer systems such as targeting and therapeutic agents are often attached to branch termini and since the properties of the system may depend heavily upon the location of these groups, knowledge of the spatial arrangements and dynamics of the end-groups is essential to design dendrimers with predictable behaviors.
Scattering and computational methods have been used to probe dendrimer end-group locations. A 2004 review by Ballauff and Likos15 states that results from these investigations point to flexible uncharged dendrimers adopting a “dense core” configuration in which the end-groups are distributed throughout the entire volume of the molecule as opposed to the “dense shell” model originally touted by de Gennes and Hervet16 where end-groups are confined near the exterior of the molecular volume. More recent theoretical work supports the concept that dendrimer arms back-fold to access the interior space of the dendrimer. A molecular dynamics (MD) study17 of fourth through sixth generation poly(amidoamine) (G(4)–G(6) PAMAM) dendrimers by Maiti et al. found significant back-folding of the dendrimer end-groups for all generations and pHs studied. Opitz and Wagner18 also employed MD simulations with G(2)–G(5) PAMAM dendrimers and found that the terminal primary amines can access the center of the molecule through back-folding, as did a MM study by Brocorens.19
Generational dependences of end-group distributions have been considered in multiple investigations. Several molecular mechanics studies20–23 describe a generational dependence on dendrimer configurations where high generation dendrimers adopt compact dense profiles but lower generation dendrimers are more open and extended. A small-angle X-ray scattering (SAXS) study24 of PAMAM dendrimers in methanol by Prosa, Bauer, and Amis also recognized this trend; G(3) PAMAMs displayed scattering characteristics comparable to star polymers, while increasing the generation through G(8) showed a progression to scattering characteristics comparable to constant density hard spheres. Other studies further indicate a shift in dendrimer morphology from open, less dense systems to compact, spherically shaped dendrimers with increasing branch back-folding as generations are added.25–28 However, a substantial number of investigations do not exhibit this generational change in terminal monomer density profiles, instead concluding that the end-groups are distributed throughout the entire molecule regardless of the number of generations.29–34
The size of dendrimers, expressed by the radius of gyration (Rg), is measurable by scattering experiments and is used to validate monomer density profiles determined by simulations. However, it was recently pointed out that this comparison can be misleading, as it is possible for Rg to remain nearly constant for significantly different radial density profiles.35 It has also been shown that inferring the location of end-groups by comparing the Rg value arising from the end-groups lone with the Rg of the whole molecule36 can be deceiving. Using a Brownian dynamics simulation, Adolf et al. showed that it is possible for Rg for the end-groups alone to be larger than Rg for the entire molecule, despite the end-groups being distributed throughout the molecule.32 These reports make it evident that caution needs to be used when comparing and validating computation results with scattering experiments and that alternate techniques to probe dendrimer end-group locations would be extremely helpful.
Magnetic resonance can give additional insight into this problem. Gorman et al.37 studied the nuclear relaxation of protons on dendrimer arms attached to the paramagnetic [Fe4S4−(SR4)]2− core for dendrimers up to G(3) using NMR. They found that the protons of the terminal and all sub generations were able to closely approach the paramagnetic core. Dendrimer end-groups have been coupled to paramagnetic spin-labels by a number of investigators, facilitating their study by electron paramagnetic resonance spectroscopy (EPR).38–49 Previously, we reported a methodology for analyzing the EPR spectra of heterogeneously functionalized G4 PAMAM dendrimers, in which one of the substituent groups was a 2,2,6,6-tetramethylpiperidine N-oxide (TEMPO) spin-label.47 This report did not aim to address radial end-group distributions analogous to many scattering and computational studies but rather intended to reveal relative spatial arrangements of functional groups on the dendrimer. Particularly, we focused on whether functional groups in substoichiometric quantities were bound in a random or an ordered fashion. It was found that the functional groups were randomly distributed, producing all physically reasonable interspin distances. To determine this, simulated trends in the EPR line broadening as a function of spin-label loading, measured by peak-height ratios, were compared to trends obtained experimentally. The model initially assumed that the spins were constrained to the surface of a sphere; however, to account for differences between the best-fit model and the experimental results, surface roughness was included in the model. We concluded that the end-groups of G(4) dendrimers are not confined to the outer surface of the molecule but rather occupy a shell of space at least 16 Å thick, lending three-dimensional character to the space occupied by the spins. We deduced that the trend in EPR line widths of spin-labeled dendrimers as a function of spin-label loading are sensitive to both relative spatial locations of the labels and the dimensionality of the space occupied by the spins.
In this report, we extend our treatment of line broadening trends to include G(0), G(1), G(2), G(3), G(4), and G(6) PAMAM dendrimers. We introduce a convenient method to fit EPR spectra of dendrimers spin-labeled to various degrees using a convolution of a variable line broadening function (LBF) and a narrow, noninteracting spin-label spectrum. The LBF has only two variable parameters whose values are used to describe the progression of spectral traits in relation to increasing spin-label densities. Extraction of these two parameters is done in place of measuring simple peak-height ratios from experimental spectra—as in our previous report—as a way to measure spin-label broadening.
EXPERIMENTAL METHODS
Dendrimer Functionalization
G(0), G(1), G(2), G(3), G(4), and G(6) PAMAM dendrimers were purchased from Dendritech, Inc. Spin-labels were attached to dendrimers via a thiourea linkage by reaction with 4-isothiocyanato-2,2,6,6-tetra-methylpiperdine-N-oxide (NCS-TEMPO) (see reaction scheme 1 in ref 47) in the following manner: Solutions of dendrimers in DMSO were prepared at a concentration of 25 mM in end-group concentration. The average numbers of end-groups for the dendrimers that we studied were found to be 4, 8, 16, 32, 55, and 212, respectively, through a MALDI TOF MS analysis. The fewer than nominal numbers of end-groups for G(4) and G(6) are attributable to nonideal dendrimer growth.13 A 25 mM solution of NCS-TEMPO, also in DMSO, was added to the dendrimer solutions in amounts of 5, 10, 25, 50, 75, 90, 95, and 100% of the dendrimer solution volume to create spin-label loading percentages equivalent to the added volume percentage. DMSO was added to the reactions in sufficient amounts so that all reactions had the same volume as the reaction for the 100% TEMPO functionalization reaction. The reagents were allowed to react for a period of at least three days. Average spin-label loadings were verified by MALDI TOF MS, as described earlier in ref 50. The amount of unbound spin-label in all samples except the 100% TEMPO functionalized sample was determined to be negligible by EPR at room temperature; the EPR peak from unbound TEMPO in fluid solution is distinguishable from the dendrimer bound label due to its significantly faster rotational correlation time, resulting in a much sharper peak. Removal of the unbound label and the associated sharp EPR peak from the 100% functionalized dendrimer sample was achieved using a G-25 Sephadex spin-column. Dendrimer solutions were diluted by a factor of 2 with a 1:1 mixture of DMSO:glycerol for a final solvent composition of 3:1 DMSO:glycerol for EPR measurements. G(5) was omitted from this study, since spin-label loadings were not found to follow the same average loading and loading distribution patterns as the other generations.
EPR Measurements
Continuous wave EPR spectra were recorded at ~9.2 GHz for all spin-labeled samples at 76 K (boiling liquid nitrogen) in a Varian E-109 spectrometer modified by the incorporation of an external field-sweep unit obtained from the University of Denver. The computer interface system provides for sweep control and data acquisition in a LabVIEW environment. Recording conditions were established to avoid artificial broadening of the EPR spectra.
Spectral Fitting
In our previous work with G(4) PAMAM dendrimers, we used the peak-height ratio, A/B, as a useful measurement of spin-label dipolar interactions (Figure 1). This peak-height ratio is a useful parameter within the confines of a distinct system. However, as can be seen in Figure 1, peak-height ratios do not distinguish variations in spectra for systems with different label arrangements; although both spectra in Figure 1 have the same peak-height ratio, the spectra of unbound TEMPO in solution and of the spin-label attached to a G(4) dendrimer scaffold are markedly different in the “troughs” and “wings” of the spectrum. It is therefore necessary to include a parameter that gives information about the spectrum shape, in addition to one that measures width when describing spectra that originate from different systems, such as the multiple generations of dendrimers in this report.
Figure 1.
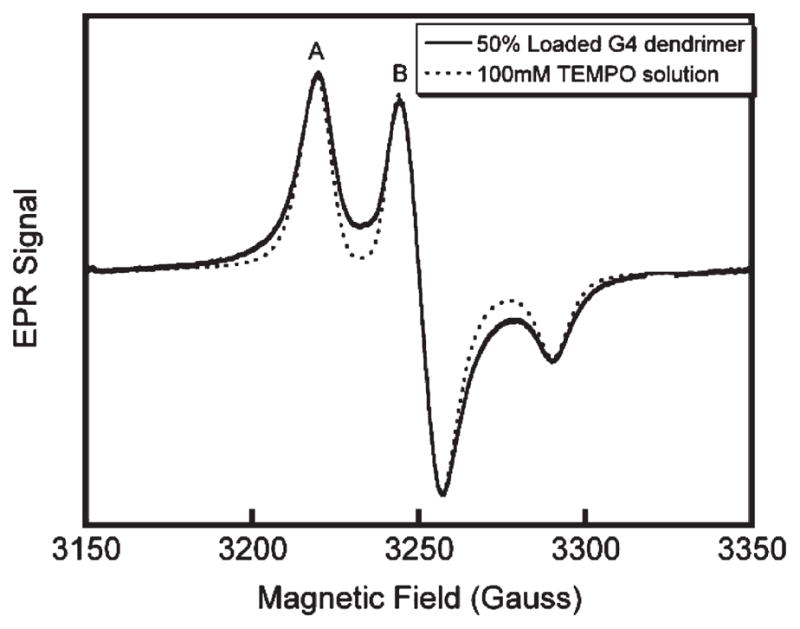
Spin-label EPR spectra with the same peak-height ration, A/B, but with different shapes.
A common treatment for CW EPR spectra of pairs of interacting spin-labels is to consider the spectra as a convolution of a narrow spectrum and a line broadening function (LBF).51,52 Typically, a dipolar spectrum is obtained through the use of the Fourier deconvolution method, where an experimentally broad spectrum is separated into a previously measured narrow spectrum for noninteracting spins and an LBF. The LBF is first adjusted to account for unbound spin-labels and then is fit with a Gaussian or set of Gaussian functions, the width(s) of which is(are) associated with the interlabel distance(s). However, this method is not appropriate for dealing with systems with more than two interacting spin-labels. As was demonstrated with TEMPO functionalized G(4) PAMAM dendrimers, one method of analyzing EPR data obtained from compounds with many spin-labels is to assume a certain spin arrangement and then calculate a line broadening function for each spin. These LBFs are summed together to afford an overall line broadening function for the system which is convolved with a narrow, noninteracting spin-label spectrum to simulate the broadened spectrum and extract parameters such as peak-height ratios.47
Calculating line broadening functions using the above method assumes that the contribution to the function from each spin-label has the same area; the shape of the overall LBF that is calculated in this way cannot be described simply with a width parameter such as a fwhm, since this would unfairly bias the narrower components which have a higher amplitude and highly neglect the broader components of the function which have a lower amplitude. The contributions from narrow and broad components of a LBF when convolved with a narrow spectrum are best imagined in the limits of an infinitely narrow delta-function that has no off-center area, and a function with large width that has sizable off-center amplitude. Upon convolution, the delta function will leave the narrow spectrum unchanged while the large width function can broaden the spectrum to the extent that it is no longer discernible. Since the amplitude of the off-center region of the LBF is responsible for the broadening incurred, it is imperative to consider not only the width of the function but also its shape, especially in determining the amount of significant amplitude in the off-center region of the dipolar spectrum. Including a shape parameter in the LBF as we do here in addition to a width parameter accomplishes this.
The Pearson VII function approximates Voight line shapes and can be easily varied between super-Lorentzian, Lorentzian, and Gaussian line shapes, allowing for more or less emphasis to be placed on the outer wing regions of the spectrum. The Pearson VII function is defined by eq 1.
| (1) |
where W is the width of the function and M is a shape parameter. The function becomes Lorentzian at M = 1, approximates a Gaussian at M = ∞, and is super-Lorentzian at M < 1. A plot of the Pearson VII function for different M values and constant width is shown in Figure 2. Using the Pearson VII as a variable line broadening function, and a 1 mM TEMPO solution spectrum as the unbroadened (noninteracting) spectrum, the broadened spectra of G(0), G(1), G(2), G(3), G(4), and G(6) dendrimers for spin-label loadings of 5, 10, 25, 50, 75, 90, 95, and 100% were fit using the procedure described below.
Figure 2.
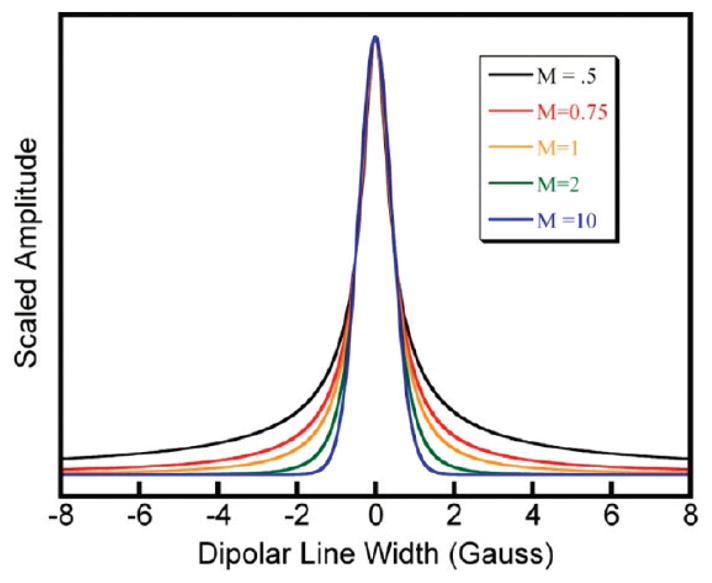
Pearson VII functions with the same width but different M values.
A program with a graphical user interface was written in LabVIEW to carry out the fitting procedure. Initial Pearson VII M and W values were selected, and the 1 mM TEMPO spectrum and the broadened spectrum to be fit were loaded into the program. All of the spectra were baseline corrected by adding or subtracting a straight line and monitoring the appearance of the spectra and integrated spectra in a separate LabVIEW program before they were loaded into the fitting program. No additional baseline correction was done once the spectra were fit. Each spectrum was normalized by dividing all the points in the spectrum by a constant so that the double integral values were equal to 1. The Pearson VII function with the selected parameters was generated and multiplied with the narrow spectrum in Fourier space and back transformed, resulting in a convolved, broadened spectrum. The convolved spectrum was renormalized and the root-mean-square deviation (rmsd) between the experimental and fit spectra was calculated. The program then looped through a series of M and W values and calculated rmsd values for every combination of M and W in the series. This fitting procedure was repeated for all generations and spin-label loadings. For all generations, M was initially set to 0.5 and was incremented by 0.005 300 times. W was initially set to 0.1 and was incremented by 0.01 1000 times for G(0) and G(1), 2000 times for G(2) and G(3), and 3000 times for G(4) and G(6). The entire set of rmsd values for each spectrum fit was inserted into an M × W array.
Error Analysis
Errors arise in the fitting routine from several sources. The calculation of double integral values is not exact due to noise and baseline drift. The use of the Pearson VII function as a representation of the true LBF is an approximation, as is the treatment of the broadened spectrum as a convolution of a narrow spectrum and a LBF, which erroneously broadens every point in the spectrum equally.
Finding the error limits for the best M and W values from the relative rmsd arrays was done using a heuristic approach. A program was written in LabVIEW that allows the user to choose the M and W values of the Pearson VII with which the narrow spectrum is convolved. A plot window displayed the experimental spectrum being fit, the convolved spectrum, the residual, and an output box displaying the relative rmsd. M and W were originally set to the values that correspond to the best-fit and were then varied by small increments while examining the residual line. Changes in M and W were made until the features of the residual line changed systematically; only the amplitudes of the residual components changed with no new features appearing. For the wide range of fits that were examined in this way, the transition to a systematically changing residual line occurred well before the relative rmsd changed by 5%.
A series of programs was written in MATLAB to plot the M × W arrays as contour plots, and to determine the ranges of M and W values for all of the fit spectra that fell within the 5% limit. The error limits for each fit were found by scaling the associated array by dividing all of the values by the minimum element and then subtracting 1.05 from the scaled rmsd surface which sets the intercepts of the surface equal to 5% above the minimum element. Two vectors were extracted from each array: the first vector contained the minimum values of the adjusted rmsd for each W used in the fitting loop while allowing M to vary, and the second vector contained the minimum adjusted rmsd values for each M while allowing W to vary. The values in these vectors correspond to the shortest, lowest possible paths across the error surface along each axis, with their roots corresponding to the error limits. To determine the roots, each vector was truncated to contain only the minimum value plus 100 elements adjacent to either side of the minimum. The vectors were plotted versus the corresponding M or W values, a 10th degree polynomial was fit to these points, and the real roots of the polynomial within a specified range near the minimum value were determined.
The associated errors determined using this method ignore the correlation between M and W, so that the values that were within error are those that are associated with the minimal box that encloses the 0.05 contour.
RESULTS, ANALYSIS, AND DISCUSSION
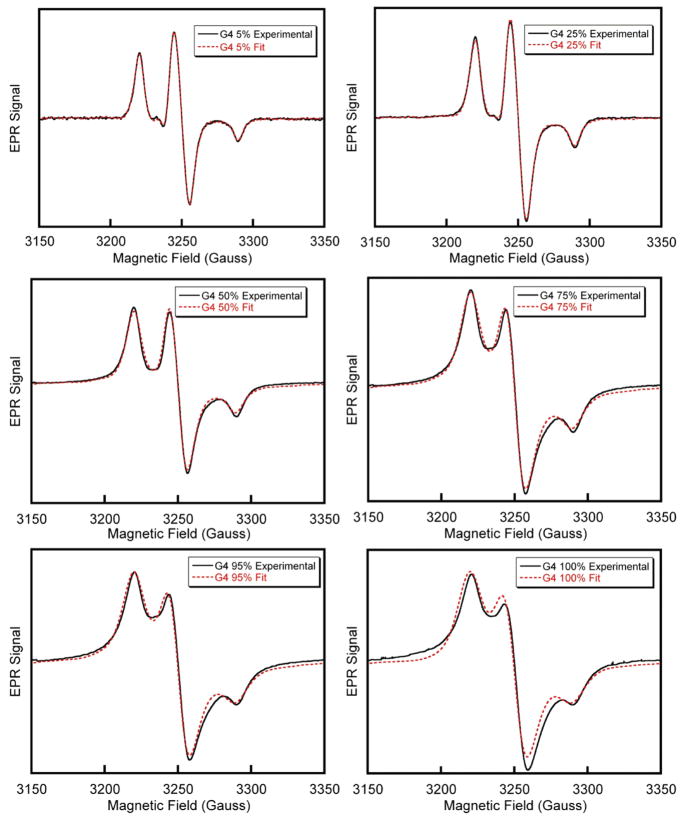
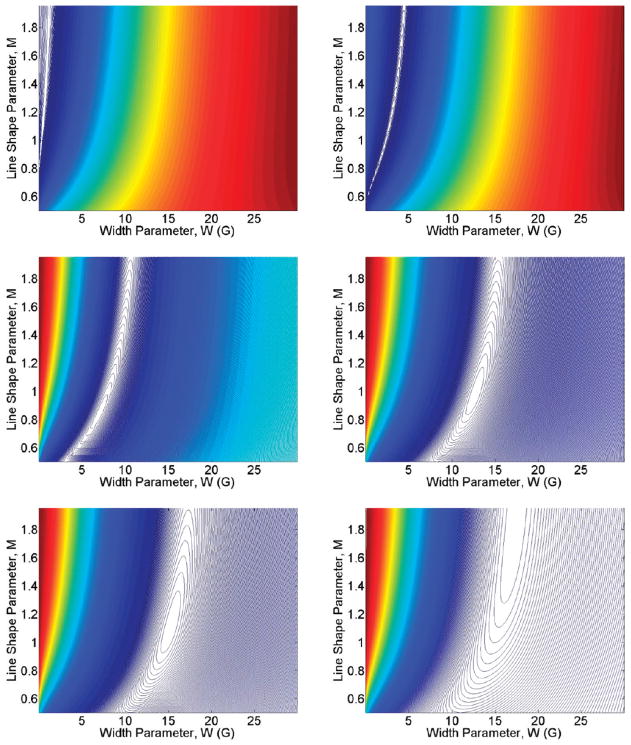
A comparison of the best-fits obtainable by the convolution of a narrow spectrum with a variable Pearson VII function together with the experimental data for G(4) dendrimers with various spin-label loadings is shown in Figure 3. The fitting procedure is able to achieve excellent fits when the best-fit Pearson VII line width is less than 15 G (<90% loading for G(4)) and remain agreeable at higher line widths. The adjusted rmsd error surfaces corresponding to G(4) dendrimer fits in Figure 3 are shown in Figure 4. The minima of these surfaces correspond to the best M and W values used for the fits and illustrate how the quality of the fits deteriorates by adjusting M and W from the best values. The contour spacing is set at 0.1 corresponding to 10% steps in increased adjusted rmsd values. Complete results including experimental spectra with fits and error surfaces are tabulated in the Supporting Information.
Figure 3.
EPR spectra (solid black lines) and fits (dashed red lines) of G(4) PAMAM dendrimers with spin label loadings of 5, 25, 50, 75, 95, and 100%.
Figure 4.
Scaled error (rmsd) surfaces corresponding to the fits for the G(4) dendrimer spin-label loadings shown in Figure 3. The plots illustrate how the qualities of the fits correlate with varying M and W.
Trends in PearsonVII Widths with Loading
The best-fit Pearson II widths (W) were plotted as a function of the degree of functionalization for all generations. For each generation, a second degree polynomial with no constant term was fit to the data. For comparison purposes, the polynomials are divided by their value at 100% loading and are shown in Figure 5. Unscaled, individual plots with error bars are provided in the Supporting Information. The salient feature in Figure 5 is the change in curvature of the fits of width with loading, shifting from a high curvature fit for G(0), near linear fits for G(4) and G(6), and an intermediate case for G(1)–G(3).
Figure 5.
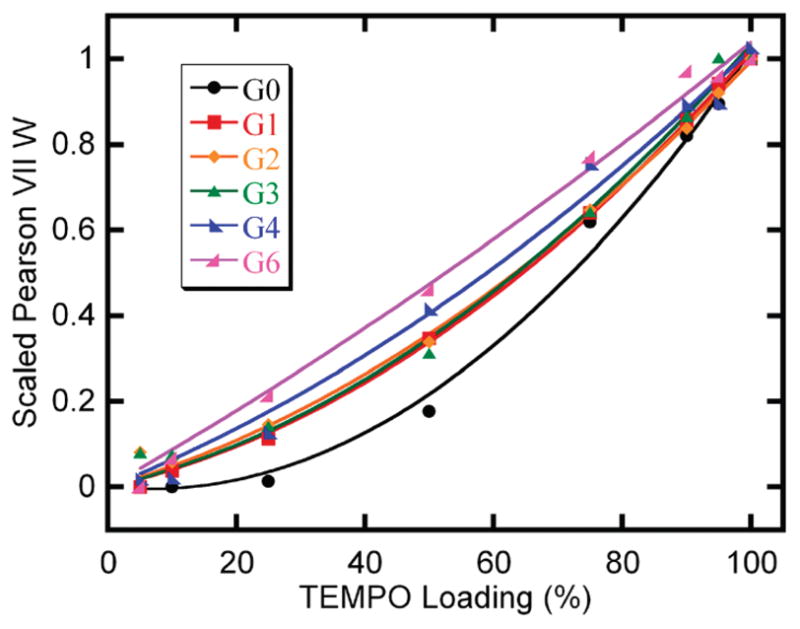
Scaled trends in the best-fit Pearson VII width parameter, W, for all generations and spin-label loadings.
Through an analysis of computer generated arrangements of spins, we previously reported that trends in widths with progressive spin densities for randomly populated lattices vary depending on the dimensionality of the lattice.47 In particular, dipolar widths as a function of spin density for spins constrained to a line follow a cubic trend, spins on a surface follow a quadratic trend, and spins in a three-dimensional space follow a linear trend.
Comparison of the calculated trends with the experimental results for spin-labeled dendrimers suggests that spins appended to higher generation dendrimers (G(4) and G(6)) occupy a three-dimensional volume and spins bound to lower generations are positioned as if they were on a surface. G(0) dendrimers, which have only four end-groups, are a special case. On average, only one spin-label is attached to G(0) PAMAMs at loadings of less than 50% and loadings of 50 or 75% correspond to only two or three spins. Above 75% functionalization, there are three to four labels on average for each dendrimer until complete end-group occupancy is reached. Therefore, for G(0) at loadings of less than 50%, no significant line broadening is detected in the EPR spectrum, since the spins are isolated. At 50% loading, spectral broadening is still significantly lower for G(0) than for the other generations, since, on average, there are only two spins and therefore they occupy a one-dimensional space which accumulates line width slower than systems with higher dimensionality. Once 75% loading has been achieved, the scaled results from G(0) are comparable to the results for G(1), G(2), and G(3).
The change in the dimensionality of the space defined by spin-label positions from G(3) to G(4) dendrimers indicates a shift in end-group morphology. We hypothesize that generations of dendrimers up to and including G(3) possess a primarily open structure with outstretched arms, and higher generations (G(4) and G(6)) have more compact structures with significant arm back-folding that allows the end-groups to access the interior of the molecule in agreement with some previous studies.20–28 The two-dimensional character for small PAMAMs indicates that labels are only affected by other labels that lie more or less within the same plane but do not interact with spins in the interior region of the molecule. This demonstrates that all spins are in the surface region, and spin-labels do not penetrate the molecule enough to be in proximity to labels on the other side of the dendrimer, nor are they within a “plateau region” of regular spin-label density, as has been modeled for higher generation dendrimers.19
This situation changes for G(4) and G(6) dendrimers. The progression of width with spin-label density follows the same trend as that for increasing free label concentration in solution, indicating that the area accessible to the spin-labels is three-dimensional. This 3-D character is most likely due to back folding of the end-groups as predicted by modeling. However, generations 4 and 6 have less than their theoretically possible numbers of end-groups, and deletions that resulted in shortened dendrimer arms may also have contributed to the observed 3-D character.
Trends in PearsonVII Shape Parameter with Loading and Generation
Plots of the Pearson VII shape parameter, M, as a function of loading for all generations are shown in Figure 6. M values for Pearson VII functions for fits with widths less than 2 (<25% loading for G(4)) are not considered, since changes in M become insignificant as W becomes small; the gradual slopes—corresponding to huge error bars—across the rmsd surfaces in the M direction for fits of dendrimer spectra with low spin loadings demonstrate this. Error bars in Figure 6 are omitted for clarity. Individual plots with error bars are shown in the Supporting Information.
Figure 6.
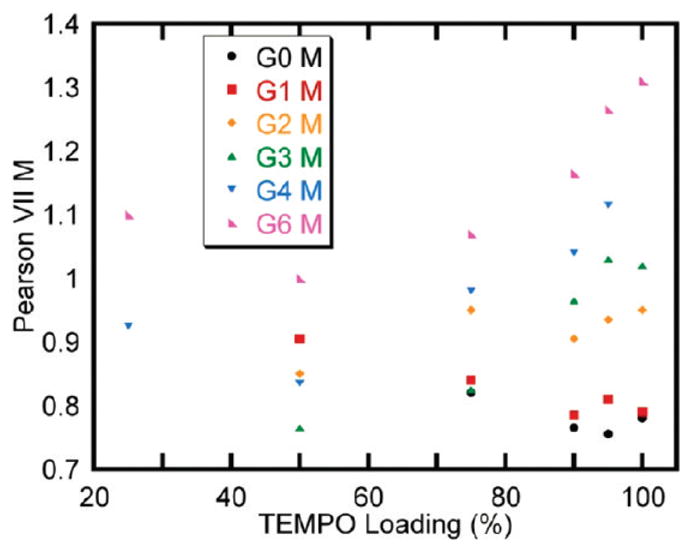
Trends in the best-fit Pearson VII shape parameter, M, for all generations and spin-label loadings that have a Pearson VII W value greater than 2.
Changes in M with loading across generations are smaller than the changes that were observed for W, since the effect of M is nonlinear and most of the changes that M induces in the Pearson VII function occur between M values of 0 and 2, with more dramatic changes occurring at the lower end of this range. Unfortunately, since M values for fits with best W values of less than 2 were omitted, no points for 5 and 10% loadings were considered, and there are only two points at 25%. Despite the deficiency of M values at low loadings, some qualitative trends in M are apparent upon examination of Figure 6. When dendrimers are sparsely loaded either by having few possible spin binding sites (G(0)–G(2)) or by few available sites being occupied (high generations, low loadings), M specifies a super-Lorentzian LBF (M < 1). As the number of spins increases, there is an initial decrease in M values followed by a progression to more Gaussian line shapes. Furthermore, on average, the value of M increases as the generation number increases.
Insight into these trends follows from consideration of the way dipolar line shapes are built up. When Gaussian functions of the same width and area are summed together, the resultant line shape is a Gaussian. This situation arises when each spin is in a similar spin environment. The Pearson VII M value will be high (>1) in this case. However, when spins are in dissimilar spin environments, the width of the line broadening function for each spin will fall within a wide range of possible widths, and when these functions are added together, the resultant shape is better described by a Lorentzian, or super-Lorentzian, function, meaning a lower M value. At low loadings, spins are mostly isolated and in similar spin environments. As more spins are added to the system, spin densities will increase considerably near some spins, increasing their line width, but others will only be trivially affected. As yet more spins are added, the spin distribution will become more uniform until the full loading limit is reached. This distribution becomes more homogeneous at higher generation, since the widths of the line broadening functions are determined by a greater number of interactions. M values therefore give aqualitative gauge of the heterogeneity or homogeneity of spin neighbor distance distributions, with higher M values having more homogeneous distributions.
CONCLUSIONS
In this report, we describe a method to fit EPR spectra of multiple generations of PAMAM dendrimers functionalized to various degrees with TEMPO spin-labels. The spectra are treated as a convolution of a noninteracting spin-label spectrum and a Pearson VII function: a variable line broadening function that contains only two variable parameters, M and W, that control the shape and width of the function. The parameters that correspond to the best fit, along with error limits, are determined using fitting procedures in LabVIEW and Matlab.
Trends in the best-fit Pearson VII widths with increasing spin densities follow a quadratic trend for G(0), G(1), G(2), and G(3) dendrimers and a linear trend for G(4) and G(6) dendrimers. This change in the curvature for the trends in width between G(3) and G(4) signifies a shift in the dendrimer end-group distribution from localization near the surface of the molecules to dispersal throughout the molecular volume. Since the molecular weight of dendrimers increases exponentially with generation and the accessible volume is only accumulated cubically, there is a theoretical limit to the number of generations that can be completed with the end-groups localized near the surface. Beyond this limit, it is necessary for the dendrimer end-groups to access the interior space of the molecule to enable continued growth.19,34 The transition that we observe between G(3) and G(4) occurs before the lack of space near the surface necessitates back-folding. Boris and Rubinstein state that dendrimer conformations are decided by the balance between excluded volume interactions and the entropic cost of swelling the molecule further than a Gaussian configuration, and both of these forces prefer that end-groups occupy the interior space of the dendrimer.34 Dendrimer–solvent interactions are probably sufficient to overcome these forces at low generations, where these forces are weakest, and can account for the extended end-groups observed at these generations.
The best-fit Pearson VII M values give a qualitative measure of the homogeneity of the spin environments. At low spin densities, the high M values represent Gaussian functions signifying that the spins are in similar environments: the spin-labels are isolated from each other and do not feel the presence of other labels. Increasing the spin density initially increases the heterogeneity of the spin environments (lower M values) until a generation dependent loading is reached where the spin environments become homogeneous again: each spin-label feels the presence of many other labels in equal amounts.
Previously, we showed that EPR spectra of G(4) PAMAM dendrimers spin-labeled to various extents expose the relative spatial distribution of the labels and the dimensionality of the space that they occupy.47 Here, we expanded on that study to include multiple generations of dendrimers through the use of a reconvolution fitting procedure that extracts parameters that describe both the shape and the width of the dipolar line broadening function. The shape parameter reveals the homogeneity of the spin environment, and the trends in the width parameters distinguish between surface localized and distributed radial end-group distribution profiles. This technique is useful to validate computational models, and we anticipate that it is widely applicable to many different types of systems which are amenable to functionalization with collections of spin labels.
Supplementary Material
Footnotes
Supporting Information. Figures of EPR spectra and fits and error surfaces for all dendrimer generations and spin-label loadings, as well as trends in the best-fit Pearson VII M and W values as a function of spin-label loading with the corresponding error bars. This material is available free of charge via the Internet at http://pubs.acs.org.
References
- 1.Dutta T, Jain N, McMillan N, Parekh H. Nanomedicine. 2010;6:25. doi: 10.1016/j.nano.2009.05.005. [DOI] [PubMed] [Google Scholar]
- 2.Heegaard P, Boas U, Sorensen N. Bioconjugate Chem. 2010;21:405. doi: 10.1021/bc900290d. [DOI] [PubMed] [Google Scholar]
- 3.Kannan RM, Perumal OP, Kannan S. In: Biomedical applications of nanotechnology. Labhasetwar V, Leslie-Pelecky DL, editors. Wiley-Interscience; Hoboken, NJ: 2007. p. 105. [Google Scholar]
- 4.Villaraza A, Bumb A, Brechbiel M. Chem Rev. 2010;110:2921. doi: 10.1021/cr900232t. [DOI] [PMC free article] [PubMed] [Google Scholar]
- 5.Svenson S, Tomalia DA. In: Nanoparticulates as Drug Carriers. Torchilin VP, editor. Imperial College Press; London: 2006. p. 227. [Google Scholar]
- 6.Berger A, Klein Gebbink RJM, van Koten G. Top Organomet Chem. 2006;20:1. [Google Scholar]
- 7.Caminade A, Delavaux-Nicot B, Laurent R, Majoral J. Curr Org Chem. 2010;14:500. [Google Scholar]
- 8.Jayaraman N. In: Nanomaterials chemistry: recent developments and new directions. Rao CNR, Muller A, Cheetham AK, editors. Wiley-VCH; John Wiley, distributor; Weinheim, Germany; Chichester, U.K: 2007. p. 249. [Google Scholar]
- 9.Adronov A, Frechet J. Chem Commun. 2000;7:1701. [Google Scholar]
- 10.Andrews D. J Nanophotonics. 2008;2:022502. [Google Scholar]
- 11.Nantalaksakul A, Reddy D, Bardeen C, Thayumanavan S. Photosynth Res. 2006;87:133. doi: 10.1007/s11120-005-8387-3. [DOI] [PubMed] [Google Scholar]
- 12.Lee CC, MacKay JA, Frechet JMJ, Szoka FC. Nat Biotechnol. 2005;23:1517. doi: 10.1038/nbt1171. [DOI] [PubMed] [Google Scholar]
- 13.Tomalia DA, Baker H, Dewald J, Hall M, Kallos G, Martin S, Roeck J, Ryder J, Smith P. Polym J. 1985;17:117. [Google Scholar]
- 14.Newkome GR, Moorefield CN, Vogtle F. Dendrimers and dendrons: concepts, syntheses, applications. Wiley-VCH; Weinheim, Germany; New York: 2001. [Google Scholar]
- 15.Ballauff M, Likos CN. Angew Chem, Int Ed Engl. 2004;43:2998. doi: 10.1002/anie.200300602. [DOI] [PubMed] [Google Scholar]
- 16.De Gennes P, Hervet H. J Phys, Lett. 1983;44:351. [Google Scholar]
- 17.Maiti PK, Cagin T, Lin ST, Goddard WA. Macromolecules. 2005;38:979. [Google Scholar]
- 18.Opitz AW, Wagner NJ. J Polym Sci, Part B: Polym Phys. 2006;44:3062. [Google Scholar]
- 19.Brocorens P, Lazzaroni R, Bredas JL. J Phys Chem B. 2005;109:19897. doi: 10.1021/jp0520493. [DOI] [PubMed] [Google Scholar]
- 20.Cavallo L, Fraternali F. Chemistry Eur J. 1998;4:927. [Google Scholar]
- 21.Canetta E, Maino G. Nucl Instrum Methods Phys Res, Sect B. 2004;213:71. [Google Scholar]
- 22.Karatasos K, Adolf DB, Davies GR. J Chem Phys. 2001;115:5310. [Google Scholar]
- 23.Naylor AM, Goddard WA, Kiefer GE, Tomalia DA. J Am Chem Soc. 1989;111:2339. [Google Scholar]
- 24.Prosa TJ, Bauer BJ, Amis EJ. Macromolecules. 2001;34:4897. [Google Scholar]
- 25.Gotze IO, Likos CN. Macromolecules. 2003;36:8189. [Google Scholar]
- 26.Jana C, Jayamurugan G, Ganapathy R, Maiti PK, Jayaraman N, Sood AK. J Chem Phys. 2006;124:204719. doi: 10.1063/1.2194538. [DOI] [PubMed] [Google Scholar]
- 27.Lee I, Athey BD, Wetzel AW, Meixner W, Baker JR. Macromolecules. 2002;35:4510. [Google Scholar]
- 28.Mallamace F, Canetta E, Lombardo D, Mazzaglia A, Romeo A, Monsu Scolaro L, Maino G. Physica A. 2002;304:235. [Google Scholar]
- 29.Maiti PK, Cagin T, Wang GF, Goddard WA. Macromolecules. 2004;37:6236. [Google Scholar]
- 30.Giupponi G, Buzza DMA. J Chem Phys. 2004;120:10290. doi: 10.1063/1.1714829. [DOI] [PubMed] [Google Scholar]
- 31.Lescanec RL, Muthukumar M. Macromolecules. 1990;23:2280. [Google Scholar]
- 32.Lyulin AV, Davies GR, Adolf DB. Macromolecules. 2000;33:6899. [Google Scholar]
- 33.Lyulin SV, Evers LJ, van der Schoot P, Darinskii AA, Lyulin AV, Michels MAJ. Macromolecules. 2004;37:3049. [Google Scholar]
- 34.Boris D, Rubinstein M. Macromolecules. 1996;29:7251. [Google Scholar]
- 35.Porcar L, Hong KL, Butler PD, Herwig KW, Smith GS, Liu Y, Chen WR. J Phys Chem B. 2010;114:1751. doi: 10.1021/jp9064455. [DOI] [PubMed] [Google Scholar]
- 36.Topp A, Bauer BJ, Klimash JW, Spindler R, Tomalia DA, Amis EJ. Macromolecules. 1999;32:7226. [Google Scholar]
- 37.Gorman CB, Hager MW, Parkhurst BL, Smith JC. Macromolecules. 1998;31:815. [Google Scholar]
- 38.Ottaviani MF, Jockusch S, Turro NJ, Tomalia DA, Barbon A. Langmuir. 2004;20:10238. doi: 10.1021/la0485881. [DOI] [PubMed] [Google Scholar]
- 39.Yordanov AT, Yamada KiK, Krishna MC, Mitchell JB, Woller E, Cloninger M, Brechbiel MW. Angew Chem, Int Ed Engl. 2001;40:2690. doi: 10.1002/1521-3773(20010716)40:14<2690::aid-anie2690>3.0.co;2-0. [DOI] [PubMed] [Google Scholar]
- 40.Bosman AW, Janssen RAJ, Miejer EW. Macromolecules. 1997;30:3606. [Google Scholar]
- 41.Ottaviani MF, Favuzza P, Sacchi B, Turro NJ, Jockusch S, Tomalia DA. Langmuir. 2002;18:2347. [Google Scholar]
- 42.Ottaviani MF, Matteini P, Brustolon M, Turro NJ, Jockusch S, Tomalia DA. J Phys Chem B. 1998;102:6029. [Google Scholar]
- 43.Ottaviani MF, Sacchi B, Turro NJ, Chen W, Jockusch S, Tomalia DA. Macromolecules. 1999;32:2275. [Google Scholar]
- 44.Ottaviani MF, Furini F, Casini A, Turro NJ, Jockusch S, Tomalia DA, Messori L. Macromolecules. 2000;33:7842. [Google Scholar]
- 45.Ottaviani MF, Turro NJ, Jockusch S, Tomalia DA. J Phys Chem B. 2003;107:2046. [Google Scholar]
- 46.Jockusch S, Turro NJ, Ottaviani MF, Tomalia DA. J Colloid Interface Sci. 2002;256:223. doi: 10.1016/j.jcis.2008.03.035. [DOI] [PubMed] [Google Scholar]
- 47.Walter ED, Sebby KB, Usselman RJ, Singel DJ, Cloninger MJ. J Phys Chem B. 2005;109:21532. doi: 10.1021/jp0515683. [DOI] [PubMed] [Google Scholar]
- 48.Han HJ, Sebby KB, Singel DJ, Cloninger MJ. Macromolecules. 2007;40:3030. [Google Scholar]
- 49.Samuelson LE, Sebby KB, Walter ED, Singel DJ, Cloninger MJ. Org Biomol Chem. 2004;2:3075. doi: 10.1039/B411643G. [DOI] [PubMed] [Google Scholar]
- 50.Woller EK, Walter ED, Morgan JR, Singel DJ, Cloninger MJ. J Am Chem Soc. 2003;125:8820. doi: 10.1021/ja0352496. [DOI] [PubMed] [Google Scholar]
- 51.Altenbach C, Oh KJ, Trabanino RJ, Hideg K, Hubbell WL. Biochemistry. 2001;40:15471. doi: 10.1021/bi011544w. [DOI] [PubMed] [Google Scholar]
- 52.Rabenstein MD, Shin YK. Proc Natl Acad Sci USA. 1995;92:8239. doi: 10.1073/pnas.92.18.8239. [DOI] [PMC free article] [PubMed] [Google Scholar]
Associated Data
This section collects any data citations, data availability statements, or supplementary materials included in this article.


