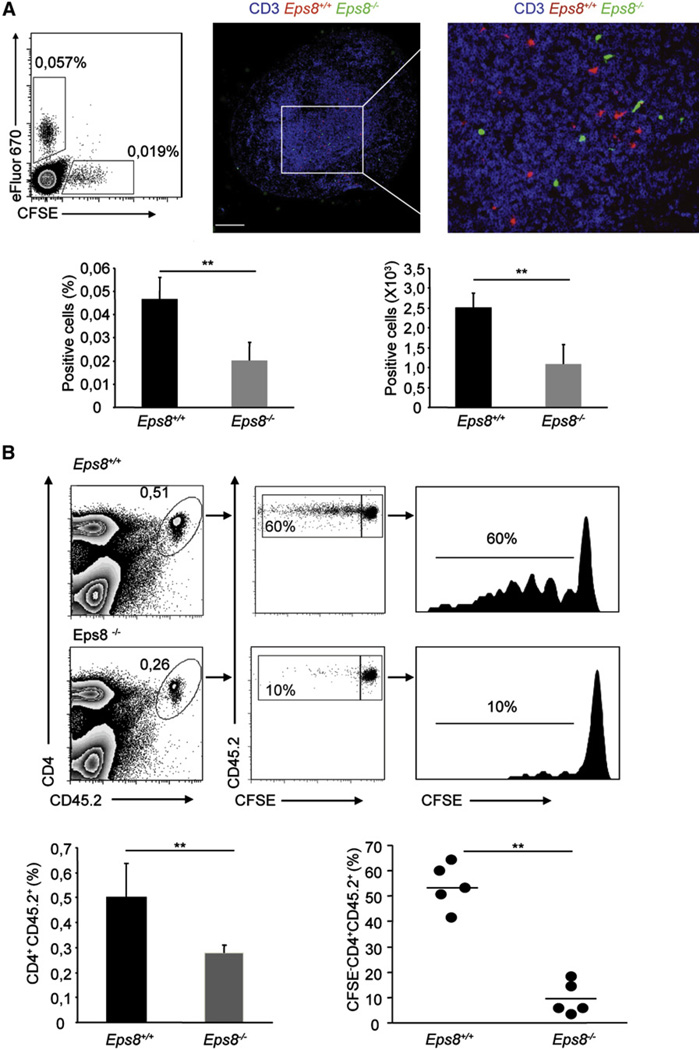
Figure 3. Impaired Trafficking and Antigen Presentation in DLNs of Subcutaneously Injected Eps8-Deficient DCs.
(A) Eps8-deficient DCs fail to migrate to DLNs. LPS-treated WT (Eps8+/+) or Eps8−/− (Eps8−/−) BMDCs were stained with either eFluor670 or CFSE, respectively. An equal number (1.5 × 10⁵) of WT and Eps8−/− labeled BMDCs were injected in the footpad. The number of migrated BMDCs to the popliteal DLN was assessed by flow cytometry after 24 hr. The top-left panel is a representative dot plot of three independent experiments. The percentage of eFluor670- or CFSE-positive DLN cells is shown. The top-right panel shows a confocal section of a popliteal DLN after migration of eFluor670-labeled WT (Eps8+/+), CFSE-labeled Eps8−/− (Eps8−/−) BMDCs, and anti-CD3 staining for visualization of the T cell area. The scale bar represents 250 µm. Data represent mean ± SD (n = 5 mice). **p < 0.01; *p < 0.05.
(B) Eps8−/− DCs fail to migrate to DLNs and to prime naive T cells. C57BL/6 Ly 5.1 mice were adoptively transferred with 2 × 10⁶ CFSE-labeled CD4 naive OT-II Ly 5.2 T cells. After 24 hr, mice were injected in the right or in the left footpad with 1.5 × 10⁵ WT (Eps8+/+) or Eps8−/− (Eps8−/−) mature Ova-loaded BMDCs, respectively. The popliteal DLNs were analyzed for assessing the percentage of CD4 Ly 5.2 T cells and the proliferation via CFSE dilution after 3 d. Left panels show the percentage of CD4+ and CD45.2+ positive cells in the DLN is shown. The middle panel shows the percentage of proliferated CD4+ and CD45.2+ T cells. Right panels show histograms of CFSE dilution in CD4+CD45.2+ T cells. Numbers above lines is the percentages of proliferating cells. Data represent the mean ± SD (n = 5 mice/group) of three independent experiments; **p < 0.01, *p < 0.05.

