

SUMMARY
Obesity and concomitant comorbidities have emerged as public health problems of the first order. For instance, obese individuals have an increased risk for kidney cancer. However, direct mechanisms linking obesity with kidney cancer remain elusive. We hypothesized that diet-induced obesity (DIO) promotes renal carcinogenesis by inducing an inflammatory and tumor-promoting microenvironment. We compared chow-fed lean Wistar rats with those that were sensitive (DIOsens) or partially resistant (DIOres) to DIO to investigate the impact of body adiposity versus dietary nutrient overload in the development of renal preneoplasia and activation of tumor-promoting signaling pathways. Our data clearly show a correlation between body adiposity, the severity of nephropathy, and the total number and incidence of preneoplastic renal lesions. However, similar plasma triglyceride, plasma free fatty acid and renal triglyceride levels were found in chow-fed, DIOres and DIOsens rats, suggesting that lipotoxicity is not a critical contributor to the renal pathology. Obesity-related nephropathy was further associated with regenerative cell proliferation, monocyte infiltration and higher renal expression of monocyte chemotactic protein-1 (MCP-1), interleukin (IL)-6, IL-6 receptor and leptin receptor. Accordingly, we observed increased signal transducer and activator of transcription 3 (STAT3) and mammalian target of rapamycin (mTOR) phosphorylation in tubules with preneoplastic phenotypes. In summary, our results demonstrate that high body adiposity induces an inflammatory and proliferative microenvironment in rat kidneys that promotes the development of preneoplastic lesions, potentially via activation of the STAT3 and mTOR signaling pathways.
INTRODUCTION
Over the last two decades, a worldwide rise in obesity has resulted in 1.46 billion overweight [body mass index (BMI)>25] and 502 million obese (BMI>30) adults (Finucane et al., 2011). Obesity is a public health problem of the first order for industrialized nations, potentially even leading to a decrease in overall life expectancy (Olshansky et al., 2005). Co-morbidities for obesity include diabetes mellitus type 2, cardiovascular disease, hepatic steatosis, Alzheimer’s disease, chronic kidney disease and certain cancers (Haslam and James, 2005; Brunt, 2010; Barnes and Yaffe, 2011). Notably, in their 2009 policy report entitled ‘Policy and Action for Cancer Prevention’, the World Cancer Research Fund/American Institute for Cancer Research (WCRF/AICR) states that 20% of all kidney cancer cases in males and 28% in females could be avoided by maintaining an appropriate body weight (http://www.dietandcancerreport.org/). Nevertheless, the mechanisms underlying obesity-associated kidney cancer remain largely unknown.
A major determinant for many obesity-induced sequelae is the low-grade inflammation of the enlarged adipose tissue, and the persistent release of inflammatory adipocytokines such as tumor necrosis factor-α (TNF) and interleukin-6 (IL-6) (Gregor and Hotamisligil, 2011), which can adversely affect various non-adipose target tissues. Such obesity-induced hepatic inflammation was recently shown to promote tumor formation in livers of dietary obese mice (Park et al., 2010). Indeed, the pro-tumorigenic role of inflammatory cytokines, such as TNF and IL-6, is well established (Yu et al., 2009; Grivennikov et al., 2010; Grivennikov and Karin, 2011; Kuraishy et al., 2011). Similarly, the majority of renal cell carcinomas have been shown to express IL-6, and the presence of IL-6 receptor was strongly associated with the tumor stage in kidney cancer patients (Costes et al., 1997). Thus, inhibition of the IL-6 target signal transducer and activator of transcription 3 (STAT3) is currently under investigation as a potential target for kidney cancer therapy (Xin et al., 2009; Horiguchi et al., 2010).
We hypothesized that diet-induced obesity (DIO) promotes the earliest stages of renal carcinogenesis via STAT3 activation. Using chow-fed lean rats and two groups of high-fat diet (HFD)-fed rats with either pronounced sensitivity to develop DIO (DIOsens rats) or partial resistance to DIO (DIOres rats), we demonstrated a correlation between body adiposity and the severity of kidney pathology: DIOsens and DIOres rats (collectively referred to as DIO rats) had increased renal inflammation and cytokine expression, and higher incidences of nephropathies and preneoplastic lesions. Notably, in tubules that had a preneoplastic phenotype, we observed increased activation of STAT3 and mTOR signaling, two key pathways that are involved in cell growth and survival by integrating nutrient, hormonal and inflammatory signals (Dann et al., 2007; Lee and Hung, 2007; Kuraishy et al., 2011); these pathways could link DIO to renal carcinogenesis.
RESULTS
Differing propensity towards HFD-induced body weight gain
We first established a model of different susceptibility to HFD-induced weight gain. Outbred Wistar rats with no previous inbreeding and thus no genetic pre-selection for body weight phenotypes were chronically exposed to either chow or a HFD for a total of 11 months. Two phenotypes were selected from the HFD-fed rats: high susceptibility to DIO (DIOsens) and partial resistance to DIO (DIOres). These rats had a 122.95% and 38.78% increase in body weight compared with chow-fed rats, respectively (Fig. 1A,B). DIOsens rats also demonstrated significantly higher visceral (epididymal and retroperitoneal) and subcutaneous (inguinal) fat pad weights in comparison with DIOres and chow-fed rats, the latter being the group with the lowest fat mass (Fig. 1).
Fig. 1.
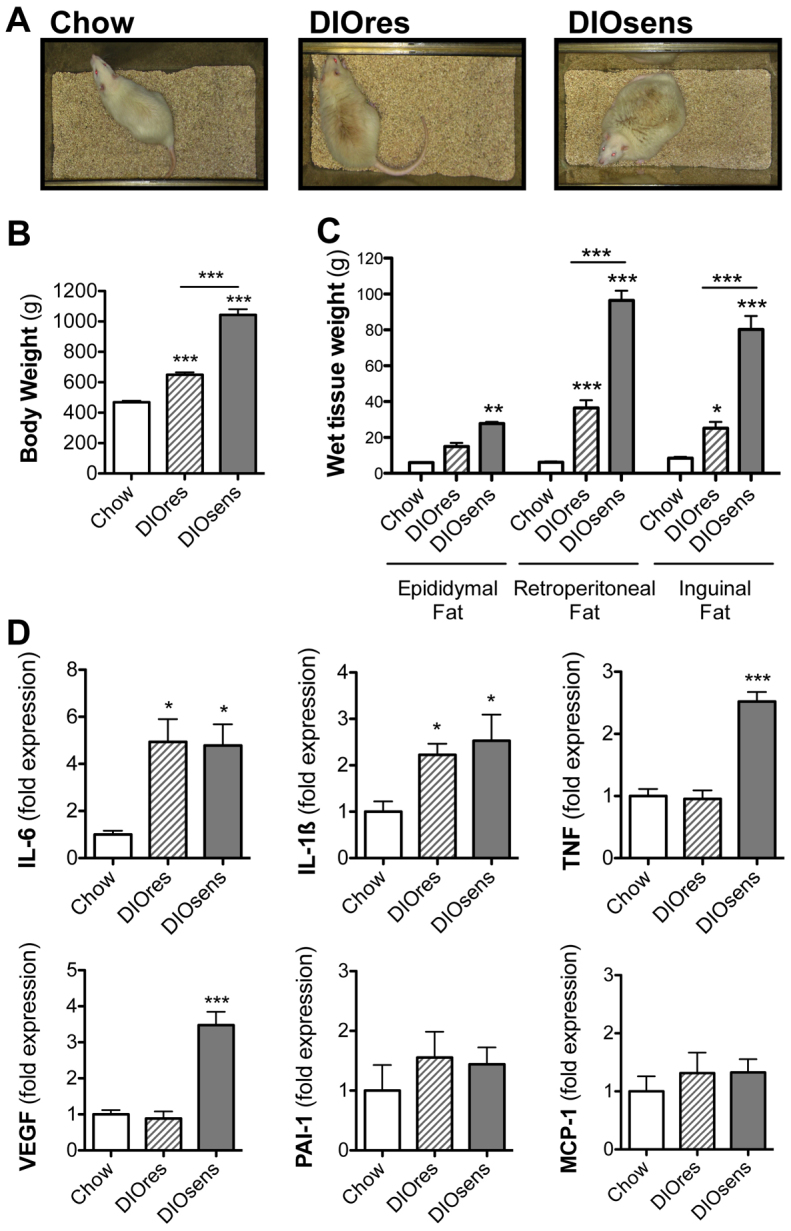
Differing propensity towards HFD-induced body weight gain. (A) Phenotypic appearance of chow-fed Wistar rats compared with HFD-fed and partially DIO resistant (DIOres) or DIO sensitive (DIOsens) rats (Perez-Tilve et al., 2010). (B,C) Body weights (B) and epididymal, retroperitoneal and inguinal fat pad weights (C) after 11 months of exposure to chow or HFD (DIOres, DIOsens). (D) Changes in adipocytokine expression in retroperitoneal fat from chow-fed, DIOres and DIOsens rats after 11 months of diet exposure. Values are given as mean ± s.e.m. Significant differences were analyzed by one-way ANOVA and Bonferroni multiple comparison post tests and indicated as *P<0.05, **P<0.01 and ***P<0.001 vs chow-fed controls.
Daily calorie intake was similar for chow-fed (80.4±3.0 kcal) and DIOres (73.9±5.7 kcal) rats, but was significantly higher in DIOsens rats (97.6±6.4 kcal, P<0.05) (Perez-Tilve et al., 2010). We further assessed adipocytokine expression in retroperitoneal fat. Both DIOres and DIOsens rats showed an increased expression of inflammatory cytokines IL-6 and IL-1β compared with controls (Fig. 1D). By contrast, expression of TNF and vascular endothelial growth factor (VEGF) were only increased in DIOsens retroperitoneal fat (Fig. 1D). No significant differences were observed for monocyte chemotactic protein-1 (MCP-1) or plasminogen activator inhibitor 1 (PAI-1).
Despite the bimodal distribution of body weight and fat mass in HFD-fed compared with chow-fed rats, ad libitum fed blood glucose levels were similar in all groups (Table 1). Fasted glucose levels as well as insulin levels were significantly increased in DIOsens rats, suggesting acquired early-stage glucose intolerance. Nevertheless, fasted glucose levels were still in a normoglycemic range, defined as a blood glucose concentration below 100 mg/dl in humans (Table 1), and compared with the massive hyperglycemia observed in diabetic Zucker (fa/fa) rats (Coimbra et al., 2000). Circulating leptin and PAI-1 levels were significantly increased in DIOsens rats, compared with chow controls (Table 1). A similar trend was observed for circulating IL-1β but not for circulating MCP-1 levels (Table 1). We were unable to detect circulating levels of TNF or IL-6 with the multiplex immunoassay used for our studies.
Table 1.
Blood chemistry and hormone profiles in chow-fed, DIOres and DIOsens rats

Increased severity of renal pathology in DIO rats
We next examined the impact of high body adiposity on the development of renal pathology. Only marginal histopathological changes were observed in chow-fed rats (Fig. 2A, Table 2). By contrast, chronic HFD exposure induced pronounced nephropathies in the corticomedullary region of DIOsens and DIOres rats (Fig. 2, Table 2), with significant correlation with both increased body weight (P<0.001, R=0.80; Fig. 2) and combined fat pad weights (P<0.001, R=0.78; data not shown). Nephropathies in DIO rats were characterized by glomerular damage, including dilatation of glomerular blood vessels, exfoliation and shedding of proximal tubular cells into the tubular lumen, proteinaceous cast formation, thickened basement membrane, and interstitial inflammation as evidenced by abundant interstitial monocytes (Fig. 2, Table 2). Cellular damage was accompanied by ‘scarring’ of some glomeruli (focal glomerular sclerosis) and tubules (tubulointerstitial fibrosis), as well as by tubular regeneration (Fig. 2, Table 2). Under normal conditions, tubular regeneration serves to restore the loss of damaged cells by a transient increase of cell proliferation but without exceeding the normal single cell layer of a tubule. However, in DIO rats, and especially in DIOsens rats, kidneys demonstrated massive and sustained regenerative renal cell proliferation, resulting in simple tubular hyperplasia, indicated by a broad increase of cell number and multilayered tubules (Fig. 2, Table 2). Sustained cell proliferation was further visualized by immunohistochemical staining of nuclear proliferating cell nuclear antigen (PCNA), confirming a marked increase of proliferating cells within areas presenting with the highest severity of pathological changes in DIOres and especially DIOsens rats, when compared with controls (Fig. 2,E).
Fig. 2.

Increased severity of renal pathology in DIO rats. (A) Representative H&E-stained paraffin section of a kidney from a chow-fed control animal without visible pathological changes. (B) Pronounced nephropathy in DIOsens rats was observed, including glomerulosclerosis (G), proteinaceous casts (P), infiltration of monocytes (M), slightly basophilic regenerating tubules with thickened basal membrane (white arrow) and simple tubular hyperplasia (grey arrow). (C) Spearman rank correlation of body weight with the severity of overall renal pathology. (D) PCNA labeling indices (LI) of chow-fed, DIOsens and DIOres rats. LI were determined for proximal tubules within randomly chosen fields of the outer or inner cortex. Within both regions at least 1000 positive and negative nuclei were counted. LI were tested for significance using one-way ANOVA and Bonferroni’s post tests for multiple comparisons. **P<0.01. (E) Representative image of a PCNA-stained kidney section from a DIOsens rat. Nuclear PCNA staining represents cells after G1-S transition. (F) Absence of renal triglyceride accumulation in kidneys of DIO rats.
Table 2.
Non-neoplastic renal pathology in chow-fed, DIOres and DIOsens rats

Lack of lipotoxicity in kidneys of DIO rats
Earlier reports have associated renal lipid accumulation with the pathogenesis of chronic kidney disease in animal models of DIO (Jiang et al., 2005; Kume et al., 2007; Hao et al., 2012) and diabetes (Wang et al., 2005; Bobulescu et al., 2009). We therefore evaluated a potential contribution of circulating free fatty acids (FFAs) and renal triglyceride accumulation to the observed renal pathology in DIO rats. However, fasting plasma triglyceride and FFA levels (Table 1) as well as kidney triglyceride content were similar in chow-fed lean controls and DIO rats (Fig. 2F). The lack of renal lipid accumulation was further corroborated by the absence of Oil-Red-O-positive lipid droplets in kidneys of chow-fed and DIO rats (data not shown). To estimate fatty acid flux into renal cells, we further examined the expression of fatty acid transport proteins (FATPs), a group of proteins that coordinate long-chain FFA uptake and metabolism (supplementary material Fig. S1). The predominant FATP expressed was FATP2, followed by FATP1 and FATP4; FATP3 expression was lowest. FATP5 and FATP6 could not be detected in rat kidney (data not shown). When comparing FATP levels of chow-fed, DIOres and DIOsens rats, no changes in expression levels could be observed for FATP1, 3 or 4 (supplementary material Fig. S1). Notably, FATP2 expression was decreased in the kidneys of DIOsens rats, compared with chow-fed controls (P<0.001).
Increased renal inflammation and STAT3 signaling in DIO rats
On the basis of the histological evidence of renal tissue inflammation in DIO rats (Fig. 2B, Table 2) and the known role of constitutive STAT3 activation in tumor promotion (Kuraishy et al., 2011), we first examined the expression of known STAT3-activating cytokines in the kidneys of lean and DIO rats. Expression of IL-6 was significantly increased in DIOsens rats compared with chow-fed lean controls and DIOres rats (Fig. 3A). Moreover, IL-6 receptor as well as IL-1β and TNF were slightly, but not significantly, increased in DIOres rats and markedly increased in DIOsens rats, compared with chow-fed controls (Fig. 3A–D). Similar to the increase in circulating leptin in both DIOres and DIOsens rats (Table 1), leptin receptor expression was increased in the kidneys of both DIOres and DIOsens rats (Fig. 3E).
Fig. 3.

Increased renal inflammation and STAT3 signaling in DIO rats. (A-H) Relative gene expression levels normalized to the geometric average of the respective housekeeping gene hypoxanthine guanine phosphoribosyl transferase 1 (HPRT1). (A) Interleukin 6 (IL-6), (B) interleukin 1β (IL-1β), (C) tumor necrosis factor-α (TNF), (D) interleukin 6 receptor (IL6-R), (E) leptin receptor (Lep-R), (F) suppressor of cytokine signaling 3 (SOCS3), (G) monocyte chemotactic protein-1 (MCP-1), (H) plasminogen activator inhibitor-1 (PAI-1). (I) Representative western blot (n=3–4) and densitometric analysis (n=7–8) of phosphorylated STAT3 (p-STAT3) and total STAT (t-STAT3). The ratio of p-STAT3 to t-STAT3 from DIOres and DIOsens rats was normalized to the ratio derived from chow-fed controls (defined as onefold change). All values are given as means ± s.e.m. Significant differences were analyzed by using one-way ANOVA and Bonferroni multiple comparison post tests and indicated as *P<0.05 and ***P<0.001 vs chow controls.
We next analyzed the expression of downstream transcriptional targets of STAT3 signaling to evaluate STAT3 activation. Expression levels of SOCS3 (Fig. 3F), MCP1/CCL2 (Fig. 3G) and PAI-1 (Fig. 3H) tended to be increased in DIOres rats, and were significantly increased in DIOsens rats compared with chow-fed controls. In order to directly assess the activity of STAT3, we performed western blots from the renal cortex/outer medulla section for total STAT3 (t-STAT3) and activated phospho-STAT3Tyr705 (p-STAT3). In chow-fed rats, STAT3 phosphorylation was almost absent. By contrast, STAT3 phosphorylation was increased in DIOres and highest in DIOsens rats (Fig. 3I, left panel). Accordingly, ratios of p-STAT3 to t-STAT3 increased with the degree of body adiposity (DIOres: 13.7±5.5-fold, DIOsens: 25.7±11.0-fold, compared with 1.0±0.3-fold in chow-fed controls; Fig. 3I, right panel).
p-STAT3- and p-mTOR-positive renal preneoplasia in DIO rats
To elucidate whether the increase in STAT3 signaling correlates with renal pathology, we applied immunohistochemistry to localize the areas of activated STAT3 signaling. Only sporadic p-STAT3-positive nuclei were observed in chow-fed rats or ‘healthy’ renal tissues of DIO rats (data not shown). Accumulations of p-STAT3-positive nuclei occurred predominantly in tubules that had an atypical phenotype, i.e. in single atypical tubules (Fig. 4A) and early atypical hyperplasia (Fig. 4C). These preneoplastic lesions are characterized by pleomorphic nuclei with irregular shape, size or cellular location and increased stratification of cells (Dietrich and Swenberg, 1991; Hard et al., 1995). Hematoxylin and eosin (H&E) staining of these lesions further revealed a basophilic staining of the tubular cytoplasm (Fig. 4B) and increased numbers of monocytes within the interstitium surrounding the lesions (Fig. 4B,D).
Fig. 4.

p-STAT3- and p-mTOR-positive renal preneoplasia in DIO rats. (A,B) Preneoplastic tubules in DIO rats. (A) Nuclear phospho-STAT3 (p-STAT3) staining and (B) H&E of a preneoplastic tubule, indicated by pleomorphic cells and nuclei and their proliferation beyond a single cell layer (black arrow). (C,D) Atypical hyperplasia in DIO rats with p-STAT3-positive nuclei, including some p-STAT3-positive giant nuclei (C) or basophilic cytoplasm of an H&E-stained section, indicating a high replicative activity of the lesion (D). (E) Total number and incidences of atypical tubules (AT) and atypical hyperplasia (AH) in chow-fed controls, DIOres rats and DIOsens rats. Significant differences were analyzed using one-way ANOVA and Bonferroni multiple comparison post tests and indicated as *P<0.05, **P<0.01 and ***P<0.001 vs chow controls. (F) Simple hyperplasia with positive cytoplasmic p-mTOR staining.
We found that preneoplastic lesions were almost absent in chow-fed rats. By contrast, DIOsens rats had a significantly higher number and incidence of atypical tubules (Fig. 4E). Notably, however, the difference between the numbers of preneoplastic lesions in DIOres and DIOsens kidneys was not statistically significant.
We next examined the activity of mTOR signaling in rat kidneys via immunohistochemistry using antibodies directed against mTOR phosphorylated at serine 2448 (Ser2448), or against its downstream target, S6 ribosomal protein (S6RP) phosphorylated at Ser235/236 (supplementary material Fig. S1). Tubules with p-mTOR- and p-S6RP-positive cytoplasm were primarily found in areas with increased cell proliferation (Fig. 4F, supplementary material Fig. S2).
DISCUSSION
DIO has been recognized as an important risk factor for the development of kidney cancer (Calle et al., 2003; Renehan et al., 2008) [WCRF/AICR 2009 policy report (http://www.dietandcancerreport.org/)]. However, causal mechanisms still remain elusive. Accordingly, identification of the hitherto unknown link between obesity and cancer has emerged as a topic of major interest. Surprisingly, only a few predominantly short-term studies have used rat models of DIO to investigate adverse effects on renal physiology (Aguila and Mandarim-De-Lacerda, 2003; Altunkaynak et al., 2008; Elmarakby and Imig, 2010; Hao et al., 2012) and none of these focused on renal carcinogenesis. Furthermore, none of these studies aimed to delineate adverse direct effects of dietary fatty acids from indirect adverse effects caused by the increased body adiposity.
As a model system, we used a common outbred Wistar rat strain. Wistar rats, in contrast to inbred laboratory animals, have similar but not identical genetic backgrounds, and are susceptible to exogenous stimuli (such as a high-calorie diet). Accordingly, and highly similar to human populations, our rats showed a broad variation in body weight gain after 11 months of HFD exposure. The morbidly obese phenotype of DIOsens rats could be explained by increased calorie consumption. In addition, differential diet-induced thermogenesis in DIOres and DIOsens rats could have further contributed to the varying weight gain (Rothwell et al., 1982). Overall, such differences in the propensity for DIO could be due to both epigenetic variations and genetic predispositions, especially because our rats were derived from closed colonies of genetically variable composition. This strategy differs from that of Levine et al., in which DIOres and DIOsens rats were derived from consecutive backcrossing of rats with differing dispositions to body weight gain (Levin et al., 1997). Although such backcrossing would have resulted in a more severe phenotype of complete resistance vs very high susceptibility to DIO, it could have also selected for possible predisposition or resistance towards renal pathology, which we wanted to avoid in our study.
By comparing lean rats on chow diet with groups of HFD-fed DIOres and DIOsens rats, we could demonstrate that HFD-induced obesity results in obesity-related nephropathy despite the lack of frank hyperglycemia. The severity of these obesity-related pathological alterations, such as glomerular and tubular degeneration, glomerulosclerosis, interstitial fibrosis, and massive regenerative cell proliferation, was increased in DIOres rats compared with controls, and was most pronounced in DIOsens rats (Fig. 2A-C, Table 2). Accordingly, we found a clear correlation between the severity of the pathology, body weight and body adiposity. However, when comparing the severities of pathological alterations of DIOres and DIOsens rats, we did not detect any significant differences. We therefore conclude that both increased body fat and dietary fat overload contribute to the etiology of obesity-induced non-neoplastic renal pathologies.
HFD feeding can result in elevated plasma levels of FFAs, which, if not efficiently stored in adipose tissue in the form of triglycerides, can be harmful to non-adipose tissues (Unger et al., 2010). For instance, a recent study has demonstrated an altered balance between renal lipogenesis and lipolysis in mice after 16 weeks of HFD exposure, with subsequent accumulation of lipids in the kidney, glomerulosclerosis and interstitial fibrosis (Kume et al., 2007). Interestingly, DIO rats developed renal pathological changes but the levels of plasma triglycerides, plasma FFA (Table 1) and renal triglycerides (Fig. 2F) were unchanged compared with chow-fed controls. Furthermore, similar expression levels of FATP1, 3 and 4 in chow-fed and DIO rats did not suggest increased FFA flux into renal cells (supplementary material Fig. S1). In fact, decreased expression of FATP2 in DIOsens rats might even protect from excessive fatty acid influx into the kidney (supplementary material Fig. S2). Altogether, our data suggest that alternative factors other than lipotoxicity contribute to the etiology of DIO-mediated renal pathology.
Hypertension as part of the metabolic syndrome has been frequently related to end-stage renal disease. However, to date it is still unknown whether hypertension is a cause or consequence of renal injury (Tedla et al., 2011). Although dietary fat and hypertension might directly or indirectly contribute to renal damage, our data clearly point to a predominant role of body adiposity in the development of renal pathologies in DIO rats. Indeed, the elevated expression of proinflammatory adipocytokines such as IL-6, IL-1β and TNF in the adipose tissue (Fig. 1D) correlates with the renal inflammation in DIO rats, as revealed by monocyte infiltration and significantly increased expression levels of the inflammatory cytokines IL-6, IL-1β, TNF and PAI-1, as well as of the chemokine MCP-1 (Fig. 3A–H). Notably, we also found increased expression levels of IL-6 receptor (Fig. 3D) and leptin-receptor (Fig. 3E). The latter could further confirm a crosstalk between adipose tissue and kidneys. In addition, the potential condition of non-alcoholic steatohepatitis (NASH) in our DIO rat model, and NASH-mediated hepatic secretion of (sub-threshold) IL-6 levels or other inflammatory cytokines, could have further contributed to a chronic inflammatory state and the development of preneoplastic lesions. Nevertheless, although we found increased expression of IL-6 in the kidneys and adipose tissue, we could not detect circulating IL-6 in our rats.
Leptin (Baumann et al., 1996; Vaisse et al., 1996; Villanueva and Myers, 2008) as well as various cytokines such as IL-6, TNF and IL-1β (Yu et al., 2009; Grivennikov and Karin, 2011) have been suggested as potent activators of STAT3 signaling in multiple target organs. Upon activation of STAT3 by extracellular signals, STAT3 is phosphorylated at Tyr705 by JAK kinases. Phosphorylated STAT3 dimerizes and translocates to the nucleus, where it orchestrates a multitude of signaling processes such as those driving inflammation, cell survival, proliferation or cell transformation (Yu et al., 2009; Grivennikov and Karin, 2011). In consequence, STAT3 signaling has been associated with many types of cancer (Al Zaid Siddiquee and Turkson, 2008), including renal neoplasia (Horiguchi et al., 2002; Guo et al., 2009). Although neither DIOsens nor DIOres rats presented with renal adenomas or carcinomas, we observed an increase in the incidence of single atypical tubules and atypical hyperplasia, i.e. early stages of renal carcinogenesis. Such preneoplasia, although still reversible, have the potential to develop to benign or malignant tumors (Dietrich and Swenberg, 1991; Hard et al., 1995). Moreover, preneoplastic lesions differed from ‘healthy’ tissue by agglomeration of p-STAT3-positive nuclei (Fig. 4A–D), suggesting a persistent activation of the STAT3 signaling pathway in these lesions. It remains elusive whether persistent STAT3 activation is causally related to the increased cell proliferation within these preneoplastic tubules. Nevertheless, inflammation is now recognized as an important hallmark of cancer development (Hanahan and Weinberg, 2011). For instance, IL-6–STAT3 signaling has been shown to link obesity, inflammation and liver cancer (Park et al., 2010).
Moreover, the observed upregulation of leptin receptor in kidneys of DIO rats could have contributed to the development of renal preneoplastic lesions in these rats. Leptin and increased leptin receptor expression have been associated with various types of cancer, including breast cancer (Jeong et al., 2011), colon cancer (Stachowicz et al., 2010) and kidney cancer (Horiguchi et al., 2006). Leptin has also been linked with mTOR activation (Maya-Monteiro and Bozza, 2008), an important pathway that links nutrient signaling to cell growth, proliferation and cancer (Dann et al., 2007). Our data demonstrated mTOR phosphorylation as well as downstream ribosomal protein S6 phosphorylation in areas of increased renal epithelial cell proliferation, including preneoplastic lesions (Fig. 4F, supplementary material Fig. S2). Such increased cell proliferation (independent from its initial stimuli) is known to further propagate the fixation of spontaneous mutations and progression of preneoplastic lesions into solid tumors (Cohen and Ellwein, 1991; Dietrich and Swenberg, 1991).
In conclusion, our data suggest that prolonged HFD exposure induces a plethora of potential STAT3-activating signals in DIO rat kidneys, whereby severe obesity exacerbates the onset and progression of nephropathy and preneoplasia. Future studies should aim to further assess the causal role of locally produced cytokines or even adipocyte-derived hormones, including leptin, in the kidney’s inflammatory microenvironment that is associated with the development of renal preneoplasia.
METHODS
Animals
Male Wistar rats (Harlan, IN; n=32, 250–350 g, age 2 months) were allowed ad libitum access to a HFD (40% calories from butter fat, 46% from corn starch; Research Diets, NJ). After 11 months of HFD exposure, groups of rats at each extreme – based on their body weight (BW) – were selected and defined as DIO sensitive (DIOsens; BW range: 947–1247 g, n=7) and partially DIO resistant (DIOres; BW range: 587–707 g, n=8) (Perez-Tilve et al., 2010). Both sub-populations were compared with rats (BW range: 427–508 g, n=8) exposed to standard chow diet (LM-485; 17% calories from fat, 58% from carbohydrates; Teklad Harlan, IN). All rats were single-housed, and daily calorie consumption was assessed for 5 days before terminating the experiment. Rats were sacrificed by decapitation, and trunk blood was collected. Inguinal, retroperitoneal and epididymal fat depots were excised, weighed and frozen on dry ice. Kidneys were excised, cross-sectioned and either frozen on dry ice or fixed in 10% buffered formalin before paraffin embedding. All animal studies were approved by the Institutional Animal Care and Use Committees at the University of Cincinnati Office, in accordance with the NIH guide for the care and use of laboratory animals.
Blood parameters
At 2 weeks prior to sacrifice, we collected plasma from tail blood of overnight fasted rats. Circulating non-esterified fatty acid, triglyceride and cholesterol levels were determined by enzymatic assays (NEFA, Wako, Germany; Infinity triglyceride and Infinity cholesterol, Thermo Electron, FL). Circulating insulin and adipokine levels were measured by using multiplex panels from LINCOplex (St Charles, MO). All measurements were performed in duplicate according to the manufacturers’ instructions. Detection limits for adipocytokines were: leptin 9.7 pg/ml, IL-1β 1.2 pg/ml, IL-6 8.8 pg/ml, TNF, 3.2 pg/ml, MCP-1 25.8 pg/ml, PAI-1 (active) 31.6 pg/ml, PAI-1 (total) 30.7 pg/ml and insulin 52.5 pg/ml. Fed and fasted blood glucose levels were measured directly from tail blood by using glucometers (TheraSense Freestyle).
Renal pathology
H&E-stained paraffin sections were randomized for blinded histopathological evaluation, and non-neoplastic pathology was ranked as absent (0), mild (1), moderate (2), pronounced (3) or severe (4). Preneoplastic lesions were characterized as atypical tubules (characterized by tubules of normal size but altered cell types including multilayered cells with irregular nuclei and/or cytoplasm and frequent mitotic figures) and atypical hyperplasia (characterized by the accumulation of atypical tubules, but without compression or infiltration of surrounding tissue) (Dietrich and Swenberg, 1991). Total numbers of preneoplastic lesions were counted and incidences per animal determined.
Renal triglyceride quantification
Kidney triglycerides were extracted from 50 mg frozen corticomedullary kidney sections using a chloroform/methanol (2:1) extraction procedure adapted from previous studies (Frayn and Maycock, 1980; Nogueiras et al., 2007). After evaporation of the organic solvent, triglyceride contents were determined by an enzymatic method (Infinity Triglycerides Reagent, Thermo Fisher Scientific, VA), according to the manufacturer’s instructions. Rat kidneys were further evaluated for lipid droplet accumulation using Oil Red O staining. Cryosections were cut and stained by the Pathology Research Core facility of the Cincinnati Children’s Hospital Medical Center (Cincinnati, OH).
Real-time PCR
RNA was isolated from retroperitoneal fat and kidneys using RNeasy Lipid Tissue mini kits, and RNeasy mini kits, respectively (Qiagen, CA). RNA was transcribed into cDNA by using Superscript III reverse transcriptase, according to the manufacturer’s instructions (Invitrogen, CA). Quantitative real-time PCR (Q-PCR) reactions were performed in an ABI Prism 7900HT Sequence Detection System by using specific TaqMan probe sets listed in supplementary material Table S1. Q-PCR reactions for the detection of fatty acid transport proteins were performed in a MyiQ Real-Time PCR detection system (Bio-Rad, CA), using iQ SYBR Green Supermix (Bio-Rad) and specific primer pairs listed in supplementary material Table S2. Relative expression levels were normalized to the housekeeping gene hypoxanthine guanine phosphoribosyl transferase 1 (HPRT1); expression changes were evaluated using the delta-delta Ct (ΔΔCt) method.
Western blotting
Total protein was extracted from the cortico/medullary region of the kidneys, and phospho-STAT3Tyr705 (p-STAT3; Cell Signaling Technology, MA, #9131) and total STAT3 (Cell Signaling Technology, #9132) were detected via western blot analysis. Detections were carried out using horseradish-peroxidase-linked secondary antibody (Cell Signaling Technology, #7074) followed by enhanced chemiluminescence detection (Perkin Elmer, MA, #NEL105001EA). Densitometric analysis (using ImageJ software, http://rsb.info.nih.gov/ij) was applied to compare normalized ratios of p-STAT3 vs t-STAT3, with the ratio of chow-fed controls being defined as 1.
Immunohistochemistry
p-STAT3Tyr705 and p-mTORSer2448 staining on renal paraffin sections was done using primary antibodies for p-STAT3 (Cell Signaling Technology, #9145) and p-mTOR (Cell Signaling Technology, #2976), according to the manufacturer’s protocols. Antigen-antibody complexes were visualized using the Super Sensitive One Step Polymer HRP detection system (Biogenex, CA) with DAB as a chromogen. Immunohistochemical staining of phospho-S6 ribosomal proteinSer235/236 (p-RPS6) and proliferating nuclear antigen (PCNA) was done as previously described (Stemmer et al., 2007; Stemmer et al., 2009). All the sections were counterstained with Meyer’s hematoxylin for 3 minutes.
Cell proliferation analysis
PCNA-positive S-phase nuclei, indicating cell proliferation, were quantified on randomized paraffin sections. A total of 20 microscopic fields (10× ocular, 40× objective) were randomly chosen within the renal corticomedullary area. At least 1000 proximal tubules were counted per section, distinguishing between positive PCNA-stained and negative (hematoxylin-counterstained) nuclei. Nuclear labeling indices (LI) were calculated as positive nuclei/total number of nuclei counted.
TRANSLATIONAL IMPACT.
Clinical issue
The ongoing global obesity epidemic poses an urgent health threat owing to a concomitant rise in comorbidities such as kidney cancer. In their 2009 policy report, the World Cancer Research Fund/American Institute for Cancer Research (WCRF/AICR) attributed 24% of all kidney cancer cases to obesity. Although the exact mechanisms underlying this increased risk remain elusive, current research suggests that obesity-associated increases in the levels of inflammatory (adipo)cytokines and direct lipotoxic effects from dietary fatty acids are potential culprits. Both of these factors might induce obesity-related nephropathy and an inflammatory and procarcinogenic kidney microenvironment that could promote the manifestation of preneoplasia, i.e. early-stage kidney cancer.
Results
By comparing lean, chow-fed rats with groups of non-diabetic, high-fat-diet (HFD)-fed rats that were either sensitive or partially resistant to diet-induced obesity (DIO), the authors demonstrate a clear correlation between high body adiposity and the severity of renal pathology. Animals prone to DIO also showed the highest incidence of preneoplasia, i.e. early-stage kidney cancer. The similar levels of plasma triglyceride, plasma free fatty acid and renal triglyceride found in both chow-fed and HFD-fed rats suggest that lipotoxicity is not a crucial contributor to the renal pathology. By contrast, the authors show that the kidneys of DIO rats exhibit an inflammatory and procarcinogenic microenvironment, characterized by monocyte infiltration, cytokine expression, elevated circulating leptin levels and increased kidney leptin receptor expression. Increased phosphorylation of STAT3 and mammalian target of rapamycin (mTOR) primarily in tubules with preneoplastic phenotypes suggests a major role for these tumor-promoting pathways in obesity-induced kidney carcinogenesis.
Implications and future directions
This detailed morphological analysis of obesity-induced renal pathology in outbred Wistar rats with differing propensities for DIO revealed a close similarity to renal disease in obese humans. Importantly, renal cell carcinomas in rats have been demonstrated to closely resemble renal cancer in humans. Thus, Wistar rats are a valuable animal model with which to unravel the causal link between obesity and kidney cancer. Future research should aim to delineate the individual roles of renal cytokines and STAT3 and/or mTOR activation in the etiology of obesity-induced kidney cancer, and their potential role as drug targets.
Statistics
Significant differences between chow-fed, DIOres and DIOsens animals were evaluated by one-way ANOVA and post-hoc Bonferroni multiple comparison tests. Ranked non-neoplastic pathology data were analyzed by Kruskal-Wallis tests. All analyses were performed by using GraphPad Prism 5.0 (GraphPad, CA). Results were considered statistically significant when P<0.05, with significance levels indicated as *P<0.05, **P<0.01 and ***P<0.001.
Supplementary Material
Footnotes
COMPETING INTERESTS
The authors declare that they do not have any competing or financial interests.
AUTHOR CONTRIBUTIONS
G.A. and A.B. performed experiments and analyzed data, K.S., D.P.-T., D.R.D. and P.T.P. conceived, designed and performed experiments and wrote the paper, R.J.S. and M.H.T. helped with the discussion.
FUNDING
This work was supported by the German Research Foundation [DFG Ste1466/4-1].
SUPPLEMENTARY MATERIAL
Supplementary material for this article is available at http://dmm.biologists.org/lookup/suppl/doi:10.1242/dmm.009407/-/DC1
REFERENCES
- Aguila M. B., Mandarim-De-Lacerda C. A. (2003). Effects of chronic high fat diets on renal function and cortical structure in rats. Exp. Toxicol. Pathol. 55, 187–195 [DOI] [PubMed] [Google Scholar]
- Al Zaid Siddiquee K., Turkson J. (2008). STAT3 as a target for inducing apoptosis in solid and hematological tumors. Cell Res. 18, 254–267 [DOI] [PMC free article] [PubMed] [Google Scholar]
- Altunkaynak M. E., Ozbek E., Altunkaynak B. Z., Can I., Unal D., Unal B. (2008). The effects of high-fat diet on the renal structure and morphometric parametric of kidneys in rats. J. Anat. 212, 845–852 [DOI] [PMC free article] [PubMed] [Google Scholar]
- Barnes D. E., Yaffe K. (2011). The projected effect of risk factor reduction on Alzheimer’s disease prevalence. Lancet Neurol. 10, 819–828 [DOI] [PMC free article] [PubMed] [Google Scholar]
- Baumann H., Morella K. K., White D. W., Dembski M., Bailon P. S., Kim H., Lai C. F., Tartaglia L. A. (1996). The full-length leptin receptor has signaling capabilities of interleukin 6-type cytokine receptors. Proc. Natl. Acad. Sci. USA 93, 8374–8378 [DOI] [PMC free article] [PubMed] [Google Scholar]
- Bobulescu I. A., Dubree M., Zhang J., McLeroy P., Moe O. W. (2009). Reduction of renal triglyceride accumulation: effects on proximal tubule Na+/H+ exchange and urinary acidification. Am. J. Physiol.-Renal. 297, F1419–F1426 [DOI] [PMC free article] [PubMed] [Google Scholar]
- Brunt E. M. (2010). Pathology of nonalcoholic fatty liver disease. Nat. Rev. Gastroenterol. Hepatol. 7, 195–203 [DOI] [PubMed] [Google Scholar]
- Calle E. E., Rodriguez C., Walker-Thurmond K., Thun M. J. (2003). Overweight, obesity, and mortality from cancer in a prospectively studied cohort of U.S. adults. N. Engl. J. Med. 348, 1625–1638 [DOI] [PubMed] [Google Scholar]
- Cohen S. M., Ellwein L. B. (1991). Genetic errors, cell proliferation, and carcinogenesis. Cancer Res. 51, 6493–6505 [PubMed] [Google Scholar]
- Coimbra T. M., Janssen U., Grone H. J., Ostendorf T., Kunter U., Schmidt H., Brabant G., Floege J. (2000). Early events leading to renal injury in obese Zucker (fatty) rats with type II diabetes. Kidney Int. 57, 167–182 [DOI] [PubMed] [Google Scholar]
- Costes V., Liautard J., Picot M. C., Robert M., Lequeux N., Brochier J., Baldet P., Rossi J. F. (1997). Expression of the interleukin 6 receptor in primary renal cell carcinoma. J. Clin. Pathol. 50, 835–840 [DOI] [PMC free article] [PubMed] [Google Scholar]
- Dann S. G., Selvaraj A., Thomas G. (2007). mTOR Complex1-S6K1 signaling: at the crossroads of obesity, diabetes and cancer. Trends Mol. Med. 13, 252–259 [DOI] [PubMed] [Google Scholar]
- Dietrich D. R., Swenberg J. A. (1991). Preneoplastic lesions in rodent kidney induced spontaneously or by non-genotoxic agents: predictive nature and comparison to lesions induced by genotoxic carcinogens. Mutat. Res. 248, 239–260 [DOI] [PubMed] [Google Scholar]
- Elmarakby A. A., Imig J. D. (2010). Obesity is the major contributor to vascular dysfunction and inflammation in high-fat diet hypertensive rats. Clin. Sci. 118, 291–301 [DOI] [PMC free article] [PubMed] [Google Scholar]
- Finucane M. M., Stevens G. A., Cowan M. J., Danaei G., Lin J. K., Paciorek C. J., Singh G. M., Gutierrez H. R., Lu Y., Bahalim A. N., et al. (2011). National, regional, and global trends in body-mass index since 1980, systematic analysis of health examination surveys and epidemiological studies with 960 country-years and 9.1 million participants. Lancet 377, 557–567 [DOI] [PMC free article] [PubMed] [Google Scholar]
- Frayn K. N., Maycock P. F. (1980). Skeletal muscle triacylglycerol in the rat: methods for sampling and measurement, and studies of biological variability. J. Lipid Res. 21, 139–144 [PubMed] [Google Scholar]
- Gregor M. F., Hotamisligil G. S. (2011). Inflammatory mechanisms in obesity. Annu. Rev. Immunol. 29, 415–445 [DOI] [PubMed] [Google Scholar]
- Grivennikov S. I., Karin M. (2011). Inflammatory cytokines in cancer: tumour necrosis factor and interleukin 6 take the stage. Ann. Rheum. Dis. 70 Suppl. 1, i104–i108 [DOI] [PubMed] [Google Scholar]
- Grivennikov S. I., Greten F. R., Karin M. (2010). Immunity, inflammation, and cancer. Cell 140, 883–899 [DOI] [PMC free article] [PubMed] [Google Scholar]
- Guo C., Yang G., Khun K., Kong X., Levy D., Lee P., Melamed J. (2009). Activation of Stat3 in renal tumors. Am. J. Transl. Res. 1, 283–290 [PMC free article] [PubMed] [Google Scholar]
- Hanahan D., Weinberg R. A. (2011). Hallmarks of cancer: the next generation. Cell 144, 646–674 [DOI] [PubMed] [Google Scholar]
- Hao J., Liu S. X., Zhao S., Liu Q. J., Liu W., Duan H. J. (2012). High-fat diet causes increased serum insulin and glucose which synergistically lead to renal tubular lipid deposition and extracellular matrix accumulation. Br. J. Nutr. 107, 74–85 [DOI] [PubMed] [Google Scholar]
- Hard G. C., Alden C. L., Stula E. F., Trump B. F. (1995). Proliferative lesions of the kidney in the rat. In Guides for Toxicologic Pathology, pp. 1–19 Washington: STP/ARP/AFIP [Google Scholar]
- Haslam D. W., James W. P. (2005). Obesity. Lancet 366, 1197–1209 [DOI] [PubMed] [Google Scholar]
- Horiguchi A., Oya M., Shimada T., Uchida A., Marumo K., Murai M. (2002). Activation of signal transducer and activator of transcription 3 in renal cell carcinoma: a study of incidence and its association with pathological features and clinical outcome. J. Urol. 168, 762–765 [PubMed] [Google Scholar]
- Horiguchi A., Sumitomo M., Asakuma J., Asano T., Zheng R., Nanus D. M., Hayakawa M. (2006). Increased serum leptin levels and over expression of leptin receptors are associated with the invasion and progression of renal cell carcinoma. J. Urol. 176, 1631–1635 [DOI] [PubMed] [Google Scholar]
- Horiguchi A., Asano T., Kuroda K., Sato A., Asakuma J., Ito K., Hayakawa M., Sumitomo M. (2010). STAT3 inhibitor WP1066 as a novel therapeutic agent for renal cell carcinoma. Br. J. Cancer 102, 1592–1599 [DOI] [PMC free article] [PubMed] [Google Scholar]
- Jeong Y. J., Bong J. G., Park S. H., Choi J. H., Oh H. K. (2011). Expression of leptin, leptin receptor, adiponectin, and adiponectin receptor in ductal carcinoma in situ and invasive breast cancer. J. Breast Cancer 14, 96–103 [DOI] [PMC free article] [PubMed] [Google Scholar]
- Jiang T., Wang Z., Proctor G., Moskowitz S., Liebman S. E., Rogers T., Lucia M. S., Li J., Levi M. (2005). Diet-induced obesity in C57BL/6J mice causes increased renal lipid accumulation and glomerulosclerosis via a sterol regulatory element-binding protein-1c-dependent pathway. J. Biol. Chem. 280, 32317–32325 [DOI] [PubMed] [Google Scholar]
- Kume S., Uzu T., Araki S., Sugimoto T., Isshiki K., Chin-Kanasaki M., Sakaguchi M., Kubota N., Terauchi Y., Kadowaki T., et al. (2007). Role of altered renal lipid metabolism in the development of renal injury induced by a high-fat diet. J. Am. Soc. Nephrol. 18, 2715–2723 [DOI] [PubMed] [Google Scholar]
- Kuraishy A., Karin M., Grivennikov S. I. (2011). Tumor promotion via injury- and death-induced inflammation. Immunity 35, 467–477 [DOI] [PMC free article] [PubMed] [Google Scholar]
- Lee D. F., Hung M. C. (2007). All roads lead to mTOR: integrating inflammation and tumor angiogenesis. Cell Cycle 6, 3011–3014 [DOI] [PubMed] [Google Scholar]
- Levin B. E., Dunn-Meynell A. A., Balkan B., Keesey R. E. (1997). Selective breeding for diet-induced obesity and resistance in Sprague-Dawley rats. Am. J. Physiol. 273, R725–R730 [DOI] [PubMed] [Google Scholar]
- Maya-Monteiro C. M., Bozza P. T. (2008). Leptin and mTOR: partners in metabolism and inflammation. Cell Cycle 7, 1713–1717 [DOI] [PubMed] [Google Scholar]
- Nogueiras R., Wiedmer P., Perez-Tilve D., Veyrat-Durebex C., Keogh J. M., Sutton G. M., Pfluger P. T., Castaneda T. R., Neschen S., Hofmann S. M., et al. (2007). The central melanocortin system directly controls peripheral lipid metabolism. J. Clin. Invest. 117, 3475–3488 [DOI] [PMC free article] [PubMed] [Google Scholar]
- Olshansky S. J., Passaro D. J., Hershow R. C., Layden J., Carnes B. A., Brody J., Hayflick L., Butler R. N., Allison D. B., Ludwig D. S. (2005). A potential decline in life expectancy in the United States in the 21st century. N. Engl. J. Med. 352, 1138–1145 [DOI] [PubMed] [Google Scholar]
- Park E. J., Lee J. H., Yu G. Y., He G., Ali S. R., Holzer R. G., Osterreicher C. H., Takahashi H., Karin M. (2010). Dietary and genetic obesity promote liver inflammation and tumorigenesis by enhancing IL-6 and TNF expression. Cell 140, 197–208 [DOI] [PMC free article] [PubMed] [Google Scholar]
- Perez-Tilve D., Hofmann S. M., Basford J., Nogueiras R., Pfluger P. T., Patterson J. T., Grant E., Wilson-Perez H. E., Granholm N. A., Arnold M., et al. (2010). Melanocortin signaling in the CNS directly regulates circulating cholesterol. Nat. Neurosci. 13, 877–882 [DOI] [PMC free article] [PubMed] [Google Scholar]
- Renehan A. G., Tyson M., Egger M., Heller R. F., Zwahlen M. (2008). Body-mass index and incidence of cancer: a systematic review and meta-analysis of prospective observational studies. Lancet 371, 569–578 [DOI] [PubMed] [Google Scholar]
- Rothwell N. J., Saville M. E., Stock M. J. (1982). Effects of feeding a “cafeteria” diet on energy balance and diet-induced thermogenesis in four strains of rat. J. Nutr. 112, 1515–1524 [DOI] [PubMed] [Google Scholar]
- Stachowicz M., Mazurek U., Nowakowska-Zajdel E., Niedworok E., Fatyga E., Muc-Wierzgon M. (2010). Leptin and its receptors in obese patients with colorectal cancer. J. Biol. Regul. Homeost. Agents 24, 287–295 [PubMed] [Google Scholar]
- Stemmer K., Ellinger-Ziegelbauer H., Ahr H. J., Dietrich D. R. (2007). Carcinogen-specific gene expression profiles in short-term treated Eker and wild-type rats indicative of pathways involved in renal tumorigenesis. Cancer Res. 67, 4052–4068 [DOI] [PubMed] [Google Scholar]
- Stemmer K., Ellinger-Ziegelbauer H., Ahr H. J., Dietrich D. R. (2009). Molecular characterization of preneoplastic lesions provides insight on the development of renal tumors. Am. J. Pathol. 175, 1686–1698 [DOI] [PMC free article] [PubMed] [Google Scholar]
- Tedla F. M., Brar A., Browne R., Brown C. (2011). Hypertension in chronic kidney disease: navigating the evidence. Int. J. Hypertens. 2011, 132405. [DOI] [PMC free article] [PubMed] [Google Scholar]
- Unger R. H., Clark G. O., Scherer P. E., Orci L. (2010). Lipid homeostasis, lipotoxicity and the metabolic syndrome. Biochim. Biophys. Acta 1801, 209–214 [DOI] [PubMed] [Google Scholar]
- Vaisse C., Halaas J. L., Horvath C. M., Darnell J. E., Jr, Stoffel M., Friedman J. M. (1996). Leptin activation of Stat3 in the hypothalamus of wild-type and ob/ob mice but not db/db mice. Nat. Genet. 14, 95–97 [DOI] [PubMed] [Google Scholar]
- Villanueva E. C., Myers M. G., Jr (2008). Leptin receptor signaling and the regulation of mammalian physiology. Int. J. Obes. 32 Suppl. 7, S8–S12 [DOI] [PMC free article] [PubMed] [Google Scholar]
- Wang Z., Jiang T., Li J., Proctor G., McManaman J. L., Lucia S., Chua S., Levi M. (2005). Regulation of renal lipid metabolism, lipid accumulation, and glomerulosclerosis in FVBdb/db mice with type 2 diabetes. Diabetes 54, 2328–2335 [DOI] [PubMed] [Google Scholar]
- Xin H., Zhang C., Herrmann A., Du Y., Figlin R., Yu H. (2009). Sunitinib inhibition of Stat3 induces renal cell carcinoma tumor cell apoptosis and reduces immunosuppressive cells. Cancer Res. 69, 2506–2513 [DOI] [PMC free article] [PubMed] [Google Scholar]
- Yu H., Pardoll D., Jove R. (2009). STATs in cancer inflammation and immunity: a leading role for STAT3. Nat. Rev. Cancer 9, 798–809 [DOI] [PMC free article] [PubMed] [Google Scholar]
Associated Data
This section collects any data citations, data availability statements, or supplementary materials included in this article.