

Abstract
Iron-deficiency anemia (IDA) is recognized to have long-lasting effects on neurodevelopment, but there is little research on neuroendocrine systems. This study examined the effects of IDA in early or later infancy on plasmacortisol and prolactin stress-response patterns for one hour after a venipuncture and catheter placement in 10-year-old healthy Chilean children. Children identified with IDA at 6 months (IDA-6; n = 13) or 12 months (IDA-12; n = 24) and who were iron sufficient at other infancy time points were compared to children who were iron sufficient (IS)at all time-points during infancy (n = 23). All children received at least 6 months of oral iron treatment in infancy. At 10 years of age, IDA-6 and IDA-12 children demonstrated altered cortisol response patterns; both showed a more immediate decline and IDA-12 children showed a blunted curvature compared to IS children. IDA-12 children showed significantly lower cortisol levels at 30 and 45 minutes after venipuncture and catheter placement than IS children. There were no significant differences for stress-responsive plasma prolactin patterns between groups. The results indicate that having IDA during infancy is associated with long-term neuroendocrine effects on stress-responsive cortisol patterns.
INTRODUCTION
Iron is required for many central nervous system (CNS) processes (1). In recent decades, there has been an upsurge in research on the CNS effects of iron deficiency (ID), a common nutritional disorder which affects billions of people worldwide. Several CNS processes that are altered in ID are involved in neuroendocrine functioning (2), but few ID studies have considered neuroendocrine effects. Studies in the 1980s assessed prolactin because of the link of iron deficiency anemia (IDA) to altered brain dopamine systems and because prolactin is under inhibitory dopaminergic control (3–5). Serumprolactin concentrations and hepatic prolactin receptors were elevated in iron-deficient rats (6, 7). We previously explored serum prolactin in a relatively small sample of 12- to 23-month-old Costa Rican infants who participated in a study of ID and infant development. Serum prolactin levels did not differ by iron status, but the behavioral profile typical of infants with IDA (wary and hesitant) was associated with elevated serum prolactin (8). Serum prolactin was measured again in the same children in early adolescence and those who had chronic ID in infancy showed an altered serum prolactin response pattern, suggesting long-term effects on this neuroendocrine system (9).
Over two decades ago, researchers also investigated the hypothalamic-pituitary-adrenal (HPA) axis and IDA in rats. Rat pups raised on an iron-deficient diet from birth had elevated basal corticosterone levels at 29–30 days of life and a lower incremental increase in corticosterone in response to ether-exposure stress, compared to iron-sufficient pups (10). After a month of dietary iron treatment, basal corticosterone did not differ for previously IDA and control rats; however, behavioral differences persisted on mildly stressful tasks between these groups (11, 12). In another study, prepubertal rats made iron deficient after weaning showed increased urinary norepinephrine at baseline and after surgical stress (13). Norepinephrine stimulates adrenocorticotropin (ACTH) production from the anterior pituitary, which in turn, stimulates cortisol production, the end-product of HPA activation. However, in the same post-weaning IDA model, young adult IDA rats did not show basal corticosterone differences. In addition, mild or severe stress was associated with only modest corticosterone changes in IDA rats (14). Ultrastructural and cytochemical changes in adrenal cortex have also been observed in IDA rats (15). Overall, in studies of IDA and the HPA system in rodents, the findings have been mixed.
There is little available research on IDA and cortisol responses in humans or non-human primates. In a preliminary report, children who were treated for IDA during infancy showed lower morning cortisol levels (16). Another study showed IDA adults had blunted cortisol responses to ACTH stimulation (17). In a monkey study, infants born to mothers that were randomly assigned to prenatal iron deprivation showed elevated cortisol levels in response to novel contexts at 4 months of age. The 4 month age in monkeys is roughly equivalent to older infancy/toddlerhood in humans (18). At no time were the monkey mothers or infants anemic in this study, indicating that the effects of iron deprivation occurred in the absence of anemia. Thus, there is evidence of effects of ID and IDA on the HPA system in human and non-human primates, but the few available studies involved different age periods and conditions.
In order to clarify the relationship between IDA in infancy and neuroendocrine responses to stress later in life, we assessed stress-responsive plasma cortisol and prolactin concentrations in 10-year-old Chilean children who had been recruited in infancy and then followed for iron status and behavior. Using venipuncture and catheter placement, the same procedure as in our Costa Rica study, we collected sequential blood samples over one hour in order to evaluate neuroendocrine responses to the stress of venipuncture. Based on our previous results, we predicted that children who had IDA as infants would show a faster decline in plasma prolactin concentration. We did not have specific predictions about cortisol changes due to mixed findings in the studies available on the HPA axis and IDA. The Chile study was also designed to consider whether the age at which IDA occurred in infancy affected outcomes.
METHODS
Subjects
Children who had IDA at 6, 12, or 18 months of age and children who had been non-anemic in infancy were invited to participate in a neuromaturation follow-up at 10 years of age. The subjects were participants in an ongoing research project on sensory, motor, social-emotional, cognitive, and neuromaturation effects of IDA in infancy. Detailed descriptions of the subjects and findings during infancy and preschool age have been published (19–22). Briefly, study participants were healthy, full-term Chilean infants (birth weight ≥ 3 kg, no perinatal complications and no acute or chronic illnesses). Anemia was defined as venous hemoglobin (Hb) ≤ 100 g/I at 6 months and < 110 g/I at 12 or 18 months (23). ID was defined as two or more of three iron measures in the deficient range (mean cell volume (MCV)<70 fl, erythrocyte protoporphyrin (FEP) ≥100 μg/dl red blood cells (1.77 μM), serum ferritin <12 μg/I). For each infant with IDA identified at 6, 12, or 18 months, an infant of the same age who was non anemic (venous Hb ≥ 115 g/I) was randomly selected. Six-month-old infants were treated for one year with 15 mg/d of elemental iron as oral ferrous sulphate; infants identified at 12 or 18 months were treated with oral iron (30 mg/day) for a minimum of 6 months. To reduce the chances that infants from the non-anemic group became iron-deficient, they underwent the same iron treatment.
For the 10-year follow-up, we attempted to contact the 269 children from the larger study who had neurophysiology studies in infancy or the preschool period. Thirty-one children did not participate in the follow-up: 19 had moved, 8 declined participation or had a scheduling conflict, 3 could not be located, and 1 was disqualified due to health problems. Participating children and their families were free to agree to some but not all parts of the follow-up. Therefore, of the families contacted, 114 agreed to sequential blood samples following venipuncture and catheter placement. There were no statistically significant differences in background characteristics among former IDA children who had catheter placement for neuroendocrine assessments and those who participated only in other aspects of the follow up study. Comparing the children who had been non-anemic in infancy and had the neuroendocrine assessments at 10 years of age with those who did not, those with neuroendocrine studies had been born to older mothers (28.5 vs. 25.0 years, p = .01), and a higher proportion lived in father-absent households at follow-up (31% vs. 13%, p = .04). Socioeconomic status (SES) evaluation was available as previously described for infancy and the 10-year follow up (23, 24).
The original infant study and follow-up protocols were approved and reviewed annually by the Institutional Review Boards of the University of Michigan Medical Center, Ann Arbor, MI and Institute of Nutrition and Food Technology (INTA), University of Chile, Santiago. Parents provided signed informed consent, and children provided assent beginning at 10 years of age.
Procedures
Children and their mothers were transported to the laboratory for an overnight sleep study. On arrival in the early evening, they became familiar with personnel and setting; individual’s bedtime routines were maintained. Blood was sampled at venipuncture and catheter placement and then every 15 minutes thereafter for one hour. During this hour, the children were prepared for polysomnography (e.g., reminding them of the procedure, placing electrodes, etc.) by experienced and familiar project personnel. Tanner stage was determined by one of the physician investigators (25).
Iron status and neuroendocrine analyses
Iron status was based on venous Hb, MCV, FEP, transferrin saturation, and ferritin in infancy and at this 10 year follow-up. Children in the parent study were also assessed at 5 years and available hematology was also reviewed for the subjects in the present study. As in the past, we defined anemia as Hb below normal for age and sex and ID as 2 or more abnormal iron measures. Cutoffs for 10-year-olds in NHANES III were used to determine ID (≥2 abnormal measures and IDA (low Hb as well): Hb<118 g/l, MCV<76 fl, transferrin saturation <14%,> 1.24 μmol/l red blood cells (70 μg/dl), and plasma ferritin <12mcg/l. For neuroendocrine assays, blood samples were promptly centrifuged and plasma samples were frozen at −80°C. Plasma was assayed in duplicate for prolactin and cortisol concentrations using electrochemiluminescence assays (Roche, Basel, Switzerland). Samples were assayed once for each neuroendocrine measure. The coefficient of variation was 1.94% for cortisol and 0.42% for prolactin.
Data analysis
Due to the nature of the original Chile study, infants could have been iron-deficient at time points other than the age at which IDA was identified. For example, an infant identified as IDA at 12 months could have been iron-deficient at 6 or 18 months. Including such infants would complicate our ability to see a primary effect of timing of IDA. We therefore used all available hematology data at 6, 12, and 18 months to identify clear-cut groups with regard to iron status and timing, specifically children who had been IDA only at the time point of identification. Similarly, non-anemic infants could have been iron-deficient at one or more time points, since the non-anemic group was selected based on hemoglobin only. In order to have a clear-cut, iron sufficient (IS) control group for comparison, we excluded children who were iron deficient as infants. Only 6 infants identified with IDA at 18 months were iron sufficient at other time points; this n was too small for separate comparisons. Consequently, we compared the following three groups: IDA at 6 months (IDA-6), IDA at 12 months (IDA-12)) or IS, always iron sufficient. The final subject sample was 60.
Prolactin and cortisol concentrations were compared by iron status in infancy by using mixed models with random effects fitted with PROC MIXED in the Statistical Analysis System (SAS) (26). To account for the within-subject correlations due to sequential measurements on the same subject, we used a hierarchical modeling approach where each subject had his or her own random intercept and slope. Gender, age at 10-year assessment, and Tanner stage were considered as controlling covariates in the mixed models. A three-way interaction term of time (both linear and quadratic), infancy iron status, and gender was also included to assess whether any group differences in neuroendocrine response trajectories varied by gender.
RESULTS
The characteristics of the 60 children (n: IDA-6=13; IDA-12=24; IS=23) included in this study are shown in the Table 1. At the time of this neuroendocrine assessment, children in the IDA-6 group were significantly younger than the comparison group of IS children, but the 0.1 year difference is equivalent to about 5 weeks and not clinically meaningful at this age. There was also a lower percent of boys in IS group but the percent gender by group did not differ significantly. Socioeconomic status of the children in this study did not differ at enrollment in infancy or at the time of this follow up by iron status group (Table 1). Tables 2, 3 and 4 show the hematology for the study children in infancy, and at 5 and 10 years of age, respectively by iron status group. IDA in infancy responded well to iron therapy (Table 2), and the majority of children maintained good iron status subsequently. Of the samples available at 5 years, only three children had ID (Table 3). At 10 years, three children had ID (Table 4). Removing the ID children from analysis did not change the results as outlined below.
Table 1.
Subject Characteristicsa
| IDA-6b | IDA-12b | ISb | p-value | |
|---|---|---|---|---|
|
| ||||
| N | 13 | 24 | 23 | |
|
| ||||
| Percent male (n) | 61.5% (8)* | 62.5% (15)* | 39% (9)* | 0.238 |
|
| ||||
| Age (years ± SD) | 10.1 + 0.1*,† | 10.2 + 0.1**,† | 10.2 + 0.2** | 0.028 |
|
| ||||
| Tanner stage (mean ± SD) | 1.1 + 0.3* | 1.2 + 0.4* | 1.1 + 0.3* | 0.548 |
|
| ||||
| SES (Infancy) | 39.7±10.9* | 38.5±8.4* | 37.4±11.1* | 0.815 |
| (10 years) | 31.1±3.9* | 34.3±5.8* | 32.6±9.8* | 0.459 |
The number, percent male, average age, Tanner stage (25) and SES (at enrollment in infancy and at the present 10-year follow up) (23, 24) are shown for study children.
- IDA-6: Infants whose iron deficiency anemia status was identified at 6 months but were iron sufficient at 12 or 18 months.
- IDA-12: Infants whose iron deficiency anemia status was identified at 12 months but were iron sufficient at 6 or 18 months.
- IS: Randomly selected formerly non-anemic infants.
Different superscripts indicate significant differences at p < 0.05.
Table 2.
Subject Hematology in Infancy by Iron Status Group
| Iron Statusa | N Obsb | Hematologyc (6 & 12 mo) | Nd | Mean | SD | Mean Hb Δ (6 to 12 mo) | Mean Hb Δ (12 to 18 mo) |
|---|---|---|---|---|---|---|---|
|
| |||||||
| Control | 23 | Hb (g/l) | 23 | 125.6 | 6.1 | 2.6 (n = 13) Range: −5,11 |
3.1 (n=8) Range: −4,10 |
| MCV (fl) | 23 | 75.1 | 2.7 | ||||
| FEP (mcg/dl) | 23 | 84.7 | 22.4 | ||||
| Ferritin (mcg/l) | 22 | 21.8 | 17.5 | ||||
|
| |||||||
| IDA (6 mo) | 13 | Hb (g/l) | 13 | 94.8 | 5.5 | 31.4 Range: 10,53 |
N/A |
| MCV (fl) | 13 | 64.7 | 4.2 | ||||
| FEP (mcg/dl) | 13 | 180.8 | 59.1 | ||||
| Ferritin (mcg/l) | 12 | 10.1 | 10.2 | ||||
|
| |||||||
| IDA (12 mo) | 24 | Hb (g/l) | 24 | 103.6 | 5.0 | N/A | 17.6 (n=16) Range: 9,38 |
| MCV (fl) | 24 | 67.7 | 4.9 | ||||
| FEP (mcg/dl) | 24 | 137.1 | 52.2 | ||||
| Ferritin (mcg/l) | 24 | 4.4 | 4.2 | ||||
The hematology and response to iron treatment in infancy by infant iron status group.
- IDA-6: Infants whose iron deficiency anemia status was identified at 6 months but were iron sufficient at 12 or 18 months.
- IDA-12: Infants whose iron deficiency anemia status was identified at 12 months but were iron sufficient at 6 or 18 months.
- IS: Randomly selected formerly non-anemic infants.
NObs: Total number of children in each iron status group.
Mean and standard deviation (SD) are shown for the following hematology measures: hemoglobin (Hb); mean corpuscular volume (MCV); free erythrocyte protoporphyrin (FEP); and plasma ferritin (Ferritin).
N: Number of blood samples available.
Table 3.
Subject Hematology at 5 Years by Infant Iron Status Group
| Iron Statusa | N Obsb | Hematologyc (5 yr) | Nd | Mean | SD | ID (n, %)e |
|---|---|---|---|---|---|---|
|
| ||||||
| Control | 23 | Hb (g/l) | 16 | 133.6 | 6.3 | 0, 0% |
| MCV (fl) | 16 | 79.2 | 2.1 | |||
| FEP (mcg/dl) | 9 | 67.3 | 16.0 | |||
| Ferritin (mcg/l) | 16 | 20.5 | 10.8 | |||
|
| ||||||
| IDA (6 mo) | 13 | Hb (g/l) | 5 | 128.2 | 9.4 | 1, 33.3% |
| MCV (fl) | 5 | 77.0 | 3.3 | |||
| FEP (mcg/dl) | 3 | 55.0 | 21.9 | |||
| Ferritin (mcg/l) | 5 | 15.3 | 11.3 | |||
|
| ||||||
| IDA (12 mo) | 24 | Hb (g/l) | 20 | 126.5 | 5.8 | 2, 10.0% |
| MCV (fl) | 20 | 78.2 | 5.3 | |||
| FEP (mcg/dl) | 19 | 64.2 | 37.6 | |||
| Ferritin (mcg/l) | 20 | 23.0 | 11.2 | |||
The hematology for study children at 5-year follow up by infant iron status group.
- IDA-6: Infants whose iron deficiency anemia status was identified at 6 months but were iron sufficient at 12 or 18 months.
- IDA-12: Infants whose iron deficiency anemia status was identified at 12 months but were iron sufficient at 6 or 18 months.
- IS: Randomly selected formerly non-anemic infants.
NObs: Total number of children in each iron status group.
Mean and standard deviation (SD) are shown for the following hematology measures: hemoglobin (Hb); mean corpuscular volume (MCV); free erythrocyte protoporphyrin (FEP); and plasma ferritin (Ferritin).
N: Number of blood samples available.
ID (n, %): The number and percent of subjects that are ID at 5 years of age.
Table 4.
Subject Hematology at 10 Years by Infant Iron Status Group
| Iron Statusa | N Obsb | Hematologyc (10 yr) | Nd | Mean | SD | ID (n, %)e |
|---|---|---|---|---|---|---|
|
| ||||||
| Control | 23 | Hb (g/l) | 23 | 131.6 | 11.1 | 0, 0% |
| MCV (fl) | 23 | 83.0 | 2.9 | |||
| FEP (mcg/dl) | 23 | 64.2 | 15.3 | |||
| Ferritin (mcg/l) | 23 | 29.8 | 10.4 | |||
|
| ||||||
| IDA (6 mo) | 13 | Hb (g/l) | 13 | 122.9 | 8.1 | 1, 7.7% |
| MCV (fl) | 13 | 80.5 | 2.1 | |||
| FEP (mcg/dl) | 13 | 60.9 | 18.0 | |||
| Ferritin (mcg/l) | 13 | 28.2 | 15.3 | |||
|
| ||||||
| IDA (12 mo) | 24 | Hb (g/l) | 23 | 131.2 | 8.7 | 2, 8.7% |
| MCV (fl) | 23 | 80.5 | 4.9 | |||
| FEP (mcg/dl) | 23 | 69.7 | 12.1 | |||
| Ferritin (mcg/l) | 23 | 28.1 | 13.6 | |||
The hematology for study children at 10-year follow up is shown by infant iron status group.
- IDA-6: Infants whose iron deficiency anemia status was identified at 6 months but were iron sufficient at 12 or 18 months.
- IDA-12: Infants whose iron deficiency anemia status was identified at 12 months but were iron sufficient at 6 or 18 months.
- IS: Randomly selected formerly non-anemic infants.
NObs: Total number of children in each iron status group.
Mean and standard deviation (SD) are shown for the following hematology measures: hemoglobin (Hb); mean corpuscular volume (MCV); free erythrocyte protoporphyrin (FEP); and plasma ferritin (Ferritin).
N: Number of blood samples available.
ID (n, %): The number and percent of subjects that are ID at 10 years of age.
Plasma prolactin
Over one hour after venipuncture and catheter placement, there were no significant differences for plasma prolactin concentration or response pattern by iron status in infancy, whether unadjusted or adjusted for age, puberty and gender. The plasma prolactin response patterns are shown in Figure 1 A for each iron status group.
Figure 1. Neuroendocrine Response to Venipuncture by Iron Status in Infancy.
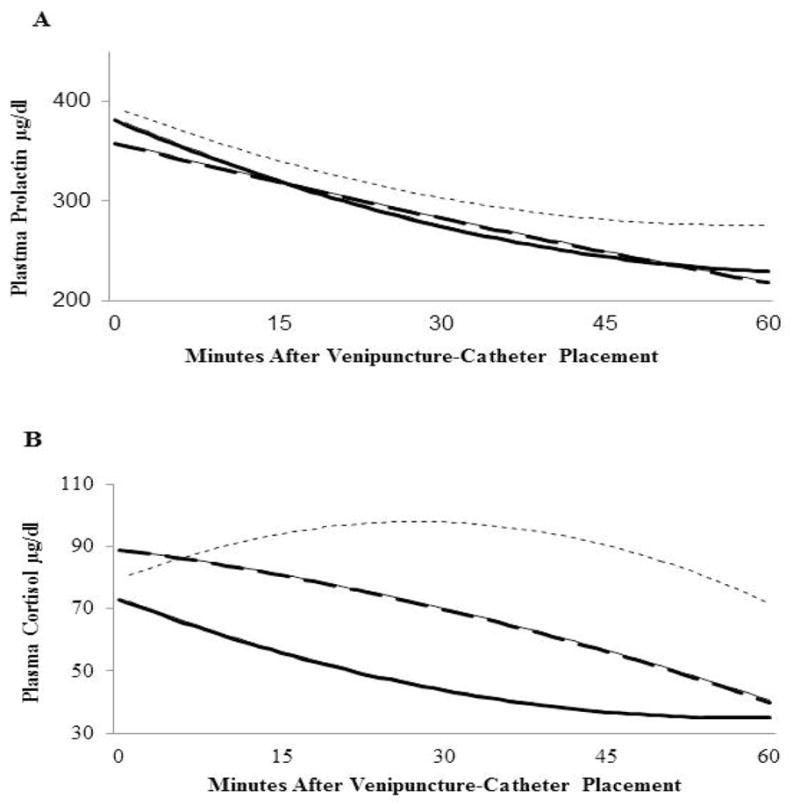
The hierarchical modeling curves for plasma prolactin and cortisol response were determined using samples obtained at 0, 15, 30, 45 and 60 minutes after venipuncture and catheter placement. A. Plasma Prolactin. There were no significant differences for intercept, initial slope or curvature by iron status group. B. Plasma Cortisol. The curves for plasma cortisol response show significantly reduced initial slope for IDA-6 (−27.2) and IDA-12 (−79.1) compared to IS (80.3), p=.05 and p<.001, respectively. The curvature of the response pattern was significantly blunted for IDA-12 compared to IS (41.1 vs. −88.3, p<.001). The IDA-6 response pattern did not differ significantly from IDA-12 or IS.
IDA-6 (long dashed): Infants with iron deficiency anemia identified at 6 months and iron sufficient at other times of measurement in infancy (n=13).
IDA-12 (solid): Infants with iron deficiency anemia status at 12 months and iron sufficient at other times of measurement in infancy (n=24).
IS (short dash): Randomly selected formerly non-anemic infants (n=23).
Plasma cortisol
There were no significant differences for plasma cortisol level at venipuncture and catheter placement (time 0). However, theIDA-12 group had significantly lower cortisol levels at 30 and 45 minutes after venipuncture than the IS group (mean μg/dl± standard error (SE)); 30 min: IDA-12 43.4 ± 13.5; IS 97.8 ±13.3; 45 min: IDA-12 36.4 ± 12.7; IS 90.1 ± 12.5). Children in the IDA-6 group did not differ from IS or IDA-12 groups at any time point. The plasma cortisol response patterns are shown in Figure 1 B. The initial slope or rise was significantly greater for the IS (β=80.3) group than for both the IDA-6 (β=−27.2) and IDA-12 (β =−79.1) groups, p=.05 and p<.001, respectively. The curvature of the response pattern was blunted for the IDA-12 (β=41.1) group compared to the IS group (β= −88.6), p<.001. The curvature of the IDA-6 group response pattern did not differ significantly from the IS or IDA-12 groups.
DISCUSSION
This study demonstrates that IDA in infancy is associated with long-lasting differences in the HPA neuroendocrine system. Compared to children who were IS during infancy, children who had IDA at either 6 or 12 months lacked the typical rise of cortisol after an acute stress of venipuncture and catheter placement at 10 years of age. In addition, children who had IDA identified at 12 months had a blunted cortisol response pattern, and plasma cortisol concentration at 30 and 45 minutes after venipuncture and catheter placement compared with those who were IS in infancy. Thus, years later, IDA during infancy appears to alter the initial cortisol response to stress, and for those who had IDA at 12 months, ablunting of the typical stress-responsive pattern.
The HPA axis is the major stress-response system in humans and cortisol responses are affected by several factors including the type of stress, the context the individual is experiencing around the time of measurement, and the individual’s previous experiences, e.g., during the development of the HPA axis (27, 28). In this study, the type of stress was standardized to venipuncture and catheter placement. The context was standardized to a process of a brief physical exam and being prepared for a polysomnographic sleep study, a protocol that was familiar to the children without affecting the individual bedtime routines. The last aspect is relevant since sleep restriction/deprivation is a modifier of plasma cortisol concentration values (29). Cortisol also has diurnal or circadian modulation of the HPA axis; time of day influences plasma cortisol concentration which in turn, affects cortisol responses to stress. Cortisol levels are typically highest during the last part of nighttime sleep and 30 minutes of awakening, and after an initial rapid decline, levels decrease more gradually during the afternoon reaching a nadir by the late evening, typically at waking-sleep transition and sleep onset (28, 30, 31). The extent of rise of cortisol after a stress is constrained when the cortisol levels are already elevated, as in the early morning (32). In this study, the neuroendocrine measurements were performed at least one hour before the expected individual sleep onset.
The first blood sample in this study was obtained at the nadir of the cortisol circadian pattern and showed no differences by infancy iron status. This suggests the evening nadir of the diurnal HPA system was not significantly altered by infant IDA; however, another study assessed IDA and diurnal HPA cortisol levels and is important to consider. A study by Yehuda et al, demonstrated lower morning salivary cortisol levels in 10-year-old children who had IDA during infancy (16). This suggested a blunting of the normal morning rise of the diurnal cortisol pattern. While there are important design differences between the Yehuda study and the present one, (time of day of assessment, sample type and collection method- venipuncture versus salivary, among others), the possibility that IDA during early life has long-lasting effect on the diurnal circadian cortisol system deserves further investigation.
Differences of the stress-responsive cortisol system were demonstrated for study children who had IDA at 12 months; lower plasma cortisol concentrations and a blunted response pattern after a stress compared to children who were IS in infancy. Flattening of the cortisol stress-responsive and circadian patterns has been described in animal models and in humans. Termed hypocortisolism, such alterations of HPA functioning have been linked to adverse or challenging experiences early in life (28, 33). Investigations in animal models suggest there are sensitive periods during the development of the HPA axis whereby stress and high cortisol (corticosterone) exposure are associated with reduced amplitude of the circadian modulation (e.g., lower morning levels) and blunted cortisol responses to stress later in life. This blunted cortisol response pattern for infants who had IDA at 12 months is consistent with some of the previous findings in rodent studies (10, 11). The mechanisms that underlie the blunted stress-responsive cortisol pattern long term are unknown. However, like other challenges early in life, this nutritional deficiency may result in long-lasting, key alterations in HPA functioning.
In this study, we assessed the timing of IDA and used strict criteria that limited the possibility of ID without anemia at other time points. This was due to the monkey study finding that iron deficiency without anemia was associated with altered cortisol responses (18). We found that children who had IDA between 6 and 12 months appeared to have an intermediate cortisol response, lower than the IS group but not significantly different from either the IS or IDA-12 group. Unfortunately, a limitation of assessing discrete IDA time periods is that it likely limited our power to determine other smaller but true differences in cortisol level and response patterns.
Plasma prolactin concentration and response patterns after venipuncture and catheter placement at age 10 years did not differ by iron status in infancy. These results differed from our previous finding in Costa Rica and our predictions for this study. In the Costa Rica study, chronic ID in infancy was associated with a blunted serum prolactin response pattern after venipuncture and catheter placement in early adolescence (9). There are several important differences that may explain the discrepant findings between studies. The children in the Costa Rica study likely experienced a more chronic period of ID/IDA as they were identified later in infancy (at 17 months, on average), and iron status before identification was unknown. In contrast, the children described in the present study could not have had IDA in infancy for more than a few months since their iron status was measured at 6,12, and 18 months, and they received prompt iron treatment upon detection of IDA. In addition, the adolescents in the Costa Rica study were, on average, two years older than the children in the present study and many were pubertal; the majority in the present study was not. Furthermore, the time of day of assessment in the Costa Rica study was morning contrary to the evening measurements in the present study. Plasma prolactin also has a circadian pattern with higher levels during sleep. Thus, the differences in study findings could reflect the timing, duration, and/or severity of IDA in infancy, developmental stage at follow-up, and/or time of day of assessment. Finally, since plasma prolactin concentration and rapid-eye-movement (REM) sleep regulation are closely related (34), and former IDA subjects showed altered REM sleep patterns (22), differences in prolactin concentration between groups could become apparent during sleep. Given the strong theoretical basis for expecting an effect of early IDA on the dopaminergic regulation of the prolactin system, further work is needed (4, 35).
The present study is limited by the relatively small number of subjects and a lower percent of males in one group; however, our aim was to examine the effect of time of IDA during infancy on neuroendocrine measures. By design, we included only those children who had IDA at one time point in infancy and were otherwise iron sufficient, or for the IS group, only those children who were iron sufficient throughout infancy. A second limitation is that we measured only the end products, cortisol and prolactin, of two neuroendocrine systems. Future studies should consider measuring ACTH at the time of blood collection to help understand potential mechanisms underlying the differences in response pattern observed (e.g., hypothalamic or adrenal). Measuring salivary cortisol in the time period before, at, and after catheter placement might also help determine whether those children who had IDA in infancy had anticipatory cortisol responses to the procedures, which might have obscured initial differences. Other limitations of this study include a lack of data about specific genetic differences for the study children, dietary factors over the course of childhood, and that we could not control changes in iron status during the periods between 12 months, 5, and 10 years. Taken together, these limitations reduce the stringency of our conclusions. There is no clear explanation why neuroendocrine alterations associated with early IDA should be that long-lasting and we cannot rule out that these uncontrolled confounders or some other unidentified factor(s) may account for the association. Still, we suggest that these neuroendocrine alterations may relate to persisting modifications of the brain processes in which iron is involved.
In summary, while long-term effects of IDA in infancy have been shown for several aspects of neurodevelopment across species, this study demonstrated that IDA in infancy also affects the HPA neuroendocrine system later in life. IDA around a year of age, blunted serum cortisol response patterns to a stress at age 10 years. IDA in infancy was not associated with differences in the prolactin stress-responsive system. However, findings from previous studies and the theoretical basis for IDA effects suggest that further evaluation of this system is warranted.
Acknowledgments
Financial support for study: This study was supported by NIH grant HD33487.
Footnotes
Publisher's Disclaimer: This is a PDF file of an unedited peer-reviewed manuscript that has been accepted for publication. NPG are providing this early version of the manuscript as a service to our customers. The manuscript will undergo copyediting, typesetting and a proof review before it is published in its final form. Please note that during the production process errors may be discovered which could affect the content, and all legal disclaimers apply.
References
- 1.Beard JL, Connor JR. Iron status and neural functioning. Ann Rev Nutr. 2003;23:41–58. doi: 10.1146/annurev.nutr.23.020102.075739. [DOI] [PubMed] [Google Scholar]
- 2.Lozoff B, Beard J, Connor J, Felt B, Georgieff M, Schallert T. Long-lasting neural and behavioral effects of iron deficiency in infancy. Nutr Rev. 2006;64:S34–S43. doi: 10.1301/nr.2006.may.S34-S43. [DOI] [PMC free article] [PubMed] [Google Scholar]
- 3.Youdim MBH. Brain iron metabolism biochemical and behavioral aspects in relation to dopaminergic neurotransmission. In: Lagoth A, editor. Handbook of Neurochemistry. New York: Plenum Press; 1985. pp. 731–755. [Google Scholar]
- 4.Ben-Jonathan N, Hnasko R. Dopamine as a prolactin (PRL) inhibitor. Endocr Rev. 2001;22:724–763. doi: 10.1210/edrv.22.6.0451. [DOI] [PubMed] [Google Scholar]
- 5.Youdim MBH, Ben-Shachar D, Yehuda S. Putative biological mechanisms of the effect of iron deficiency on brain biochemistry and behavior. Am J Clin Nutr. 1989;50:607–617. doi: 10.1093/ajcn/50.3.607. [DOI] [PubMed] [Google Scholar]
- 6.Barkey RJ, Ben-Shachar D, Amit T, Youdim MBH. Increased hepatic and reduced prostatic prolactin (PRL) binding in iron deficiency and during neuroleptic treatment: correlation with changes in serum PRL and testosterone. Eur J Pharmacol. 1985;109:193–200. doi: 10.1016/0014-2999(85)90420-0. [DOI] [PubMed] [Google Scholar]
- 7.Barkey RJ, Amit T, Ben-Shachar D, Youdim MBH. Characterization of the hepatic prolactin receptors induced by chronic iron deficiency and neuroleptics. Eur J Pharmacol. 1986;122:259–267. doi: 10.1016/0014-2999(86)90111-1. [DOI] [PubMed] [Google Scholar]
- 8.Lozoff B, Felt BT, Nelson EC, Wolf AW, Meltzer HW, Jimenez E. Serum prolactin levels and behavior in infants. Biol Psychiatry. 1995;37:4–12. doi: 10.1016/0006-3223(94)00148-V. [DOI] [PubMed] [Google Scholar]
- 9.Felt B, Jimenez E, Smith J, et al. Iron deficiency in infancy predicts altered serum prolactin response 10 years later. Pediatr Res. 2006;60:513–517. doi: 10.1203/01.PDR.0000242848.45999.7b. [DOI] [PMC free article] [PubMed] [Google Scholar]
- 10.Weinberg J, Dallman PR, Levine S. Iron deficiency during early development in the rat: behavioral and physiological consequences. Pharmacol Biochem Behav. 1980;12:493–502. doi: 10.1016/0091-3057(80)90179-3. [DOI] [PubMed] [Google Scholar]
- 11.Weinberg J, Levine S, Dallman PR. Long-term consequences of early iron deficiency in the rat. Pharmacol Biochem Behav. 1979;11:631–638. doi: 10.1016/0091-3057(79)90254-5. [DOI] [PubMed] [Google Scholar]
- 12.Weinberg J, Brett LP, Levine S, Dallman PR. Long-term effects of early iron deficiency on consummatory behavior in the rat. Pharmacol Biochem Behav. 1981;14:447–453. doi: 10.1016/0091-3057(81)90301-4. [DOI] [PubMed] [Google Scholar]
- 13.Groeneveld D, Smeets HG, Kabra PM, Dallman PR. Urinary catecholamines in iron-deficient rats at rest and following surgical stress. Am J Clin Nutr. 1985;42:263–269. doi: 10.1093/ajcn/42.2.263. [DOI] [PubMed] [Google Scholar]
- 14.Dallman PR, Refino CA, Dallman MF. The pituitary-adrenal response to stress in the iron-deficient rat. J Nutr. 1984;114:1747–1753. doi: 10.1093/jn/114.10.1747. [DOI] [PubMed] [Google Scholar]
- 15.Coleman R, Tanne Z, Nahir M, Shomrat D, Miller-Lotan R, Youdim MB. Ultrastructural changes in mitochondria of the adrenal cortex of iron-deficient rats. Acta Anat. 1995;152:33–40. doi: 10.1159/000147681. [DOI] [PubMed] [Google Scholar]
- 16.Yehuda S, Yehuda M. Long lasting effects of infancy iron deficiency- Preliminary results. J Neural Transm [Suppl] 2006;71:197–200. doi: 10.1007/978-3-211-33328-0_20. [DOI] [PubMed] [Google Scholar]
- 17.Saad MJ, Morais SL, Saad ST. Reduced cortisol secretion in patients with iron deficiency. Ann Nutr Metab. 1991;35:111–115. doi: 10.1159/000177633. [DOI] [PubMed] [Google Scholar]
- 18.Golub MS, Hogrefe CE, Tarantal AF, et al. Diet-induced iron deficiency anemia and pregnancy outcome in the rhesus monkey. Am J Clin Nutr. 2006;83:647–656. doi: 10.1093/ajcn.83.3.647. [DOI] [PMC free article] [PubMed] [Google Scholar]
- 19.Roncagliolo M, Garrido M, Walter T, Peirano P, Lozoff B. Evidence of altered central nervous system development in infants with iron deficiency anemia at 6 mo: Delayed maturation of auditory brain stem responses. Am J Clin Nutr. 1998;68:683–690. doi: 10.1093/ajcn/68.3.683. [DOI] [PubMed] [Google Scholar]
- 20.Algarin C, Peirano P, Garrido M, Pizarro F, Lozoff B. Iron deficiency anemia in infancy: Long-lasting effects on auditory and visual systems functioning. Pediatr Res. 2003;53:217–223. doi: 10.1203/01.PDR.0000047657.23156.55. [DOI] [PubMed] [Google Scholar]
- 21.Peirano P, Algarin C, Garrido M, Algarin D, Lozoff B. Iron-deficiency anemia is associated with altered characteristics of sleep spindles in NREM sleep in infancy. Neurochem Res. 2007;32:1665–1672. doi: 10.1007/s11064-007-9396-8. [DOI] [PMC free article] [PubMed] [Google Scholar]
- 22.Peirano P, Algarin C, Garrido M, Lozoff B. Iron deficiency anemia (IDA) in infancy is associated with altered sleep states organization in early childhood. Pediatr Res. 2007;62:715–719. doi: 10.1203/PDR.0b013e3181586aef. [DOI] [PMC free article] [PubMed] [Google Scholar]
- 23.Lozoff B, De Andraca I, Castillo M, Smith J, Walter T, Pino P. Behavioral and developmental effects of preventing iron-deficiency anemia in healthy full-term infants. Pediatrics. 2003;112:846–854. [PubMed] [Google Scholar]
- 24.Alvarez M, Muzzo S, Ivanovic D. Escala para la medicion del nivel socioeconomico en el area de la salud. Rev Med Chil. 1985;113:243–249. [PubMed] [Google Scholar]
- 25.Tanner JM. Growth at Adolescence. Oxford: Blackwell Scientific; 1962. [Google Scholar]
- 26.Littell RC, Milliken GA, Stroup WW, Wolfinger RD. SAS System for Mixed Models. SAS Institute; Cary, NC: 1996. [Google Scholar]
- 27.Lopez NL, Vazquez DM, Olson SL. An integrative approach to the neurophysiological substrates of social withdrawal and aggression. Dev Psychopathol. 2004;16:69–93. doi: 10.1017/s0954579404044414. [DOI] [PubMed] [Google Scholar]
- 28.Gunnar MR, Vazquez DM. Low cortisol and a flattening of expected daytime rhythm: potential indices of risk in human development. Dev Psychopathol. 2001;13:515–538. doi: 10.1017/s0954579401003066. [DOI] [PubMed] [Google Scholar]
- 29.Copinschi G. Metabolic and endocrine effects of sleep deprivation. Essent Psychopharmocol. 2005;6:341–347. [PubMed] [Google Scholar]
- 30.Bailey SL, Heitkemper MM. Morning-eveningness and early-morning salivary cortisol levels. Biol Psychol. 1991;32:181–192. doi: 10.1016/0301-0511(91)90009-6. [DOI] [PubMed] [Google Scholar]
- 31.Schmidt-Reinwald A, Pruessner JC, Hellhammer DH, et al. The cortisol response to awakening in realtion to different challenge tests and a 12-hour cortisol rhythm. Life Sci. 1999;64:1653–1660. doi: 10.1016/s0024-3205(99)00103-4. [DOI] [PubMed] [Google Scholar]
- 32.Benjamin LS. Statistical treatment of the law of initial values (LIV) in autonomic research: A review and recommendation. Psychosom Med. 1963;25:556–566. doi: 10.1097/00006842-196311000-00005. [DOI] [PubMed] [Google Scholar]
- 33.Heim C, Ehlert U, Hellhammer DH. The potential role of hypocortisolism in the pathophysiology of stress-related bodily disorders. Psychoneuroendocrinology. 2000;25:1–35. doi: 10.1016/s0306-4530(99)00035-9. [DOI] [PubMed] [Google Scholar]
- 34.Obal F, Jr, Krueger JM. Hormones, cytokines, and sleep. In: McEwen BS, editor. Coping With the Environment Neural and Endocrine Mechanisms: Handbook of Physiology. New York: Oxford University Press; 2000. pp. 331–349. [Google Scholar]
- 35.Freeman ME, Kanyicska B, Lerant A, Nagy G. Prolactin: structure, function, and regulation of secretion. Physiol Rev. 2000;80:1523–1631. doi: 10.1152/physrev.2000.80.4.1523. [DOI] [PubMed] [Google Scholar]