

Abstract
Background:
Image bioinformatics infrastructure typically relies on a combination of server-side high-performance computing and client desktop applications tailored for graphic rendering. On the server side, matrix manipulation environments are often used as the back-end where deployment of specialized analytical workflows takes place. However, neither the server-side nor the client-side desktop solution, by themselves or combined, is conducive to the emergence of open, collaborative, computational ecosystems for image analysis that are both self-sustained and user driven.
Materials and Methods:
ImageJS was developed as a browser-based webApp, untethered from a server-side backend, by making use of recent advances in the modern web browser such as a very efficient compiler, high-end graphical rendering capabilities, and I/O tailored for code migration.
Results:
Multiple versioned code hosting services were used to develop distinct ImageJS modules to illustrate its amenability to collaborative deployment without compromise of reproducibility or provenance. The illustrative examples include modules for image segmentation, feature extraction, and filtering. The deployment of image analysis by code migration is in sharp contrast with the more conventional, heavier, and less safe reliance on data transfer. Accordingly, code and data are loaded into the browser by exactly the same script tag loading mechanism, which offers a number of interesting applications that would be hard to attain with more conventional platforms, such as NIH's popular ImageJ application.
Conclusions:
The modern web browser was found to be advantageous for image bioinformatics in both the research and clinical environments. This conclusion reflects advantages in deployment scalability and analysis reproducibility, as well as the critical ability to deliver advanced computational statistical procedures machines where access to sensitive data is controlled, that is, without local “download and installation”.
Keywords: Cloud computing, image analysis, webApp
INTRODUCTION
Image bioinformatics as a field is characterized by an odd mixture of tremendous advances in its computational statistics aspects while suffering from a persistent resistance to their use by biomedical domain experts. The image analysis platform with the deepest domain penetration in the research community is probably National Institutes of Health (NIH's) ImageJ[1] in large part because of its free open source and pluggable implementation. Over the years, an extensive community of image analysis developers and researchers has developed a comprehensive environment for image analysis software development using Java.[2] The development cycle can be roughly described as follows: when a promising new algorithm is identified, it might be first prototyped in a specialized environment such as Mathwork's Matlab, but to reach a broader non-programming audience, it is then laboriously ported as an ImageJ plugin. Illustrating the domain penetration challenge, a regular stream of new and updated plugins feeds a comprehensive repository that now has several hundred entries (http://rsbweb.nih.gov/ij/plugins/). However, a visit to the laboratory will show that those who could benefit from an add-on are typically not aware of them. Even more striking is the situation that the few researchers using image analysis, who know how to find and install plugins, often also need image analysis applications that are slight modifications or combinations of existing functionalities. Paradoxically, the computational statisticians with the quantitative expertise to develop those modifications often do not have the substantial software development skills needed to deliver the novel application as a stand-alone application or as a plugin module.
A common solution to the difficulty of matching users and data with workflows is to develop web services. For example, the quantitative image analysis of estrogen receptor, progesterone receptor, and more generically, the Ki-67 immunohistochemistry staining results in breast cancer tissue sections can be conveniently performed by submitting the image to a public web service.[3] Users benefit from improvements in the code automatically and no application needs to “installed,” therefore overcoming concerns with compromising privacy or degrading the performance of existing applications in the client machine. However, that solution comes with its own problems. Submitting to a remote service exposes the image to a third party outside the reach of institutional IT; updates in the web service may cause results not to be reproducible and the server side application is typically not exposed to public scrutiny, limiting the opportunities for other quantitative researchers to advance or even fully understand the underlying algorithms;[4] bioinformatics web services are also notorious for relatively short lifetimes, reflecting a sustainability model that can only be met in the long term by institutional commitment or by commercial products.[5]
A third solution might be to develop web services that deliver the software rather than process the data, the software-as-a-service (SaaS) model. This possibility was anticipated in the eve of Web 2.0 bioinformatics applications.[6] It was then predicted that a Web 3.0 would eventually emerge with “read-write-execute” capabilities that could be explored by analytical workflows. The ImageJS webApp ecosystem described in this report advances along those exact lines without crossing the lines set by requirements of privacy, scalability, reproducibility, and sustainable deployment associated with the biomedical environment. It also pays particular attention to the need for producing and delivering reproducible research, a topic that is taking center stage as bioinformatics increasingly seeks to deliver data-intensive solutions with translational usage.[7] Specifically, if an image analysis result can be retrieved directly from the published image, with both the data and the analytical environment that generated the result, then one could indeed claim to be reporting Reproducible Research.[8] Accordingly, ImageJS seeks to deliver image analysis results meeting the gold standard in that report's description of the Spectrum of Reproducibility [Figure 1].[8]
Figure 1.
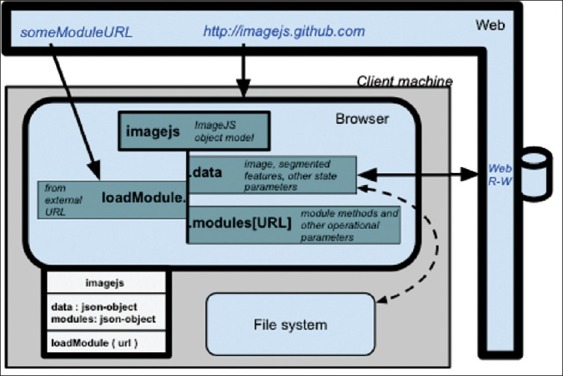
ImageJS migrates through “script tag loading” to the browser (by pointing a script.src to http://imagejs.github.com/imagejs.js), where it creates an object with a method, imagejs. loadModule, that will import and register additional components onto imagejs.modules, while keeping data meant to be shared between modules in imagejs.data. The corresponding UML representation is appended to the lower left side of the browser box. The solid lines represent programmatic exchanges and dashed line represents an exchange that requires user intervention, such as the loading or saving an image/analysis
The possibility of approaching software development as an open organic process, which is explored by the ImageJS webApp environment described here, has been proposed before as a requirement for “Medicine 2.0.”[9] As discussed in that report, such an approach would blur the separation between software development and software deployment, turning coding into a conduit for workflow assembly that is more akin to social networking mechanisms. This is a departure from conventional bioinformatics infrastructure that can also be construed as a response to the mounting knowledge re-engineering bottleneck.[10] It would provide a beyond the data deluge solution[11] to image analysis where the computation is pushed to where the data is, rather than the customary approach of shuffling the data among a myriad of analytical services.
MATERIALS AND METHODS
ImageJS was entirely developed in JavaScript (ECMAScript 5th ed.), the “assembler language of the web.” To illustrate the distributed and collaborative nature of the proposed webApp ecosystem, its component modules were developed in multiple versioned code hosting services, GitHub (http://github.com) and Google Code (http://googlecode.com). The core application is best started as a webApp at https://chrome.google.com/webstore/search/imagejs. It can also be started directly from http://imagejs.github.com/, which serves code hosted at https://github.com/imagejs/imagejs.github.com.
The segmentation, feature extraction, and filtering modules were developed, and are hosted at http://imagejs.googlecode.com/. The list of modules can be accessed directly through http://module.imagejs.googlecode.com/git/, and the development history can be inspected at http://code.google.com/p/imagejs/source/list?repo=module. In some examples, a web read-write resource is used to provide persistent image storage as a web service. A number of alternatives exist; in this report, we used WebRW HTTP-REST API, which is supported by two independent implementations, both open source: one is written in NodeJS (https://github.com/jonasalmeida/webrw) and another in PHP (https://github.com/ebadedude/webrw).
Important note: Although the core components and most modules will work in different web browsers, this study makes use of recent HTML5 features such as the file API (http://www.w3.org/TR/FileAPI/) that are still being adopted. To avoid problems with the syntax or support of recent developments in HTML5, the reader is advised to use the latest version of Google Chrome (version 18 at the time of this reporting).
Availability: https://chrome.google.com/webstore/search/imagejs
RESULTS
The ImageJS browser based computational ecosystem is loaded by pointing it (preferably using Google Chrome, see availability in Materials and Methods) to http://imagejs.github.com. This action will cause ImageJS's document object, imagejs, to migrate to the web browser. A quick inspection of this object will reveal that it includes only a handful of methods, including the one that will load external code, loadModule. A closer inspection of this method will show that a) it imports external code by pointing a browser's Document Object Model (DOM) script tag to the URL of the external code (“module”) and b) it registers the imported module in imagejs.module(URL). As is the rest of this section, this inspection is also provided as a webcast video, publicly available at http://www.youtube.com/watch?v=qbKBGb4EchE.
The features of the ImageJS environment as a vehicle to deliver computation were studied by developing and deploying an image analysis workflow that included standard modules for feature segmentation, analysis, and filtering. Each of these modules was configured not only to deliver a desirable image analysis functionality – and in the process test if the browser is a suitable platform to do so – but also to test different models of dependency between modules. The goal of testing different models of articulation between analytical modules is to explore the balance between flexibility and robustness of browser-based computational ecosystems as platforms for collaborative software development. The orchestration and dependencies between each module are described in Figure 2. Each module represents an independent development exercise, hosted and versioned in its own externally hosted service. As stated in the “Materials and Methods” section, to reinforce the perception of independent development, the multiple modules and ImageJS core code are scattered between distinct versioned hosting services, namely, GitHub and Google Code.
Figure 2.
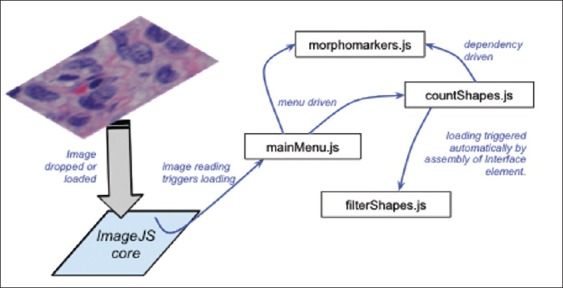
Examples of interface triggers for loading of modules illustrated in this section: menu driven, dependency driven, and programmatically associated with action by another module. The analytical workflow can therefore be assembled by loading modules in response to actions by the user or it can be initiated by a particular result of the analysis
Dissimilarity Metric
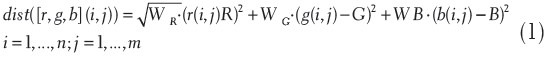
The image analysis procedure developed starts with the selection by the user of a chromomarker. A chromomarker, RGBmarker, is defined as the three-element vector with the intensities in the red, green, and blue channels that one uses to retrieve image features with similar chromometric characteristics. To this purpose, the user selects a pixel in the image, I, of size n × m as a marker, with [R,G,B] intensities, and sets a weighted threshold, T, for a dissimilarity metric, dist, that will be resolved for all pixels in the image, each with its own intensity values [r,g,b]:
Module Chromomarkers – Segmentation
The first module, chromomarkers, will segment all pixels in the image that are at a distance smaller than T.
segmentetPixelCoordinates =[i, j]|dist([r, g,b](i, j))< T (2)
Both operations, distance calculation (Equation 1) and segmentation (Equation 2), represent a first test of the browser as an efficient environment for image processing. The JavaScript engine of modern web browsers includes support for map and reduce operations, which we recently found to offer an efficient solution to the parallelization/vectorization of code execution in the context of sequence analysis.[12] For example, the n × m distance matrix, D, defined by Equation 1, can be resolved efficiently by nesting two map operations on the image RGB intensities, I:
D = I.map(function(x, i){return x.map(function(y, j){returnI[r, g,b](i, j)})}) (3)
The efficiency of this implementation in ImageJS relies on the JavaScript compiler mapping the explicit parallelization of the code to local opportunities for distribution. For example, by possibly using the machine's graphics processing units (GPUs).
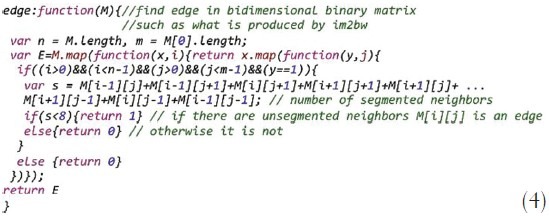
As can be verified by operating ImageJS (or by viewing the accompanying webcast at http://www.youtube.com/watch?v=qbKBGb4EchE), chromomarkers will display the edges of segmented image superimposed on the original image. The edge detection is performed by another mapping operation which is worth inspecting in the native JavaScript syntax to recognize the nested mapping pattern used in Equation 3, and is highlighted below in the code for Equation 4. This time, the nested mapping is being used to inspect the neighborhood of each pixel to find out if it corresponds to a segmented pixel with a non-segmented non-pixel, in which case it is classified as an edge:
Module Countshapes – Feature Extraction
As can be verified by using ImageJS or by viewing the accompanying webcast, the image segmentation operations are executed in real time (under 1 or 2 sec), on par with other image analysis environments. Feature extraction represents a tougher challenge. Here, the goal is to identify which sets of segmented pixels define a contiguous feature. This module's interface now separates (they are triggered by distinct events) feature analysis operations that can be performed in real time, such as the determination of segmentation density or the ratio between RGB intensities between segmented and non-segmented regions, from those that actually require the extraction of features, such as counting them. The implementation used has typical execution times of about 10 features extracted per second.
The description of this feature extraction procedure provides the opportunity to demonstrate how code can be invoked in a publication without concern that subsequent updates or renaming will cause this information not to be available. For example, at the time of this writing, the code for feature extraction can be found in line #171 of version 4ec7931d17ccc17d27e724d51ae0 of jmat.js, which can be “forever” available at http://code.google.com/p/jmat/source/browse/jmat.js?r=4ec7931d17ccc17d27e724d51ae0342b871bc98a#171. Following that link will not only return the code used, but also expose comments made by co-developers. It is again worth noting that although the ImageJS core is hosted and versioned at imagejs.github.com, this procedure happens to be hosted and versioned by a distinct environment, this time at Google. Both hosting services, which is to say, the hosting services resolved by the links, are likely to last longer (forever) than the interest or even the memory of its authors.
Modular Orchestration
The ability to simultaneously host versioned development and serve executable JavaScript code by exactly the same mechanism is a unique feature of the web environment. In the previous section, the feature extraction procedure was described by reference to the specific version and line of code deployment at the time of this writing. The ability to reference specific versions of the code therefore extends to the ability to execute them as well. This feature is enhanced by ImageJS by allowing the submission of modules by passing them as arguments to the URL call. For example, http://imagejs.github.com/?https://raw.github.com/imagejs/imagejs.github.com/27b596ed08d41e79c6c96e86f0318694ca98cc9e/mainMenu.js and http://module.imagejs.googlecode.com/git-history/ef105347cc13dcb24cdfae621522b5891ff11ab7/mathbiol.chromomarkers.js and http://module.imagejs.googlecode.com/git-history/ef105347cc13dcb24cdfae621522b5891ff11ab7/mathbiol.countshapes.js specifies a very particular combination of versions of the multiple modules involved in the assembly of ImageJS. This is of course not a convenient URL to exchange, so a shorter reference could be generated, for example, http://bit.ly/H3hvbz. It is worth repeating the note that none of the resources used to enable the assembly of a specific version of the ImageJS tool depends on the commitment of the authors of this report to maintain those resources.
The ImageJS computational environment will natively allow for three mechanisms to incorporate code generated by others. The easiest to distribute is to simply add the address of the modules to the URL of ImageJS core application, as illustrated above. A more interactive possibility is to use an input box as exemplified by the Main Menu/Load option. The third one is to associate links to DOM events such as mouse clicks. The filtering of segmented images offers an illustration of the usefulness of this mechanism in facilitating the interaction with researchers focused on the computational statistics aspects of the analysis. This module, mathbiol.filterShapes, is strictly dedicated to specifying a number of matrix manipulation procedures – erode and round at the time of this writing. The association of these procedures with the user interface buttons that trigger them is dealt by the feature extraction module. Adding a new filtering procedure to this object will automatically trigger the creation of the additional buttons. We found this style of module development to be particularly appealing to the biostatistics minded researcher because it does not require web programming skills beyond a basic understanding of JavaScript syntax, which is reminiscent of the C language.
In summary, the primary goal of the modules described in this report is to illustrate how the image analysis can be orchestrated to involve multiple contributions, with different dependencies, using different styles, different modes of interaction with the user, hosted in multiple locations, while delivering reproducible results available in the pervasive web browser platform. Figure 2 summarizes the orchestration of modules described here, highlighting the salient features and dependencies they were designed to illustrate.
Data Management
The conventional approach of manually loading images from the local file system, by file select or by drag and drop, is supported. Manually saving the image and its analysis results back to the files system is also supported and consists of saving the contents of imagejs.data [Figure 1] as a JSON structure. This behavior relies on a relatively new development in web computing standards, the File API (http://www.w3.org/TR/FileAPI).
Another possibility that is particularly useful in collaborative and distributed environments is to rely on the read-write capabilities anticipated for Web 3.0 Apps.[6,13] In a nutshell, this is a cloud computing option that treats web services as both remote storage and remote devices, allowing for exchange of data simply by reference. One of the modules, countShapes, illustrates this functionality by using the WebRW service described in the “Materials and Methods” section. This was adopted as a generic solution of reading and writing back to the web such that we would not have to choose among a slew of excellent commercial resources such as Dropbox.com, Amazon's S3, or Google's Fusion Tables, which would have required user authentication. Regardless of the web read-write cloud service chosen, the attraction of this option is that programmatically, the Web is closer to the web browser that to the browser's machine own file system [Figure 1]. Accordingly, the same module loading mechanism described in the previous sections will now be used to deal with and saving and loading of data. As an example, see either https://bitly.com/withData or point a QR reader to the QR code in Figure 3 http://bit.ly/withData.qrcode; both link to the same data with analysis, as depicted in Figures 3 and 4.
Figure 3.

Quick Response (QR) code, generated automatically by http://bit.ly/withData.qrcode for the link http://bit.ly/withData, which in turn points to http://imagejs.github.com/?http://module. imagejs.googlecode.com/git/ mathbiol.chromomarkers.js and http://module.imagejs.googlecode.com/git/ mathbiol.countshapes. js and http://165.225.128.64/?doc=UID5716226333752275 and http:// module.imagejs.googlecode.com/git/mathbiol.showdata.js, which corresponds to a particular image analysis result that is assembled, re-analyzed, reproducing the display depicted in Figure 4
Figure 4.
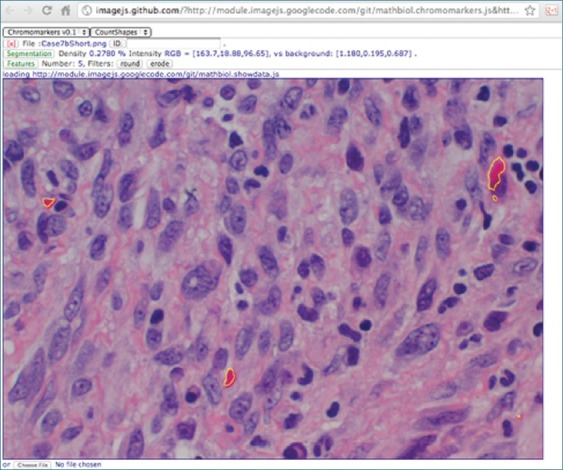
Image analysis corresponding to http://bit.ly/withData. See Figure 3 for equivalent QR code for optical reading by tablet devices
A Pathology Application: KI67 Labeling for Cellular Proliferation
The proposition that Image js0 is particularly adequate to the development of very specific image analysis applications was assessed by developing a new module to assist with the determination of cellular proliferation index from KI67-labeled transmission microscopy images. As proposed, this was pursued by building not only on top of the imagejs abstraction [Figure 1] but also integrated with one of the generic modules described earlier, Chromomarkers. As a consequence, this exercise was conveniently reduced to the writing of a few image analysis filters that rely on the Chromomarkers’ segmentation utilities to select segmentation thresholds. The KI67 index, a cellular proliferation index, is the ratio of nuclei undergoing division, often estimated from transmission microscopy images of tissue treated with a generic nuclear stain, such as Hematoxylin, and an antibody that targets KI67, a protein present only in the active stages of the cell cycle. To address the vagaries of manual estimation of proliferation from such images, the KI67 ImageJS module was designed to assist with the calculation and, more importantly, to report the final value with the graphic display of the corresponding segmentations. A snapshot of this application is presented in Figure 5, and can be invoked by a short link such as http://bit.ly/ki67js or http://uab.mathbiol.org/ki67 in a modern web browser, preferably Google Chrome.
Figure 5.
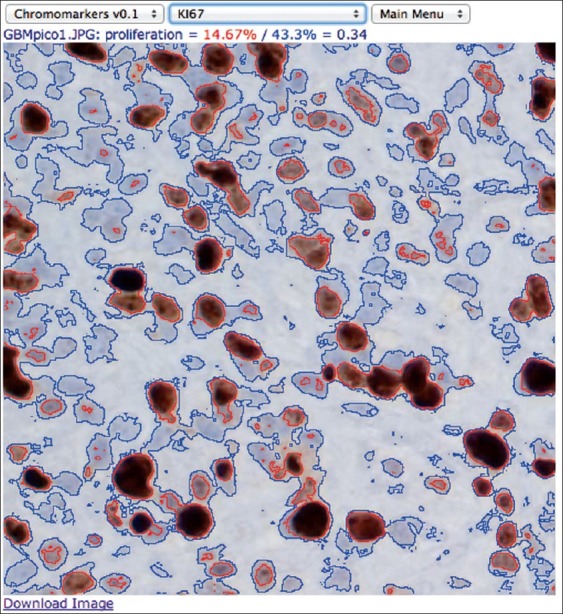
Snapshot of the result of using imagejs's KI67 module to determine proliferation index in a labeled Glioblastoma sample imaged by transmission microscopy. A webcast illustrating its usage is available at http://www.youtube.com/watch?v=NCPNgRxWWDQ and is also provided with the “Help” option of this ImageJS application
DISCUSSION
Because of the increasing volume and heterogeneity of data, the organic development of software that delivers computational solutions to translational environments is not only a challenge of increasing proportions, but also one with increasing rewards. Accordingly, advances in biomolecular methodology, coupled with the benefits of an integrated environment in which data science in a biomedical context may be applied, are increasingly seen as a key new frontier for Pathology.[14] The opportunity to develop encompassing integrative infrastructure for image analysis has not been missed by the research community, with very comprehensive initiatives such as OMERO[15] advancing open source software that Pathologists with access to Informatics Research resources and partnerships can use. The advantages of these partnerships are also increasingly compelling as the amount of annotated image data in the public domain increases. Furthermore, these are also increasingly object of large-scale modeling exercises such as the recent morphological analysis of The Cancer Genome Atlas (TCGA) slide images to identify classifiers of tumor subtypes.[16] These advances make the prospect of pushing image analysis to the Lab Medicine or to the point of care all the more enticing and the inability to do so all the more frustrating.
In principle, applications such as NIH ImageJ provide a good solution to the “last mile” problem of delivering computational solutions to the environments and machines that have access to the image data that need to be analyzed. The use of the Java language (the “J” in ImageJ) to deliver such a solution is in line with its 1990s motto of “write once, run anywhere.” It was then widely anticipated that this would be the language of the web and that not only would applications be delivered to the browser as Applets (http://java.sun.com/applets/) but also eventually the browser would mature to such a high level of integration with the Java language (it would have a native JVM) that even individual procedures would be delivered into a communal computational pool where an ecosystem of workflows might emerge in reaction to the data and user interaction context. In a nutshell, the web browser was, correctly, anticipated to become the ultimate SaaS platform endowed with efficient processors and with a protective sandbox such that the machine's own file system would not be exposed to the foreign code injection. This should allow for the promise of personalizing the analysis of an image in that private file system to benefit from the wealth of reference data being annotated elsewhere. In fact, this promise has since been delivered, not by object-oriented Java which still requires a virtual machine to be first loaded by the browser before being interpreted, but by its little functional helper, JavaScript, which went on to provide the basis for the second generation of web technologies a decade later.[6] Another key variation on the original prediction was the emergence of cloud computing infrastructure as a logical extension of the machine's file system. This is the modern scenario that the ImageJS prototype, described in the “Results” section, explores: we now have all the features needed for pervasive image analysis that we can port all the way to the point of care. Specifically, a) we have an efficient computational environment and b) we can deliver SaaS in a manner that is both safe and reproducible.
The Web Browser for Computational Efficient Image Analysis
The main argument for delivering image analysis using the browser's native interpreter is that it is the route best aligned with the sandboxed browser, and is therefore least likely to face objections by no download and installation policies in care delivery environments. Initially, it was not clear that this environment is sufficiently performant for image analysis. The World Wide Web consortium (W3C) has recognized the need for metrics for different computational operations, but has only recently standardized their acquisition.[17] We have also recently found out when functionally decomposing sequence analysis into MapReduce operations[12] that these improvements may actually justify rather than deter the use of the browser to deploy advanced computational statistics procedures. As described in the “Results” section and documented in the accompanying webcast, the ability to perform image segmentation using weighted Euclidean distance, edge detection, and then overlaying the edges on top of the original image, all in real time, suggest that a similar argument may be valid for image analysis. This argument will be on even more solid ground if efficiency refers to power consumption, since that is the very argument why web browsers in mobile devices are increasingly not supporting graphics rendering using Adobe's Flash, Microsoft's Silverlight, and Oracle-Sun's JVM.
Safe and Reproducible SaaS?
The argument that the browser offers a safer delivery of applications is the same that leads IT departments to disable the installation of applications by researchers and clinicians in biomedical facilities. There certainly are opportunities to make webApps unsafe, but the fact that they are executed within the browser's sandbox raises effective barriers to accessing the file system or devices attached to the machine where the webApp is being executed. The argument for a more reproducible delivery of image analysis solutions is also not an absolute claim. It reflects two facts. The first is that the script tag loading mechanism enables the use of hosted code versioning services for versioned application hosting, as illustrated in the results given in the section “Modular Orchestration.” The second reason for this claim is that scientific publication also relies on the web browser as the primary dissemination mechanism, which signifies that an image analysis result represented as a figure in a published manuscript can include a link to the data and its versioned analysis code such that the result is automatically reproduced by the machine of the reader. As illustrated in Figure 4, the reproduction in the client machine can even include the assembly of the analytical environment where alternative analysis can be attempted.
CONCLUSION
ImageJS provides a pervasive mechanism to deliver image analysis workflows and interactive interfaces to where the data are. Its architecture was specifically designed to promote the emergence of collaborative computational ecosystems. It includes a core Object Model equipped with data-specific attributes and methods, such as a module loader that registers the source URLs of the components loaded. The ability to define workflows by chaining the addresses of the modules with ImageJS's own is expected to be the most useful feature of this image analysis environment. The use of versioned code hosting as a mechanism for deployment is also a stark departure from conventional bioinformatics infrastructure, where the ensuing “code injection” is normally avoided rather than promoted. However compelling this mechanism for distributed development and deployment may be, and no matter how convenient and scalable the delivery of computation to image repositories may be, ImageJS webApp ecosystem is primarily an experiment in informatics. The ability to gather data about the population of this computational webApp ecosystem by others and about collaborative data processing to inform further development of distributed image analysis infrastructure may well be its most valuable purpose.
Footnotes
Available FREE in open access from: http://www.jpathinformatics.org/text.asp?2012/3/1/25/98813
REFERENCES
- 1.Rasband WS. Bethesda, Maryland, USA: ImageJ, U. S. National Institutes of Health; [Last cited on 1997-2011]. Available from: http://imagej.nih.gov/ij/ [Google Scholar]
- 2.Ferreira T, Rasband W. ImageJ user guide. Image processing and analysiva. ImageJ Community. 179. [Last accessed on 2010 Mar]. Available from: http://imagej.nih.gov/ij/dS IN JAocs/guide .
- 3.Tuominen VJ, Ruotoistenmäki S, Viitanen A, Jumppanen M, Isola J. ImmunoRatio: A publicly available web application for quantitative image analysis of estrogen receptor (ER), progesterone receptor (PR), and Ki-67. Breast Cancer Res. 2010;12:R56. doi: 10.1186/bcr2615. [DOI] [PMC free article] [PubMed] [Google Scholar]
- 4.Baggerly KA, Berry DA. Reproducible Research. AMSTAT News. [Last accessed on 2011 Jan]. pp. 16–7. Available from: http://magazine.amstat.org/wp-content/uploads/2011an/January2011.pdf .
- 5.Bastow R, Leonelli S. Sustainable digital infrastructure. Although databases and other online resources have become a central tool for biological research, their long-term support and maintenance is far from secure. EMBO Rep. 2010;11:730–4. doi: 10.1038/embor.2010.145. [DOI] [PMC free article] [PubMed] [Google Scholar]
- 6.Zhang Z, Cheung K-H, Townsend JP. Bringing Web 2.0 to bioinformatics. Brief Bioinform. 2009;10:1–10. doi: 10.1093/bib/bbn041. [DOI] [PMC free article] [PubMed] [Google Scholar]
- 7.Jasny BR, Chin G, Chong L, Vignieri S. Data replication & reproducibility. Again, and again, and again …. Introduction. Science. 2011;334:1225. doi: 10.1126/science.334.6060.1225. [DOI] [PubMed] [Google Scholar]
- 8.Peng RD. Reproducible research in computational science. Science. 2011;334:1226–7. doi: 10.1126/science.1213847. [DOI] [PMC free article] [PubMed] [Google Scholar]
- 9.Eysenbach G. Medicine 2.0: Social networking, collaboration, participation, apomediation, and openness. J Med Internet Res. 2008;10:e22. doi: 10.2196/jmir.1030. [DOI] [PMC free article] [PubMed] [Google Scholar]
- 10.Hoekstra R. The Knowledge Reengineering Bottleneck. Semantic Web. 2010;1:1–5. [Google Scholar]
- 11.Bell G, Hey T, Szalay A. Computer science. Beyond the data deluge. Science. 2009;323:1297–8. doi: 10.1126/science.1170411. [DOI] [PubMed] [Google Scholar]
- 12.Almeida JS, Grüneberg A, Maass W, Vinga S. Fractal MapReduce decomposition of sequence alignment. Algorithms Mol Biol. 2012;7:12. doi: 10.1186/1748-7188-7-12. (in press) [DOI] [PMC free article] [PubMed] [Google Scholar]
- 13.Hendler J. Web 3.0 Emerging. Computer. IEEE Computer Society. 2009;42:111–3. [Google Scholar]
- 14.Tonellato PJ, Crawford JM, Boguski MS, Saffitz JE. A national agenda for the future of pathology in personalized medicine: Report of the proceedings of a meeting at the Banbury Conference Center on genome-era pathology, precision diagnostics, and preemptive care: A stakeholder summit. Am J Clin Pathol. 2011;135:668–72. doi: 10.1309/AJCP9GDNLWB4GACI. [DOI] [PMC free article] [PubMed] [Google Scholar]
- 15.Allan C, Burel J-M, Moore J, Blackburn C, Linkert M, Loynton S, et al. OMERO: Flexible, model-driven data management for experimental biology. Nat Methods. 2012;9:245–53. doi: 10.1038/nmeth.1896. [DOI] [PMC free article] [PubMed] [Google Scholar]
- 16.Cooper LA, Kong J, Gutman DA, Wang F, Gao J, Appin C, et al. Integrated morphologic analysis for the identification and characterization of disease subtypes. J Am Med Inform Assoc. 2012;19:317–23. doi: 10.1136/amiajnl-2011-000700. [DOI] [PMC free article] [PubMed] [Google Scholar]
- 17.Jain A, Weber J. Web performance working group. 2011. [Last accessed on 2012 Apr 2]. Available from: http://www.w3.org/2011/04/webperf .