

Abstract
Rapid exchange of metabolites between different cell types is crucial for energy homeostasis of the brain. Besides glucose, lactate is a major metabolite in the brain and is primarily produced in astrocytes. In the present study, we report that carbonic anhydrase 2 (CAII) enhances both influx and efflux of lactate in mouse cerebellar astrocytes. The augmentation of lactate transport is independent of the enzyme's catalytic activity, but requires direct binding of CAII to the C-terminal of the monocarboxylate transporter MCT1, one of the major lactate/proton cotransporters in astrocytes and most tissues. By employing its intramolecular proton shuttle, CAII, bound to MCT1, can act as a ‘proton collecting antenna’ for the transporter, suppressing the formation of proton microdomains at the transporter-pore and thereby enhancing lactate flux. By this mechanism CAII could enhance transfer of lactate between astrocytes and neurons and thus provide the neurons with an increased supply of energy substrate.
Key points
Rapid exchange of metabolites like glucose and lactate between different cell types is crucial for energy supply to the brain.
Carbonic anhydrase 2 (CAII) enhances lactate transport in mouse cerebellar and cerebral astrocytes.
Enhancement of transport activity is independent of the enzyme's catalytic function, but requires binding of CAII to the C-terminal tail of the monocarboxylate transporter MCT1.
CAII could enhance lactate flux by acting as a ‘proton collecting antenna’ for MCT1.
By this mechanism CAII could enhance transfer of lactate between astrocytes and neurons and thus provide neurons with an increased supply of energy substrate.
Introduction
Besides glucose, monocarboxylates, such as lactate and pyruvate, appear to play an important, but not yet well understood role in brain energy metabolism. Monocarboxylates have been shown to be a substantial energy source for the developing brain (Hawkins et al. 1971; Dombrowski et al. 1989). Furthermore, significant utilization of monocarboxylates has been reported for different pathological states, such as diabetes, sustained starvation or hypoglycaemia (Gjedde & Crone, 1975; Fernandes et al. 1982; Hawkins et al. 1986). Lactate, either produced in the central nervous system (CNS) or taken up from the blood capillaries, can serve as an additional energy source even under normoxic conditions (Bouzier et al. 2000; Dalsgaard et al. 2004; Waniewski & Martin, 2004). However, the conditions under which lactate may become a significant energy substrate remain unresolved. In the brain, lactate is primarily produced by astrocytes, either from glucose or glycogen (Walz & Mukerji, 1988; Dringen et al. 1993; Wender et al. 2000). It has been proposed that lactate is shuttled from the astrocytes to neighbouring neurons to serve as energy substrate, the so-called ‘astrocyte–neuron lactate-shuttle’ hypothesis (Magistretti et al. 1999; Pellerin & Magistretti, 2003). Lactate and other monocarboxylates are transported across the cell membrane by monocarboxylate transporters (MCTs). The SLC16 family of MCTs is comprised of 14 members, the first four of which (MCT1–4) have been shown to transport monocarboxylates together with H+ in a 1:1 stoichiometry (Carpenter & Halestrap, 1994; Bröer et al. 1997, 1998). Transport has been shown to be mirror symmetric with ordered binding of lactate and H+ and freely reversible (De Bruijne et al. 1983; Galic et al. 2003). All MCTs have a classical 12 transmembrane-helix structure, with both the C- and N-terminus located intracellularly (Halestrap & Price, 1999). Trafficking, but also regulation, of transport activity of MCT1–4 is mediated by the ancillary proteins basigin (CD147) or embigin (gp70), which bind to the transporter (Wilson et al. 2005, 2009). In the rodent CNS, three MCT isoforms have been identified: MCT1 is predominantly expressed in endothelial cells of blood vessels and has been found to be the major isoform in astrocytes (Gerhart et al. 1997, 1998). The high-affinity transporter MCT2 is strongly expressed in neurons (Pierre et al. 2002; Debernardi et al. 2003), while expression of the low-affinity, high-capacity transporter MCT4 is restricted to astrocytes (Bergersen et al. 2002; Rafiki et al. 2003). Expression of MCTs in the CNS is highly regulated to adjust the supply of monocarboxylates to energy requirements, and changes in MCT activity have been found to be of particular importance for brain development and neuroenergetics, but also in CNS disorders such as ischaemia and neurodegenerative diseases (Cornford et al. 1982; Debernardi et al. 2003; Tseng et al. 2003; Pierre & Pellerin, 2005).
Since aerobic and anaerobic metabolism is always accompanied by the production of acid–base equivalents, energy metabolism is tightly linked to pH regulation. In the CNS, acid–base homeostasis is mainly governed by astrocytes, which express a variety of transporters and enzymes for this task (Deitmer, 2001). One family of enzymes that plays a particular role in pH regulation is that of carbonic anhydrases (CAs), which catalyse the reversible hydration of CO2 to H+ and HCO3−. Currently, 16 isoforms of α-CAs have been identified. Eight of these have been found in the CNS: isoforms CAII, VII, VIII, X, XI and XIII are located intracellularly, while CAIV is located extracellularly at the membrane of astrocytes and CAXIV has been predominantly localized to the surface of neurons (Parkkila et al. 2001; Svichar et al. 2006; Supuran, 2009). Interestingly, the two extracellular isoforms CAIV and CAXIV have been suggested to facilitate lactate transport in astrocytes and neurons (Svichar & Chesler, 2003). The catalytically most active isoform, CAII, is predominantly expressed in astrocytes (Ghandour et al. 1981). CAII has been shown to enhance the activity of various acid–base transporters like the chloride/bicarbonate exchanger AE1 (Vince & Reithmeier, 1998; McMurtrie et al. 2004), the sodium bicarbonate cotransporter NBCe1 (Pushkin et al. 2004; Becker & Deitmer, 2007), and the sodium/hydrogen exchanger NHE1 (Li et al. 2002), an interaction coined ‘transport metabolon’. By using heterologous protein expression in Xenopus oocytes, we could show that CAII enhances transport activity of MCT1 and MCT4, but not of MCT2 (Becker et al. 2005, 2010; Klier et al. 2011). In contrast to other transport metabolons described so far, the interaction between MCT and CAII does not depend on catalytic activity of CAII, but requires the enzyme's intramolecular H+ shuttle with the residue H64 playing a central role (Becker & Deitmer, 2008; Becker et al. 2011). In the present study we tested whether CAII can also facilitate MCT activity in astrocytes. Our data indicate that CAII indeed increases MCT transport activity, both in astrocyte culture and in acute cerebellar slices, independent of the enzyme's catalytic function. In addition, CAII does not only co-localize with MCT1 in astrocytes, but directly binds to the transporter, mediated by a cluster of three glutamate residues in the C-terminal of MCT. Since the CAII-mediated increase in MCT activity depends on the enzyme's intramolecular H+ shuttle (Becker et al. 2011), we conclude that CAII, directly bound to MCT1, can act as a ‘proton collecting antenna’ for the carrier to ensure adequate rates of lactate transport into, and presumably more often, out of glial cells, as energy supply to neurons.
Methods
Ethical approval
All the procedures involving animals were approved by the Landesuntersuchungsamt Rheinland-Pfalz, Koblenz (23 177-07). The authors have read, and the experiments comply with, the policies and regulations of The Journal of Physiology given by Drummond (2009).
Preparation of mouse cerebellar slices for in situ measurements
Brain slices were prepared from four adult B6.D2-Car2n/J (CAII knockout) mice and three of their wild-type litter mates, at postnatal days (P) 28 to 35, using a modified version of the procedure described by Edwards et al. (1989). Mice were decapitated and the vermis region of the cerebellum was removed and placed into a chilled Ca2+-reduced artificial cerebrospinal fluid (aCSF) containing (mm): 125 NaCl, 2.5 KCl, 2.5 MgCl2, 0.5 CaCl2, 25 glucose, 1.25 NaH2PO4 and 25 NaHCO3, aerated with 5% CO2. Sagittal slices 250 μm thick were cut on a vibratome and incubated for 45 min at 30°C and between 30 min and 4 h at room temperature before dye loading. The B6.D2-Car2n/J mouse strain displays a nonsense or missense mutation in the Car2 locus on chromosome 3 which was introduced by N-ethyl-N-nitrosourea mutagenesis (Lewis et al. 1988).
Measurement of pHiin situ
An individual slice was loaded with 1 μm of the acetoxymethyl ester of 2′,7′-biscarboxyethyl-5,6-carboxy fluorescein (BCECF-AM; Molecular Probes, OR, USA) dissolved in Ca2+-reduced aCSF for 30 min. The slice was mounted in a perfusion chamber of an upright microscope (BX50WI; Olympus, Japan) equipped with an epifluorescence unit (Polychrome IV; Till Photonics, Germany). While the slice was perfused with standard aCSF containing (mm): 125 NaCl, 2.5 KCl, 1 MgCl2, 2 CaCl2, 25 glucose, 1.25 NaH2PO4 and 25 NaHCO3, aerated with 5% CO2, BCECF was excited for 5 ms in an interval of 5 s, at a wavelength of 440 nm followed by 490 nm. The 535 nm fluorescence emission (F) of the two wavelengths was monitored through a 40 ×/0.8 w (water immersion) objective with a peltier cooled CCD camera (Till Photonics). The emission strength at 490 nm is inverted proportional to [H+] while the emission strength at 440 nm remains constant during pH changes, which allows to achieve a pure [H+]-dependent signal by calculating the ratio F440/F490.
The 10 mm l-lactate solution contained only 115 mm NaCl to maintain osmolarity. The solution without CO2/HCO3− was buffered with 10 mm Hepes instead (titrated to pH 7.4) and NaCl was increased to 145 mm to maintain osmolarity. All measurements were carried out at room temperature.
Preparation of mouse primary astrocyte cultures
Primary cultures of astrocytes were prepared from whole cerebrum of neonatal NMRI mice (P0–P2). In brief, the mice were decapitated and the cerebrum was moved to a Petri dish containing ice-cold preparation solution containing (in mm): 120 NaCl, 5.4 KCl, 0.8 MgCl2, 25 Tris-HCl and 15 d-glucose. The meninges were carefully removed and the cells were dissociated by 0.25% trypsin. The trypsination was stopped by 10% fetal calf serum in Eagle's basal medium. The tissue was further disrupted by pipetting up and down several times using a glass Pasteur pipette. After centrifugation, the cells were treated with DNAse and were then centrifugated once more. The cell pellet was resuspended in Dulbecco's modified essential medium supplemented with penicillin 100 units/ml, streptomycin 0,1 mg/ml, 17 mm NaHCO3 and 10% horse serum. The cells were grown at 35°C in a humidified growth chamber in an atmosphere containing 5% CO2. The cultures contained >95% GFAP-positive cells and were used when they reached confluency, usually after 14–19 days in culture. For the experiments presented in this paper a total number of 36 mice was used.
siRNA mediated knock-down of carbonic anhydrase II in primary astrocyte cultures
Downregulation of the CAII expression was achieved by the siRNA technique as described earlier (Kozlova & Takenaga, 2005). The astrocytes were transiently transfected using ON-TARGETplus SMARTpool siRNA against mouse CAII (Thermo Scientific Dharmacon, CO, USA). ON-TARGET plus non-targeting pool (Thermo Scientific Dharmacon) was used as negative control. The astrocytes were grown in 35 mm culture dishes to confluency (14–19 days in vitro). Transfection was initiated by incubating the cultures with OptiMEM (Invitrogen, CA, USA) for 30 min. CAII ON-TARGETplus SMARTpool siRNA or ON-TARGET plus non-targeting pool (100 nm each, final concentration) was mixed with Lipofectamine 2000 (Invitrogen) in OptiMEM and incubated for 20 min prior to addition to the astrocytes (final volume 1 ml). After 5 h, the transfection mixture was replaced with OptiMEM containing 20% fetal calf serum and the astrocytes were incubated for 24 h. The cultures were thereafter incubated in normal growth medium for another 48 h before being subjected to the lactate uptake assay. The efficiency of the knock-down was evaluated by Western blot using antibodies against CAII (α-CAII, Chemicon, dilution 1:500). The optical densities of the CAII blot were correlated to the densities of β-tubulin (α-β-tubulin, Sigma, dilution 1:1000).
Assay for uptake of 14C-labelled lactate in astrocyte culture
To evaluate lactate uptake, primary astrocyte cultures were grown to confluency and were then subjected to incubations with 14C-labelled lactate. At first the cells were rinsed twice with lactate-free Hepes buffer (pH 7.0, 150 mm NaCl, 2.5 mm KCl, 1.25 mm NaH2PO4, 5 mm glucose, 1 mm MgCl2, 2 mm CaCl2, 10 mm NaHCO3, 5 mm Hepes, aerated with 5% CO2) and were incubated for 5 min. Then the cells were incubated with 14C-labelled lactate (0.5 μCi ml−1; Amersham Biosciences, Braunschweig, Germany) in a CO2-aerated Hepes buffer (pH 7.0) containing 5 mm l-lactate, 147.5 mm NaCl, 2.5 mm KCl, 1.25 mm NaH2PO4, 5 mm glucose, 1 mm MgCl2, 2 mm CaCl2, 10 mm NaHCO3 and 5 mm Hepes for different time intervals. After each incubation time period, the cells were washed three times with ice-cold buffer and were homogenized in 2% SDS. The amount of radioactive lactate uptake was determined by liquid scintillation counting. The resulting values (with the control value of incubations at 4°C subtracted) were normalized to total protein content measured using the bichionic acid (BCA) assay (Pierce).
Determination of CA catalytic activity via mass spectrometry
Catalytic activity of CA in cultured astrocytes was determined by monitoring the 18O depletion of doubly labelled 13C18O2 through several hydration and dehydration steps of CO2 and HCO3− (Sültemeyer et al. 1990; Silverman, 1982) in buffer solution. Experiments were carried out at a temperature of 23°C. The reaction sequence of 18O loss from 13C18O18O (mass-to-charge ratio, m/z = 49) over the intermediate product 13C18O16O (m/z = 47) and the end product 13C16O16O (m/z = 45) was monitored with a quadrupole mass spectrometer (OmniStar GSD 320; Pfeiffer Vaccum, Asslar, Germany). The relative 18O enrichment was calculated from the measured 45, 47 and 49 abundance, as a function of time according to: log enrichment = log [49 × 100/(49 + 47 + 45)]. For the calculation of the CA activity of the sample, the rate of 18O degradation was obtained from the linear slope of the log enrichment over the time, using the spreadsheet analysing software OriginPro 7. The rate was compared with the corresponding rate of the non-catalysed reaction. Enzyme activity in units (U) was calculated from these two values as defined by Badger & Price (1989). From this definition, one unit corresponds to 100% stimulation of the non-catalysed 18O depletion of doubly labelled 13C18O2. Afterwards the values were normalized to total protein content measured using the bichionic acid (BCA) assay (Pierce).
For the experiments, the cuvette was filled with 6 ml of saline (pH 7.0, 150 mm NaCl, 2.5 mm KCl, 1.25 mm NaH2PO4, 5 mm glucose, 1 mm MgCl2, 2 mm CaCl2, 10 mm NaHCO3 and 5 mm Hepes) and the non-catalysed reaction was measured for 3 min. One batch of astrocytes was lysed by sonication immediately before the experiment; 20 μl were removed for protein determination and the lysate was added to the solution.
Immunocytochemistry
Astrocytes, growing on poly-d-lysine-coated glass coverslips, were rinsed twice in phosphate-buffered saline and were fixed in 4% paraformaldehyde for 15 min. Goat serum (0.1%) and bovine serum albumin (3%) was used as blocking agent before antibody incubation. Primary antibodies (α-CAII, Chemicon, dilution 1:500, α-CAIV, Santa Cruz, dilution 1:500, α-MCT-1, Millipore, dilution 1:500) were incubated at 4°C overnight. Secondary antibodies (AlexaFlour 488 and 564, Invitrogen) were added at a concentration of 1:1000 and the cells were incubated for 1 h. The nuclei were stained using Hoechst stain during the second incubation. Micrographs were taken using a Zeiss LSM 700 laser scanning microscope, equipped with a Zeiss W N-Achroplan 40×/0.75 M27 objective, and Zen software (Carl Zeiss).
Proximity ligation assay
The proximity ligation assay was carried out using the Duolink in situ Proximity Ligation Assay (Olink Bioscience, Uppsala, Sweden) as described by the manufacturer and by Söderberg et al. (2008). In short, astrocytes growing on glass coverslips were fixed in 4% paraformaldehyde solution for 15 min. Blocking and primary antibody incubation was carried out as described in the immunocytochemistry section. The primary antibodies used were α-CAII (dilution 1:250, Santa Cruz), α-MCT1 with the epitope in the C-terminal (dilution 1:250, Millipore) and α-MCT1 directed against the intracellular loop between TM6 and TM7 (dilution 1:250) The antibody, directed against the intracellular loop between TM 6 and TM 7 of MCT1, was produced by Open Biosystems (Thermo Fisher Scientific) using an artificial peptide with the protein sequence KGEKLSVFQTVNKFLD, a homolog to the amino acids 232–247 in rat MCT1. The sequence differs by one amino acid from the corresponding sequence of mouse MCT1 (KGEKLSVFQTINKFLD). The peptide was conjugated to keyhole limpet haemocyanin as carrier protein. Two New Zealand white rabbits were immunized with the peptide and the produced antibody was affinity purified.
Cells incubated without primary antibodies were used as procedure controls. The resulting staining was visualized using a Zeiss Examiner D1 laser scanning microscope, equipped with a Zeiss W N-Achroplan 40×/0.75 M27 objective, and Zen software. The images were analysed and the PLA signal was quantified with ImageJ software.
Co-immunoprecipitation of GST–fusion proteins with CAII
For the co-immunoprecipitation (Co-IP), GST–fusion proteins of the MCT1 C-terminal (N437–V494 and N437–S484, respectively), as well as fusion proteins of the MCT1 C-terminal, containing single site mutations were created. The C-terminal of rat MCT1 was cloned into the multiple cloning site of the expression vector pGEX-2T (GE Healthcare Europe GmbH, Freiburg, Germany) using the restriction enzymes BamHI and EcoRI. The plasmid was transformed into E. coli BL21. Protein expression was induced by addition of 1 mm isopropyl-β-d-thiogalactopyranosid, 5 h prior to harvesting of bacteria. GST–fusion protein was purified using glutathione-coated agarose beads (Protino Glutathione Agarose 4B; Machery-Nagel GmbH & Co. KG, Düren, Germany) and quality of the protein was checked by Western blotting. The protein was stored in 50 mm Tris buffer, pH 8.0 at −32°C until further use.
Co-IP was carried out using the Pierce crosslink immunoprecipitation kit (Pierce): 10 μg of anti-human CAII antibody (rabbit anti-carbonic anhydrase II (human erythrocytes) polyclonal antibody, AB1828, Millipore) was immobilized to Protein A/G-coated agarose beads using the crosslinker disuccinimidyl suberate as described in the manufacture's protocol. Afterwards the immobilized antibody was incubated for 1.5 h with 750 μg of bovine CAII (C3934, Sigma-Aldrich Chemie GmbH, Germany), dissolved in 450 μl of IP lysis/wash buffer (25 mm Tris, 150 mm NaCl, 1 mm EDTA, 1% NP-40, 5% glycerol; pH 7.4). Excess CAII was removed and 77 nmol of GST and GST-MCT1-CT, respectively, dissolved in 450 μl of 50 mm Tris-HCl (pH 8.0) were added to the beads. After 1.5 h of incubation at room temperature, the beads were washed as described in the manufacture's protocol and protein was eluted from the beads with 50 μl of elution buffer (pH 2.8). To determine the relative amount of GST and GST-MCT1-CT bound to CAII, an equal volume of the two samples was analysed by Western blotting. GST was detected using a primary anti-GST antibody (dilution 1:1000 anti-GST Tag mouse monoclonal IgG, no. 05-782, Millipore) and a goat anti-mouse IgG horseradish peroxidase-conjugated secondary antibody (dilution 1:4000; Santa Cruz). Membranes were analysed after incubation with Lumi-Light Western blotting substrate (Roche) with a Versa Doc imaging system (Bio-Rad Laboratories GmbH, Munich, Germany). Quantification of GST was carried out with the software Quantity One 4.5 (Bio-Rad). For each protein band, the pixel density per square millimeter was calculated and background pixel density subtracted. To compare the relative amount of bound GST-MCT1-CT with GST, the pixel density of the band for GST was set to 100% and the density of the band for GST-MCT1-CT normalized to the intensity of the band for GST in every individual blot. As a control experiment, the Co-IP was also carried out vice versa with GST or GST–fusion protein coupled to the beads and free CAII.
Single site mutation of MCT1
Truncation of MCT1 as well as site-directed mutagenesis within the C-terminal of the transporter was carried out by PCR using a mix of Taq and Pfu polymerases (High Fidelity PCR Enzyme Mix, Fermentas GmbH, St Leon-Rot, Germany) and modified primers, which contained the desired mutation. Primers used for creation of the different mutants are shown in Table 1.
Table 1.
Primers used for the generation of MCT1 mutants
| Mutant | Primer sequence |
|---|---|
| MCT1-K447X | GTG GCC AAA GAA CAG TAA GCG GAG GAA AAG |
| MCT1-K485X | CTG CAG AAC AGC TCT TGA GAC CCC GCG GAG G |
| MCT1-D486N | CCA GCG CCA CTG CAG AAC AGC TCT GGA AAC CCC GCG |
| MCT1-E489Q | GC TCT GGA GAC CCC GCG CAG GAG GAG AGC CCA G |
| MCT1-E490Q | GGA GAC CCC GCG GAG CAG GAG AGC CCA GTC TG |
| MCT1-E491Q | GAC CCC GCG GAG GAG CAG AGC CCA GTC TGA C |
| MCT1-E489Q/E490Q | GGA GAC CCC GCG CAG CAG GAG AGC CCA GTC TG |
| MCT1-E490Q/E491Q | GAC CCC GCG GAG CAG CAG AGC CCA GTC TGA C |
| MCT1-E489Q/E490Q/E491Q | GAC CCC GCG CAG CAG CAG AGC CCA GTC TGA C |
Shown are the sense primers for single site mutation of MCT1. Nucleotides that differ from the wild type sequence are embolded.
Rat MCT1 cloned in the oocyte expression vector pGEM-He-Juel, kindly provided by Dr Stefan Bröer, Canberra (Bröer et al. 1997), was used as template. PCR was cleaned up using the Invitek MSB Spin PCRapace cleanup kit (Invitek GmbH, Berlin, Germany) and the template was digested with DpnI (FastDigest DpnI, Feremtas) before transformation into E.coli XL1-blue cells.
Heterologous protein expression in Xenopus oocytes
Plasmid DNA of MCT1-WT and mutants, cloned into the oocyte expression vector pGEM-He-Juel, which contains the 5′ and the 3′ untranscribed regions of the Xenopusβ-globin flanking the multiple cloning site, was used. DNA was linearized with SalI and transcribed in vitro with T7 RNA-polymerase (mMessage mMachine, Ambion Inc., USA) as described earlier (Becker et al. 2004). Xenopus laevis females were purchased from Xenopus Express (Vernassal, France). Segments of ovarian lobules were surgically removed under sterile conditions from frogs anaesthetized with 1 g l−1 of 3-amino-benzoic acid ethylester (MS-222, Sigma-Aldrich, Taufkirchen, Germany), and rendered hypothermic. For the experiments six frogs were used. Afterwards the oocytes were dispersed by collagenase (Collagenase A, Roche, Mannheim, Germany) treatment and stored overnight in oocyte saline (in mm: 82.5 NaCl, 2.5 KCl, 1 CaCl2, 1 MgCl2, 1 Na2HPO4 and 5 Hepes) at 18°C to recover. Oocytes at stages V and VI were injected with 5 ng of cRNA coding for MCT1-WT or one of the MCT1 mutants 3 to 6 days before the experiment using a microinjection system (WPI Nanoliter 2000, World Precision Instruments Germany GmbH, Berlin, Germany). Bovine CAII protein (C3934, Sigma-Aldrich) was injected at a concentration of 50 ng per oocyte 1 day before measurement.
Measurement of intracellular H+ concentration in Xenopus oocytes
All measurements were carried out in Hepes-buffered solution (in mm: 82.5 NaCl, 2.5 KCl, 1 CaCl2, 1 MgCl2, 1 Na2HPO4 and 5 Hepes). In lactate-containing saline, NaCl was replaced by an equivalent amount of sodium-l-lactate. Application of lactate was always carried out in Hepes-buffered solution at pH 7.0, in the nominal absence of CO2/HCO3−, containing around 0.008 mm of CO2 from air and hence a HCO3− concentration of less than 0.2 mm. To check for CAII catalytic activity, a short CO2 pulse was applied. For this solution, NaCl was replaced by 10 mm NaHCO3 and the solution was aerated with 5% CO2–95% O2.
For measurement of intracellular H+ concentration and membrane potential, double-barrelled microelectrodes were used; the manufacture and application have been described in detail previously (Deitmer, 1991). Briefly, two borosilicate glass capillaries of 1.0 and 1.5 mm in diameter were twisted together and pulled to a micropipette. The ion-selective barrel was silanized with a drop of 5% tri-N-butylchlorsilane in 99.9% pure carbon tetrachloride, backfilled into the tip. The micropipette was baked for 4.5 min at 450°C on a hot plate. H+-sensitive cocktail (Fluka 95291, Sigma-Aldrich) was backfilled into the tip of the silanized ion-selective barrel and filled up with 0.1 m sodium citrate, pH 6.0. The reference barrel was filled with 3 m KCl. To increase the opening of the electrode tip, it was bevelled with a jet stream of aluminium powder suspended in H2O. Calibration of the electrodes was carried out in oocyte salines with a pH of 7.0 and 6.4. As described previously (Bröer et al. 1998), optimal pH changes were detected when the electrode was located near the inner surface of the plasma membrane. During all measurements, oocytes were clamped to a holding potential of −40 mV using an additional microelectrode, filled with 3 m KCl and connected to an Axoclamp 2B amplifier (Axon Instruments, USA). All experiments were carried out at room temperature (22–25°C). The measurements were stored digitally using custom-made PC software based on the program LabView (National Instruments Germany GmbH, München, Germany). The rate of change of the measured [H+]i was analysed by determining the slope of a linear regression fitted using OriginPro 7 (OriginLab Corporation, Northampten, USA).
Structural model of the interaction between MCT1 and CAII
The last nine amino acids of the MCT1 C-terminal (D486-PAEEESPV) were modelled as an extended β-strand and manually docked into a surface accessible groove with the previously determined crystal structure of CAII (PDB accession no. 2ILI) (Fisher et al. 2007), with the C-terminal residue of MCT1 (V494) residing in the hydrophobic pocket of the enzyme's active site. The MCT1-CT–CAII modelling was performed using the interactive software COOT (Emsley & Cowtan, 2004) and then energy minimizing using the program CNS (Brunger et al. 1998). The MCT1-CT–CAII complex interactions were then analysed using the online tool PDBePISA (http://www.ebi.ac.uk/msd-srv/prot_int/pistart.html).
Calculation and statistics
Statistical values are presented as means ± standard error of the mean (SEM). For calculation of significance in differences, Student's t test or, if possible, a paired t test was used. In the figures shown, significance levels are: *P ≤ 0.05, **P ≤ 0.01 and ***P ≤ 0.001.
Results
Carbonic anhydrase enhances lactate-induced proton flux in mouse cerebellar astrocytes
Lactate-induced proton flux in astrocytes was measured by bath application of lactate to BCECF-loaded cerebellar slices of CAII−/− and CAII+/+ mice. Bergmann glia were identified by their unipolar shape and position. Application of 10 mm lactate induced an intracellular acidification in the cells, the rate of which was reduced to about 50% in cells of CAII−/− mice as compared with their CAII+/+ litter mates (Fig. 1A and B). However, blocking CA catalytic activity by application of 10 μm 6-ethoxy-1,3-benzothiazole-2-sulfonamide (EZA) had no influence on the rate of lactate-induced acidification, suggesting that augmentation of lactate-induced acid–base flux by CAII is facilitated by a mechanism that is independent of the enzyme's catalytic activity. The rate of intracellular alkalization, produced by withdrawal of lactate, was also reduced to 50% in cells of CAII−/− mice as compared with CAII+/+ animals, indicating that lactate influx and efflux are affected similarly by CA (Fig. 1C). Efficiency of EZA was tested by determination of the rate of intracellular alkalization during withdrawal of CO2/HCO3− (Fig. 1D). In CAII+/+ animals, EZA reduced the rate of alkalization by 50%, while the rate in CA−/− mice was reduced by only 30% to a value that was not significantly different to the rate measured in CAII+/+ mice in the presence of EZA (Fig. 1E). Since there is no CAII expressed in CAII−/− mice, the 30% reduction of the rate of alkalization in the presence of EZA can be attributed to other CA isoforms in the cells. Quantitative Western blotting revealed no significant differences in the expression levels of MCT1 and MCT4 in the cerebellar vermis of CAII−/− and CAII+/+ mice (Fig. 2A and B). Therefore, the decrease in the rate of lactate-induced acidification in the astrocytes of CAII−/− mice cannot be attributable to a reduction of transport protein expression in the CAII−/− mice, but to a reduction in lactate transport rate.
Figure 1. CAII enhances lactate-induced acid–base flux in mouse cerebellar astrocytes in a non-catalytic manner.

A, original recordings of lactate-induced acid–base flux, as measured by the change in fluorescence ratio, in Bergmann glia cells in the cerebellar cortex of WT (CAII+/+) and CAII-KO (CAII−/−) mice before and during application of 10 μm EZA. B and C, acid–base flux, as measured by the rate of change in fluorescence ratio, induced by application (B) and withdrawal (C) of 10 mm lactate before and during application of 10 μm EZA in WT and CAII-KO mice. D, original recordings and E, statistical analysis of the intracellular alkalization induced by withdrawal of CO2/HCO3− before and during application of 10 μm EZA in WT and CAII-KO mice. All values are depicted as mean ± SEM. **P ≤ 0.01, ***P ≤ 0.001; n.s., non-significant (Student's t test).
Figure 2. Quantification of CAII, MCT1 and MCT4 in the cerebellum of CAII+/+ and CAII−/− mice by Western blot analysis.

A, representative Western blots of cerebellar vermis of CAII−/− and CAII+/+ mice labelled against CAII, MCT1 and MCT4, and β-tubulin as loading control. B, relative intensity of the chemiluminescence signal of CAII, MCT1 and MCT4, normalized to the signal for CAII+/+ mice. Data from 3 (MCT1) and 2 (CAII, MCT4) Western blots, each with 8 probes of the cerebellar vermis, produced from the two hemispheres of 2 CAII−/− and 2 CAII+/+ mice (12 (MCT1) and 8 (CAII, MCT4) bands, respectively, from either 2 CAII+/+ or 2 CAII−/− mice). All values are depicted as mean ± SEM. ***P ≤ 0.001; n.s., non-significant (Student's t test).
Lactate flux in cultured astrocytes is enhanced by carbonic anhydrase in a non-catalytic manner
To confirm that the CAII-mediated increase in the rate of lactate-induced acidification is due to an increase in lactate/proton cotransport, uptake of 14C-labelled lactate was measured in cultured mouse astrocytes, which were either transfected with siRNA against CAII, or mock-transfected as control. To create an inwardly directed lactate gradient, cells were incubated in lactate-free solution for 10 min before 5 mm of unlabelled and 0.5 μCi of 14C-labelled lactate were added. Uptake was stopped at different times by addition of ice-cold saline, and the amount of 14C-labelled lactate within the cell was determined by liquid scintillation counting. Knock-down of CAII induced a significant reduction in lactate uptake as compared with mock-transfected cells (Fig. 3A). Blocking CA catalytic activity by pre-incubation of the cells in 30 μm EZA, however, had no effect on lactate flux (Fig. 3B). Knock-down of CAII was confirmed by quantitative Western blotting (Fig. 3C): transfection of astrocytes with siRNA resulted in a knock-down of CAII to 5 ± 2%, while expression of MCT1, MCT4 and β-tubulin (loading control) did not show significant changes. Functional knock-down of CA activity by siRNA was investigated by mass spectrometric measurement of the degradation of labelled CO2 (Fig. 3D): transfection with siRNA decreased the overall CA activity of astrocyte lysate to 50%, while pre-incubation of a lysate of native astrocytes with 30 μm EZA reduced CA activity to 22% (Fig. 3E).
Figure 3. Knock-down of CAII, but not inhibition of CA catalytic activity reduces lactate flux in astrocytes.
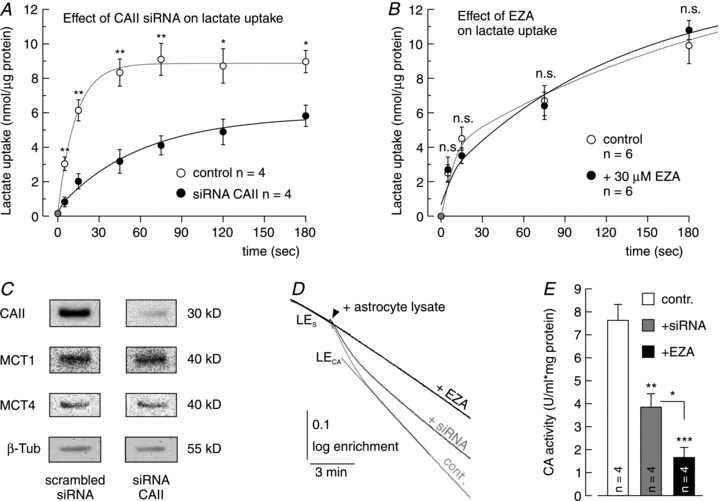
A, lactate flux, as measured by the uptake of 14C-labelled lactate into cultured mouse astrocytes, either transfected with siRNA against CAII or just treated with scrambled siRNA as control, over different time points. B, lactate flux, as measured by the uptake of 14C-labelled lactate into cultured mouse astrocytes, in the absence and in the presence of 30 μm EZA. C, representative Western blots of CAII, MCT1, MCT4 and β-tubulin in mouse astrocytes, treated either with scrambled siRNA as control or with siRNA against CAII. D, recording of the log enrichment of either a lysate of native astrocytes before (light grey trace) and after addition of 30 μm EZA (black) or a lysate of astrocytes treated with siRNA against CAII (dark grey trace). The beginning of the traces shows the rate of degradation of the 18O-labelled substrate in the non-catalysed reaction; the black arrow indicates the addition of astrocyte lysate. The dotted lines indicate the linear fits from which the spontaneous (LES) and the catalysed degradation of the 18O-labelled substrate (LECA) is calculated. E, enzymatic activity of CA in units ml−1 (mg protein)−1, at extracellular pH of 7.1, in native astrocytes, before and after addition of 30 μm EZA and in astrocytes treated with siRNA against CAII. All values are depicted as mean ± SEM. **P ≤ 0.01, ***P ≤ 0.001; n.s., non-significant (Student's t test).
Carbonic anhydrase binds to the C-terminal of MCT1
CAII enhances lactate flux in astrocytes in a non-catalytic manner. This phenomenon suggests a direct interaction between CAII and the glial monocarboxylate transporters. Antibody staining of MCT1 and CAII revealed a homogenous distribution of both proteins within the cell (Fig. 4A–C). An in situ proximity ligation assay (PLA) indicated close proximity (<30 nm) between MCT1 and CAII in astrocytes when an antibody directed against the intracellular loop between TM 6 and 7 of MCT1 was used (Fig. 4D). However, when the PLA was carried out using an antibody against the C-terminal of MCT1, no proximity between MCT1 and CAII could be detected (Fig. 4E), suggesting that the interaction between MCT1 and CAII is blocked by binding of the antibody to the MCT1 C-terminal tail. As a negative control, a PLA without primary antibodies was carried out (Fig. 4F). The PLAs were quantified, showing 22.5 ± 2.8 signals per nucleus when the antibody against the loop was used, while the antibody against the C-terminal only produced 1.5 ± 0.2 signals per nucleus, not significantly different from the negative control with 0.8 ± 0.2 signals per nucleus (Fig. 4H). Specificity of the antibodies used for the antibody staining and the PLA was checked by Western blot analysis (Fig. 4I and J). All three antibodies produced a sharp band at the appropriate size of their target protein. The antibody directed against the intracellular loop of MCT1 produced two additional sharp bands below 30 kD which could be interpreted as degradation products of MCT1. Furthermore, a PLA was carried out, using the two antibodies against MCT1 at the same time (Fig. 4G), which indicates that both antibodies bind to MCT1 in the cell. These data give rise to the assumption that the interaction between MCT1 and CAII is mediated via the C-terminal of MCT1, which is blocked by binding of an antibody directed against this structure.
Figure 4. MCT1 and CAII are colocalized in astrocytes.

A–C, antibody staining of MCT1 (A) and CAII (B) in cultured mouse astrocytes. C, overlay of the fluorescence signals for MCT1 (green), CAII (red) and the nuclei marker Hoechst (blue). D–G, in situ proximity ligation assay of MCT1 and CAII in mouse astrocyte culture. D, in situ PLA using an anti-CAII antibody and an antibody directed against the intracellular loop between TM6 and TM7 in MCT1. The red dots indicate colocalization of MCT1 and CAII. E, in situ PLA using an anti-CAII antibody and an antibody directed against the C-terminal of MCT1. F, negative control of an in situ PLA without primary antibodies. G, in situ PLA using both the antibody directed against the intracellular loop between TM6 and TM7 and against the C-terminal of MCT1. H, quantification of the PLA signals, shown as signals per nucleus. All values are depicted as mean ± SEM. ***P ≤ 0.001; n.s., non-significant (Student's t test). I, representative Western blots of mouse cultured astrocytes (25 μg protein per lane), stained against MCT1 with antibodies mapping against the C-terminal and the intracellular loop between TM 6 and TM7, respectively. Both antibodies produced a clear band at 40 kD – the size of the MCT1. The antibody against the intracellular loop produced two additional bands between 25 kD and 30 kD, which could be degradation products of MCT1. J, representative Western blot of mouse cerebellar vermis (25 μg protein per lane), stained against CAII with the antibody used for immunohistochemistry. The antibody produced a clear band at 30 kD – the size of CAII.
To check for a possible binding between CAII and the MCT1 C-terminal, a GST fusion protein of the C-terminal (N437–V494) was created and co-immunoprecipitated with CAII coupled to agarose beads via an antibody. After the Co-IP, the amount of precipitated GST–fusion protein (GST–CT) and GST (control), was determined by quantitative Western blotting using an anti-GST antibody (Fig. 5A): quantification of the Western blots showed an increase in the signal to 501 ± 67% (P ≤ 0.01) when the GST–fusion protein was co-immunoprecipitated with CAII as compared with GST, indicating a 5-fold higher affinity of GST–CT for CAII than GST alone (Fig. 5B). As control, 3 pmol of GST and GST–CT were blotted (Fig. 5C): the blot showed a single sharp band both for GST and GST–CT. Furthermore the band for GST had a 56 ± 11% (P ≤ 0.05; n = 11) higher intensity than the band for the same amount of GST–CT. Therefore, the binding affinity of CAII to the MCT1–CT would more likely be underestimated than overestimated by the Co-IP. As additional control, free CAII was co-immunoprecipitated with GST and the GST–fusion protein, respectively, bound to the beads (Fig. 5D and E). In this set of experiments, CAII also showed a significantly increased affinity to GST–CT than to GST. Taken together, the results strongly suggest that CAII is able to bind to MCT1 in glial cells.
Figure 5. CAII binds to the C-terminal of MCT1.

A, representative Western blot of GST and a GST–fusion protein of the C-terminal of MCT1 (GST–CT), co-immunoprecipitated with CAII coupled to agarose beads via an antibody against CAII. B, relative intensity of the fluorescent signal of GST–CT, normalized to GST (6 Western blots from 2 batches of protein). C, representative Western blot of GST and a fusion protein from GST and the C-terminal tail of MCT1, stained against GST. D, representative Western blot and E, statistical analysis of a co-immunoprecipitation with free CAII and GST–fusion proteins coupled to agarose beads, stained against CAII. All values are depicted as mean ± SEM. *P ≤ 0.05, **P ≤ 0.01; n.s., non-significant (Student's t test).
CAII-induced increase in MCT1 transport activity is mediated by an acidic cluster of three glutamate residues in the C-terminal of the MCT1
The Cl−/HCO3− anion exchanger AE1 has been shown to bind to CAII via an acidic cluster (D887-ADD) within its C-terminal (Vince & Reithmeier, 2000). In the C-terminal of MCT1 several acidic clusters can be found (Fig. 6C). To elucidate which of these clusters may mediate the interaction between MCT1 and CAII truncation, mutants of MCT1, either missing the last 10 (MCT1-G485X) or the last 49 (MCT1-K447X) amino acids, respectively, were created and heterologously expressed in Xenopus oocytes. Transport activity of the mutants and MCT1-WT was determined by measurement of the rate of change in intracellular H+ concentration during application of 3 and 10 mm lactate in oocytes either injected with 50 ng of CAII or H2O (control) (Fig. 6A). While injection of CAII doubled the rate of lactate-induced acidification in MCT1-WT-expressing cells, no effect of CAII on transport activity could be detected in either mutant, suggesting that an interaction between MCT1 and CAII would be mediated via a cluster within the last 10 amino acids of MCT1. This assumption is supported by the fact that a Co-IP of CAII and a GST–fusion protein of the truncated C-terminal tail of MCT1 (GST–CT-G485X) shows no significant increase in affinity of CAII to the truncated C-terminal, as compared with GST alone (Fig. 5D and E).
Figure 6. Interaction between MCT1 and CAII is mediated via a cluster of three glutamate residues in the C-terminal of MCT1.

A, rate of rise in intracellular H+ concentration during application of 3 and 10 mm lactate in Xenopus oocytes expressing MCT1-WT, MCT1-G485X and MCT1-K447X, either injected with 50 ng of CAII or H2O as control. The asterisks above the bars with CAII refer to the corresponding values without CAII. The inset shows original recordings of intracellular H+ concentration in MCT1-expressing oocytes, either injected with 50 ng CAII (black trace) or H2O (grey trace). B, rate of rise in intracellular H+ concentration during application of 3 and 10 mm lactate in Xenopus oocytes expressing MCT1-WT and MCT1 mutants with different single site mutations in the C-terminal, either injected with 50 ng of CAII or H2O as control. The asterisks above the bars with CAII refer to the corresponding values without CAII. All values are depicted as mean ± SEM. *P ≤ 0.05, **P ≤ 0.01, ***P ≤ 0.001; n.s., non-significant (Student's t test). C, protein sequence of MCT1 C-terminal (modified from Rahman et al. 1999). The truncation sites are labelled by a dash, the single site mutations are shown in black.
To further identify the binding site, we performed single site mutations of the acidic cluster D486-PAEEE, by exchanging acidic by neutral residues before expression in oocytes (Figs 6B and 7). Mutation of the C-terminal did not alter transport activity of the MCT1 itself. Both the rate and the amplitude of the lactate-induced acidification remained unchanged in the mutants as compared with wild-type MCT1 as long as no CAII was injected (Figs 6B and 7C). However, mutation of one of the two glutamate residues E489 and E491 either alone or in combination with other amino acids, abolished the interaction between MCT1 and CAII, while exchange of D486 to N and E490 to Q had no effect on the CAII-induced increase in MCT1 activity (Fig. 6B). The CAII-induced increase in MCT1 activity affected the rate of alkalization during withdrawal of lactate to a similar extent as it increased acidification during application of lactate, showing that lactate efflux was similarly increased by CA as lactate influx (Fig. 7B). Catalytic activity of CAII injected into the oocytes was checked by application of 5% CO2/10 mm HCO3−, resulting in a ∼6.5-fold increase in the rate of CO2-induced acidification as compared with oocytes not injected with CAII (Fig. 7D). The physiological data are confirmed by Co-IP of CAII and GST–fusion proteins of the MCT1 C-terminal tail containing the single site mutations E489Q, E490Q and E491Q, respectively (Fig. 5E): mutation of E490 showed no reducing effect on the binding between the C-terminal and CAII, while mutation of E489 and E491, respectively, induced a reduction in the binding capacity, similar to the truncation of the C-terminal (G485X).
Figure 7. Physiological characterization of the interaction between MCT1 mutants and CAII.

A, representative original recording of intracellular H+ concentration of MCT1-WT-expressing Xenopus oocytes either injected with 50 ng of CAII (black trace) or H2O as control (grey trace), during application of 3 and 10 mm lactate and 5% CO2/10 mm HCO3−. B, rate of fall in intracellular H+ concentration during withdrawal of 3 and 10 mm lactate in Xenopus oocytes expressing MCT1-WT, MCT1-E489Q/E490Q (E489/90Q), MCT1-E489Q/E490Q/E491Q (E489-91Q) and MCT1-E490Q/E491Q (E490/91Q), either injected with 50 ng of CAII or H2O. C, amplitude of the lactate-induced acidification in Xenopus oocytes expressing MCT1-WT or a mutant of MCT1, either injected with 50 ng of CAII or H2O. D, rate of rise in intracellular H+ concentration during application and withdrawal of 5% CO2/10 mm HCO3− in Xenopus oocytes expressing MCT1-WT or a mutant of MCT1, either injected with 50 ng of CAII or H2O. The asterisks above the bars with CAII refer to the corresponding values without CAII. All values are depicted as mean ± SEM. *P ≤ 0.05, **P ≤ 0.01, ***P ≤ 0.001; n.s., non-significant (Student's t test).
To gain insights into the structure of the interaction between the C-terminal of MCT1 and CAII, a structural model was created of CAII and a peptide representing the last nine amino acids of the MCT1 C-terminal (Fig. 8). Figure 8A provides an overview over the whole structure: the MCT1-CT (yellow ribbon) fits well into the surface groove of CAII (ochre surface) and exhibits several possible interaction sites with the enzyme at different positions along the surface. The hydrophobic side chain of MCT1-V494 sits in the hydrophobic pocket of CAII formed by F131, I91 and V121. The side chains of E489 and E491 of MCT1-CT point towards the CAII interface within hydrogen bond distance from H64 (orange surface) of the enzyme. In contrast, E490 of MCT1-CT points outward to the bulk solvent and is therefore not involved in any interaction with CAII. Further structural analysis of the complex showed that 540 Å2 (41.8%) of surface area of MCT1-CT is buried at the interface with CAII. Figure 8B shows the direct interaction between MCT1-E489 and -E491 and CAII-H64; all three residues have been shown to be crucial for the CAII-induced increase in MCT1 activity (E489, E491: this study; H64: Becker et al. 2011). Both E489 and E491 can form a hydrogen bond with H64 in the ‘out’ configuration, while E490 in between would not interact with any residue in CAII.
Figure 8. Schematic model of the interaction between MCT1 and CAII.
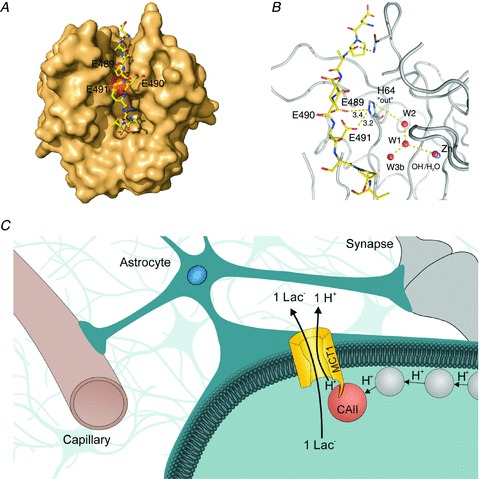
A, structural model of CAII (ochre surface representation) and the last 9 amino acids from the C-terminal of MCT1 (yellow ribbon). B, close-up of the model structure shown in A. The model shows hydrogen bonds between the residues E489 and E491 of MCT1 with the residue H64 of CAII in the ‘out’ confirmation. In contrast to that, E490, the mutation of which does not impair interaction with CAII, does not interact with any residue of the CAII. C, schematic model of the interaction between MCT1 and CAII in astrocytes: CAII, directly bound to the C-terminal of MCT1 can collect protons from surrounding buffer molecules (grey circles) near the membrane surface and shuttle them to the transporter. Thereby CAII can form a ‘proton-collecting antenna’ for the MCT1 to ensure adequate rates of lactate transport in glial cells.
Discussion
Lactate has been found to be a valuable energy source that can be transferred between different cell types within the brain. In the present study we have investigated the influence of carbonic anhydrase on lactate transport in mouse cerebellar and white matter astrocytes. Our data revealed that CAII, the most abundant isoform in the brain, can enhance lactate transport in astrocytes. Interestingly, this augmentation of transport activity does not depend on CAII catalytic activity, since a complete block of intracellular CA activity – confirmed by the change in rate of rise during withdrawal of CO2 in BCECF-loaded astrocytes – had no effect on lactate-induced acid–base flux.
The catalytic pathway of CA is split into two distinct stages: the interconversion of CO2 and HCO3−, followed by the transfer of H+ from the catalytic centre to the bulk solution to regenerate the zinc-bound hydroxide (Tu et al. 1989). In CAII, the H+ transfer between the zinc-bound water and the bulk solution is facilitated by the site chain of H64, which shuttles H+ between the bulk solvent and a network of well-ordered water molecules in the active site cavity of the enzyme (Fisher et al. 2007). We have recently shown, that the side chain of H64 is essential for the CAII-mediated increase in MCT activity, since replacing H64 by alanine leads to the loss of functional interaction between MCT1 (and MCT4) and CAII-H64A, when heterologously expressed in Xenopus oocytes (Becker et al. 2011). However, injection of the H+-donor 4-methylimadozole (4-MI) into MCT + CAII-H64A-coexpressing oocytes can restore the ability of CAII-H64A to enhance transport activity of MCT. This effect can be attributed to the replacement of the missing imidazole ring in CAII-H64A by 4-MI, which π-stacks to W5 in CAII, bringing the imidazole ring close to the position of H64 in wild-type CAII (Becker et al. 2011). These observations suggest that CAII might facilitate an intramolecular H+ pathway with H64 as a central part, to shuttle H+ from or to the transporter pore of the MCT. Therefore H+ shuttling in CAII not only plays a crucial role in the enzyme's catalytic activity, but might enable CAII to exchange H+ directly with other proteins. In fact, it has been shown previously that protonatable residues with a maximum distance of 1–1.5 nm could form proton-attractive domains and could share the proton at a very fast rate, exceeding the upper limit of diffusion-controlled reactions (Gutman et al. 2006). When these residues are located in proteins or lipid head groups at the plasma membrane, they can collect protons from the solution and ‘funnel’ them to the entrance of a proton-transfer pathway of a membrane-anchored protein, a phenomenon termed ‘H+-collecting antenna’ (Ädelroth & Brzezinski, 2004; Bränden et al. 2006). The need for such an antenna has been proposed for H+ cotransporters such as MCT1, whose substrate is present at very low concentrations, since these transporters would extract molecules from the cytosol at rates well above the capacity for simple diffusion to replenish their immediate vicinity (Martínez et al. 2010). Therefore, the transporter must exchange H+ with protonatable sites present in membrane proteins and lipids at the plasma membrane, located in sufficient proximity to the transporter pore to act as a ‘H+-collecting antenna’ for the transporter (Martínez et al. 2010).
In astrocytes, MCT1 and CAII are located in close proximity, as shown by in situ PLA. CAII may, therefore, act as a H+-collecting antenna for MCT1 in astrocytes, which mediates the exchange of H+ between the transporter pore and protonatable residues near the astrocyte inner plasma membrane. The observation that the PLA only gave a signal when an antibody directed against the intracellular loop between TM 6 and TM 7 of MCT1 was used, but not with an antibody against the C-terminal, suggests a direct interaction between CAII and the C-terminal of MCT1. Indeed, the Co-IP demonstrated a binding between CAII and the C-terminal of MCT1, which was abolished when the last 10 amino acids of the C-terminal were removed. Binding of CAII to an acid–base transporting membrane protein has previously been shown for the Cl−/HCO3− exchanger AE1, where binding of CAII is mediated by the acidic cluster D887-ADD in the C-terminal of AE1 (Vince & Reithmeier, 2000). For MCT1, we identified the acidic cluster E489EE, which is conserved in mouse, rat and human, as crucial for both binding and functional interaction between MCT1 and CAII. Structural modelling showed that the last 10 amino acids of the MCT1 C-terminal fit into the surface groove of CAII, in line with a physical binding between the two proteins. Furthermore, our structural model shows that the side chains of E489 and E491 can form a hydrogen bond with CAII-H64, the central part of the enzymes H+ shuttle. Therefore, it appears possible that the C-terminal of MCT1 does not only bind CAII to bring the enzyme close enough to the transporter pore, but could also be directly involved in the transfer of H+ between MCT1 and CAII (Fig. 8C).
It has previously been shown that lactate can be either imported into or exported from astrocytes, dependent on the lactate gradient (Simpson et al. 2007). In line with this we showed that both in cerebellar astrocytes and Xenopus oocytes CAII increases transport activity of MCT1 in both directions. A body of evidence suggests that neurons can use astrocyte-derived lactate as an additional fuel to glucose and that this astrocyte–neuron lactate shuttle may be coupled to neuronal activity (Magistretti et al. 1993; Fray et al. 1996; Bouzier-Sore et al. 2003; Pellerin, 2010; Wyss et al. 2011). Furthermore, it has recently been shown that lactate derived from breakdown of glycogen is of fundamental importance for long-term memory formation. In the hippocampus of rats, inhibition of glial glycogenolysis and lactate export, as well as import of lactate into neurons, all lead to impairment of long-term potentiation in hippocampal neurons, and to amnesia in rats (Suzuki et al. 2011). Neuronal activity leads to the release of K+, neurotransmitter and CO2 and is accompanied by extracellular pH shifts. The size and spread of this shift are influenced by (astro)glial cells (Deitmer & Szatkowski, 1990; Rose & Deitmer, 1994; Grichtchenko & Chesler, 1994). Extracellular pH shifts are shaped by the activity of the glial Na+/HCO3− cotransporter (NBC) and extracellular CAIV, but also depend on the transport function of acid–base-coupled metabolite transporters like the MCTs (Rose & Deitmer, 1994; Bevensee et al. 1997; Erlichman et al. 2008; Tong et al. 2000). pHi of glial cells and extracellular pH have also been shown to be influenced by neuronal activity (Grichtchenko & Chesler, 1994; Rose & Deitmer, 1995). With its direct influence on MCT transport activity, CAII has the potential of linking glial lactate secretion to changes in extracellular and cytosolic pH and thereby to changes in neuronal activity.
While the experiments presented in this study provide clear evidence that intracellular CAII can increase lactate transport in astrocytes in a non-catalytic manner, the impact of extracellular CA isoforms on lactate transport remains obscure. It has been reported previously (Svichar & Chesler, 2003) that blocking extracellular carbonic anhydrases by application of the membrane-impermeable inhibitor benzolamide completely abolished lactate-induced acidification in rat astrocyte cultures. However, in our experiments, blocking of both extra- and intracellular CAs by EZA did not seem to have any effect on lactate transport, suggesting no influence of extracellular CA activity on lactate transport in mouse astrocytes. The experiments in the two studies are performed under similar conditions, with the exception that the study of Svichar & Chesler (2003) was performed on astrocytes from rats instead of mice. Therefore, species-dependent differences both in protein expression levels and in the microenvironment at the cell surface, including the H+ buffer capacity, that may influence H+ depletion at the membrane, are conceivable. Furthermore, the acid shifts induced by 20 mm lactate in cultured rat astrocytes in the study of Svichar & Chesler (2003) seem to be larger than the shifts in the present study, and would therefore tend to deplete surface H+. The facilitation of lactate influx by a surface carbonic anhydrase is expected to depend critically on the rate of surface H+ depletion. A slow enough rate of influx would not benefit measurably from surface carbonic anhydrase, owing to local diffusion of buffer, local buffer capacity and the uncatalysed hydration of CO2. Any influence of extracellular CA activity on lactate flux may have not been detected in this study, possibly due to higher intra- and/or extracellular H+ buffer capacity. These differences might explain the discrepancies between the two studies. The role of extracellular CA for lactate transport, however, requires further experimental analysis.
Acknowledgments
The work was funded by the Deutsche Forschungsgemeinschaft to J.W.D. (DE 231/24-1), the Landesschwerpunkt Membrantransport (to H.M.B. and J.W.D.) and the Stiftung Rheinland-Pfalz für Innovation to H.M.B.
Glossary
Abbreviations
- 4-MI
4-methylimidazole
- aCSF
artificial cerebrospinal fluid
- AE1
anion exchanger isoform 1
- BCA
bichionic acid
- CA
carbonic anhydrase
- Car2
carbonic anhydrase II coding gene
- CD147
cluster of differentiation 147
- Co-IP
co-immunoprecipitation
- EAAT
excitatory amino acid transporter
- GFAP
glial fibrillary acidic protein
- GST
glutathione S-transferase
- gp70
glycoprotein 70
- MCT
monocarboxylate transporter
- m/z
mass-to-charge ratio
- NBCe1
electrogenic sodium bicarbonate cotransporter isoform 1
- NHE1
sodium/hydrogen exchanger isoform 1
- PDB
protein data bank
- PLA
proximity ligation assay
Author contributions
M.H.S., M.D.A., J.W.D. and H.M.B. designed the experiments; M.H.S., M.D.A., S.W., H.H. and H.M.B. performed and analysed the experiments; M.A. and R.M. generated the structural model; M.H.S., J.W.D. and H.M.B. wrote the paper; B.R., U.S. and G.W. contributed the knockout mice. All authors approved the final version.
References
- Ädelroth P, Brzezinski P. Surface-mediated proton-transfer reactions in membrane-bound proteins. Biochim Biophys Acta. 2004;1655:102–115. doi: 10.1016/j.bbabio.2003.10.018. [DOI] [PubMed] [Google Scholar]
- Badger MR, Price GD. Carbonic anhydrase activity associated with the cyanobacterium Synechococcus PCC7942. Plant Physiol. 1989;89:51–60. doi: 10.1104/pp.89.1.51. [DOI] [PMC free article] [PubMed] [Google Scholar]
- Becker HM, Bröer S, Deitmer JW. Facilitated lactate transport by MCT1 when coexpressed with the sodium bicarbonate cotransporter (NBC) in Xenopus oocytes. Biophys J. 2004;86:235–247. doi: 10.1016/S0006-3495(04)74099-0. [DOI] [PMC free article] [PubMed] [Google Scholar]
- Becker HM, Deitmer JW. Carbonic anhydrase II increases the activity of the human electrogenic Na+/HCO3− cotransporter. J Biol Chem. 2007;282:13508–13521. doi: 10.1074/jbc.M700066200. [DOI] [PubMed] [Google Scholar]
- Becker HM, Deitmer JW. Nonenzymatic proton handling by carbonic anhydrase II during H+-lactate cotransport via monocarboxylate transporter 1. J Biol Chem. 2008;283:21655–21667. doi: 10.1074/jbc.M802134200. [DOI] [PubMed] [Google Scholar]
- Becker HM, Fecher-Trost C, Hirnet D, Sültemeyer D, Deitmer JW. Transport activity of MCT1 expressed in Xenopus oocytes is increased by interaction with carbonic anhydrase. J Biol Chem. 2005;280:39882–39889. doi: 10.1074/jbc.M503081200. [DOI] [PubMed] [Google Scholar]
- Becker HM, Klier M, Deitmer JW. Nonenzymatic augmentation of lactate transport via monocarboxylate transporter isoform 4 by carbonic anhydrase II. J Membr Biol. 2010;234:125–135. doi: 10.1007/s00232-010-9240-y. [DOI] [PubMed] [Google Scholar]
- Becker HM, Klier M, Schüler C, McKenna R, Deitmer JW. Intramolecular proton shuttle supports not only catalytic but also noncatalytic function of carbonic anhydrase II. Proc Natl Acad Sci U S A. 2011;108:3071–3076. doi: 10.1073/pnas.1014293108. [DOI] [PMC free article] [PubMed] [Google Scholar]
- Bergersen L, Rafiki A, Ottersen OP. Immunogold cytochemistry identifies specialized membrane domains for monocarboxylate transport in the central nervous system. Neurochem Res. 2002;27:89–96. doi: 10.1023/a:1014806723147. [DOI] [PubMed] [Google Scholar]
- Bevensee MO, Apkon M, Boron WF. Intracellular pH regulation in cultured astrocytes from rat hippocampus. II. Electrogenic Na/HCO3 cotransport. J Gen Physiol. 1997;110:467–483. doi: 10.1085/jgp.110.4.467. [DOI] [PMC free article] [PubMed] [Google Scholar]
- Bouzier AK, Thiaudiere E, Biran M, Rouland R, Canioni P, Merle M. The metabolism of [3-13C]lactate in the rat brain is specific of a pyruvate carboxylase-deprived compartment. J Neurochem. 2000;75:480–486. doi: 10.1046/j.1471-4159.2000.0750480.x. [DOI] [PubMed] [Google Scholar]
- Bouzier-Sore AK, Voisin P, Canionik P, Magistretti PJ, Pellerin L. Lactate is a preferential oxidative energy substrate over glucose for neurons in culture. J Cereb Blood Flow Metab. 2003;23:1298–1306. doi: 10.1097/01.WCB.0000091761.61714.25. [DOI] [PubMed] [Google Scholar]
- Bränden M, Sanden T, Brzezinski P, Widengren J. Localized proton microcircuits at the biological membrane-water interface. Proc Natl Acad Sci U S A. 2006;103:19766–19770. doi: 10.1073/pnas.0605909103. [DOI] [PMC free article] [PubMed] [Google Scholar]
- Bröer S, Rahman B, Pellegri G, Pellerin L, Martin JL, Verleysdonk S, Hamprecht B, Magistretti PJ. Comparison of lactate transport in astroglial cells and monocarboxylate transporter 1 (MCT 1) expressing Xenopus laevis oocytes. Expression of two different monocarboxylate transporters in astroglial cells and neurons. J Biol Chem. 1997;272:30096–30102. doi: 10.1074/jbc.272.48.30096. [DOI] [PubMed] [Google Scholar]
- Bröer S, Schneider HP, Bröer A, Rahman B, Hamprecht B, Deitmer JW. Characterization of the monocarboxylate transporter 1 expressed in Xenopus laevis oocytes by changes in cytosolic pH. Biochem J. 1998;333:167–174. doi: 10.1042/bj3330167. [DOI] [PMC free article] [PubMed] [Google Scholar]
- Brunger AT, Adams PD, Clore GM, Gros P, Grosse-Kunstleve RW, Jiang JS, Kuszewski J, Nilges N, Pannu NS, Read RJ, Rice LM, Simonson T, Warren GL. Crystallography & NMR System (CNS), a new software suite for macromolecular structure determination. Acta Cryst. 1998;54:905–921. doi: 10.1107/s0907444998003254. [DOI] [PubMed] [Google Scholar]
- Carpenter L, Halestrap AP. The kinetics, substrate and inhibitor specificity of the lactate transporter of Ehrlich-Lettre tumour cells studied with the intracellular pH indicator BCECF. Biochem J. 1994;304:751–760. doi: 10.1042/bj3040751. [DOI] [PMC free article] [PubMed] [Google Scholar]
- Cornford EM, Braun LD, Oldendorf WH. Developmental modulations of blood-brain barrier permeability as an indicator of changing nutritional requirements in the brain. Pediatr Res. 1982;16:324–328. doi: 10.1203/00006450-198204000-00017. [DOI] [PubMed] [Google Scholar]
- Dalsgaard MK, Quistorff B, Danielsen ER, Selmer C, Vogelsang T, Secher NH. A reduced cerebral metabolic ratio in exercise reflects metabolism and not accumulation of lactate within the human brain. J Physiol. 2004;554:571–578. doi: 10.1113/jphysiol.2003.055053. [DOI] [PMC free article] [PubMed] [Google Scholar]
- De Bruijne AW, Vreeburg H, Van Steveninck J. Kinetic analysis of L-lactate transport in human erythrocytes via the monocarboxylate-specific carrier system. Biochim Biophys Acta. 1983;732:562–568. doi: 10.1016/0005-2736(83)90232-8. [DOI] [PubMed] [Google Scholar]
- Debernardi R, Pierre K, Lengacher S, Magistretti PJ, Pellerin L. Cell-specific expression pattern of monocarboxylate transporters in astrocytes and neurons observed in different mouse brain cortical cell cultures. J Neurosci Res. 2003;73:141–155. doi: 10.1002/jnr.10660. [DOI] [PubMed] [Google Scholar]
- Deitmer JW. Electrogenic sodium-dependent bicarbonate secretion by glial cells of the leech central nervous system. J Gen Physiol. 1991;98:637–655. doi: 10.1085/jgp.98.3.637. [DOI] [PMC free article] [PubMed] [Google Scholar]
- Deitmer JW. Strategies for metabolic exchange between glial cells and neurons. Respir Physiol. 2001;129:71–81. doi: 10.1016/s0034-5687(01)00283-3. [DOI] [PubMed] [Google Scholar]
- Deitmer JW, Szatkowski M. Membrane potential dependence of intracellular pH regulation by identified glial cells in the leech central nervous system. J Physiol. 1990;421:617–631. doi: 10.1113/jphysiol.1990.sp017965. [DOI] [PMC free article] [PubMed] [Google Scholar]
- Dombrowski GJJ, Swiatek KR, Chao KL. Lactate, 3-hydroxybutyrate, and glucose as substrates for the early postnatal rat brain. Neurochem Res. 1989;14:667–675. doi: 10.1007/BF00964877. [DOI] [PubMed] [Google Scholar]
- Dringen R, Schmoll D, Cesar M, Hamprecht B. Incorporation of radioactivity from [14C]lactate into the glycogen of cultured mouse astroglial cells. Evidence for gluconeogenesis in brain cells. Biol Chem Hoppe Seyler. 1993;374:343–347. doi: 10.1515/bchm3.1993.374.1-6.343. [DOI] [PubMed] [Google Scholar]
- Drummond GB. Reporting ethical matters in The Journal of Physiology: standards and advice. J Physiol. 2009;15:713–719. doi: 10.1113/jphysiol.2008.167387. [DOI] [PMC free article] [PubMed] [Google Scholar]
- Edwards FA, Konnerth A, Sakmann B, Takahashi T. A thin slice preparation for patch clamp recordings from neurones of the mammalian central nervous system. Pflugers Arch. 1989;414:600–612. doi: 10.1007/BF00580998. [DOI] [PubMed] [Google Scholar]
- Emsley P, Cowtan K. Coot: model-building tools for molecular graphics. Acta Cryst. 2004;60:2126–2132. doi: 10.1107/S0907444904019158. [DOI] [PubMed] [Google Scholar]
- Erlichman JS, Hewitt A, Damon TL, Hart M, Kurascz J, Li A, Leiter JC. Inhibition of monocarboxylate transporter 2 in the retrotrapezoid nucleus in rats: a test of the astrocyte-neuron lactate-shuttle hypothesis. J Neurosci. 2008;28:4888–4896. doi: 10.1523/JNEUROSCI.5430-07.2008. [DOI] [PMC free article] [PubMed] [Google Scholar]
- Fernandes J, Berger R, Smit GP. Lactate as energy source for brain in glucose-6-phosphatase deficient child. Lancet. 1982;1:113. doi: 10.1016/s0140-6736(82)90257-4. [DOI] [PubMed] [Google Scholar]
- Fisher SZ, Maupin CM, Budayova-Spano M, Govindasamy L, Tu C, Agbandje-McKenna M, Silverman DN, Voth GA, McKenna R. Atomic crystal and molecular dynamics simulation structures of human carbonic anhydrase II: insights into the proton transfer mechanism. Biochemistry. 2007;46:2930–2937. doi: 10.1021/bi062066y. [DOI] [PubMed] [Google Scholar]
- Fray AE, Forsyth RJ, Boutelle MG, Fillenz M. The mechanisms controlling physiologically stimulated changes in rat brain glucose and lactate: a microdialysis study. J Physiol. 1996;496:49–57. doi: 10.1113/jphysiol.1996.sp021664. [DOI] [PMC free article] [PubMed] [Google Scholar]
- Galic S, Schneider HP, Bröer A, Deitmer JW, Bröer S. The loop between helix 4 and helix 5 in the monocarboxylate transporter MCT1 is important for substrate selection and protein stability. Biochem J. 2003;376:413–422. doi: 10.1042/BJ20030799. [DOI] [PMC free article] [PubMed] [Google Scholar]
- Gerhart DZ, Enerson BE, Zhdankina OY, Leino RL, Drewes LR. Expression of monocarboxylate transporter MCT1 by brain endothelium and glia in adult and suckling rats. Am J Physiol. 1997;273:207–213. doi: 10.1152/ajpendo.1997.273.1.E207. [DOI] [PubMed] [Google Scholar]
- Gerhart DZ, Enerson BE, Zhdankina OY, Leino RL, Drewes LR. Expression of the monocarboxylate transporter MCT2 by rat brain glia. Glia. 1998;22:272–281. [PubMed] [Google Scholar]
- Ghandour MS, Derer P, Labourdette G, Delaunoy JP, Langley OK. Glial cell markers in the reeler mutant mouse: a biochemical and immunohistological study. J Neurochem. 1981;36:195–200. doi: 10.1111/j.1471-4159.1981.tb02395.x. [DOI] [PubMed] [Google Scholar]
- Gjedde A, Crone C. Induction processes in blood-brain transfer of ketone bodies during starvation. Am J Physiol. 1975;229:1165–1169. doi: 10.1152/ajplegacy.1975.229.5.1165. [DOI] [PubMed] [Google Scholar]
- Grichtchenko II, Chesler M. Depolarization-induced acid secretion in gliotic hippocampal slices. Neuroscience. 1994;62:1057–1070. doi: 10.1016/0306-4522(94)90343-3. [DOI] [PubMed] [Google Scholar]
- Gutman M, Nachliel E, Friedman R. The dynamics of proton transfer between adjacent sites. Photochem Photobiol Sci. 2006;5:531–537. doi: 10.1039/b515887g. [DOI] [PubMed] [Google Scholar]
- Halestrap AP, Price NT. The proton-linked monocarboxylate transporter (MCT) family: structure, function and regulation. Biochem J. 1999;343:281–299. [PMC free article] [PubMed] [Google Scholar]
- Hawkins RA, Mans AM, Davis DW. Regional ketone body utilization by rat brain in starvation and diabetes. Am J Physiol. 1986;250:169–178. doi: 10.1152/ajpendo.1986.250.2.E169. [DOI] [PubMed] [Google Scholar]
- Hawkins RA, Williamson DH, Krebs HA. Ketone-body utilization by adult and suckling rat brain in vivo. Biochem J. 1971;122:13–18. doi: 10.1042/bj1220013. [DOI] [PMC free article] [PubMed] [Google Scholar]
- Klier M, Schüler C, Halestrap AP, Sly WS, Deitmer JW, Becker HM. Transport activity of the high-affinity monocarboxylate transporter MCT2 is enhanced by extracellular carbonic anhydrase IV but not by intracellular carbonic anhydrase II. J Biol Chem. 2011;286:27781–27791. doi: 10.1074/jbc.M111.255331. [DOI] [PMC free article] [PubMed] [Google Scholar]
- Kozlova EN, Takenaga K. A procedure for culturing astrocytes from white matter and the application of the siRNA technique for silencing the expression of their specific marker, S100A4. Brain Res Brain Res Protoc. 2005;15:59–65. doi: 10.1016/j.brainresprot.2005.03.005. [DOI] [PubMed] [Google Scholar]
- Lewis SE, Erickson RP, Barnett LB, Venta PJ, Tashian RE. N-ethyl-N-nitrosourea-induced null mutation at the mouse Car-2 locus: an animal model for human carbonic anhydrase II deficiency syndrome. Proc Natl Acad Sci U S A. 1988;85:1962–1966. doi: 10.1073/pnas.85.6.1962. [DOI] [PMC free article] [PubMed] [Google Scholar]
- Li X, Alvarez BV, Casey JR, Reithmeier RA, Fliegel L. Carbonic anhydrase II binds to and enhances activity of the Na+/H+ exchanger. J Biol Chem. 2002;277:36085–36091. doi: 10.1074/jbc.M111952200. [DOI] [PubMed] [Google Scholar]
- McMurtrie HL, Cleary HJ, Alvarez BV, Loiselle FB, Sterling D, Morgan PE, Johnson DE, Casey JR. The bicarbonate transport metabolon. J Enzyme Inhib Med Chem. 2004;19:231–236. doi: 10.1080/14756360410001704443. [DOI] [PubMed] [Google Scholar]
- Magistretti PJ, Pellerin L, Rothman DL, Shulman RG. Energy on demand. Science. 1999;283:496–497. doi: 10.1126/science.283.5401.496. [DOI] [PubMed] [Google Scholar]
- Magistretti PJ, Sorg O, Yu N, Martin JL, Pellerin L. Neurotransmitters regulate energy metabolism in astrocytes: implications for the metabolic trafficking between neural cells. Dev Neurosci. 1993;15:306–312. doi: 10.1159/000111349. [DOI] [PubMed] [Google Scholar]
- Martínez C, Kalise D, Barros LF. General requirement for harvesting antennae at Ca2+ and H+ channels and transporters. Front Neuroenergetics. 2010;2:27. doi: 10.3389/fnene.2010.00027. [DOI] [PMC free article] [PubMed] [Google Scholar]
- Parkkila S, Parkkila AK, Rajaniemi H, Shah GN, Grubb JH, Waheed A, Sly WS. Expression of membrane-associated carbonic anhydrase XIV on neurons and axons in mouse and human brain. Proc Natl Acad Sci U S A. 2001;98:1918–1923. doi: 10.1073/pnas.98.4.1918. [DOI] [PMC free article] [PubMed] [Google Scholar]
- Pellerin L. Food for thought: the importance of glucose and other energy substrates for sustaining brain function under varying levels of activity. Diabetes Metab. 2010;36:59–63. doi: 10.1016/S1262-3636(10)70469-9. [DOI] [PubMed] [Google Scholar]
- Pellerin L, Magistretti PJ. Food for thought: challenging the dogmas. J Cereb Blood Flow Metab. 2003;23:1282–1286. doi: 10.1097/01.WCB.0000096064.12129.3D. [DOI] [PubMed] [Google Scholar]
- Pierre K, Magistretti PJ, Pellerin L. MCT2 is a major neuronal monocarboxylate transporter in the adult mouse brain. J Cereb Blood Flow Metab. 2002;22:586–595. doi: 10.1097/00004647-200205000-00010. [DOI] [PubMed] [Google Scholar]
- Pierre K, Pellerin L. Monocarboxylate transporters in the central nervous system: distribution, regulation and function. J Neurochem. 2005;94:1–14. doi: 10.1111/j.1471-4159.2005.03168.x. [DOI] [PubMed] [Google Scholar]
- Pushkin A, Abuladze N, Gross E, Newman D, Tatishchev S, Lee I, Fedotoff O, Bondar G, Azimov R, Ngyuen M, Kurtz I. Molecular mechanism of kNBC1–carbonic anhydrase II interaction in proximal tubule cells. J Physiol. 2004;559:55–65. doi: 10.1113/jphysiol.2004.065110. [DOI] [PMC free article] [PubMed] [Google Scholar]
- Rafiki A, Boulland JL, Halestrap AP, Ottersen OP, Bergersen L. Highly differential expression of the monocarboxylate transporters MCT2 and MCT4 in the developing rat brain. Neuroscience. 2003;122:677–688. doi: 10.1016/j.neuroscience.2003.08.040. [DOI] [PubMed] [Google Scholar]
- Rahman B, Schneider HP, Bröer A, Deitmer JW, Bröer S. Helix 8 and helix 10 are involved in substrate recognition in the rat monocarboxylate transporter MCT1. Biochemistry. 1999;38:11577–11584. doi: 10.1021/bi990973f. [DOI] [PubMed] [Google Scholar]
- Rose CR, Deitmer JW. Evidence that glial cells modulate extracellular pH transients induced by neuronal activity in the leech central nervous system. J Physiol. 1994;481:1–5. doi: 10.1113/jphysiol.1994.sp020413. [DOI] [PMC free article] [PubMed] [Google Scholar]
- Rose CR, Deitmer JW. Stimulus-evoked changes of extra- and intracellular pH in the leech central nervous system. I. J Neurophysiol. 1995;73:125–131. doi: 10.1152/jn.1995.73.1.125. [DOI] [PubMed] [Google Scholar]
- Silverman DN. Carbonic anhydrase: oxygen-18 exchange catalyzed by an enzyme with rate-contributing proton-transfer steps. Methods Enzymol. 1982;87:732–752. doi: 10.1016/s0076-6879(82)87037-7. [DOI] [PubMed] [Google Scholar]
- Simpson IA, Carruthers A, Vannucci SJ. Supply and demand in cerebral energy metabolism: the role of nutrient transporters. J Cereb Blood Flow Metab. 2007;27:1766–1791. doi: 10.1038/sj.jcbfm.9600521. [DOI] [PMC free article] [PubMed] [Google Scholar]
- Söderberg O, Leuchowius KJ, Gullberg M, Jarvius M, Weibrecht I, Larsson LG, Landegren U. Characterizing proteins and their interactions in cells and tissues using the in situ proximity ligation assay. Methods. 2008;45:227–232. doi: 10.1016/j.ymeth.2008.06.014. [DOI] [PubMed] [Google Scholar]
- Sültemeyer DF, Fock HP, Canvin DT. Mass spectrometric measurement of intracellular carbonic anhydrase activity in high and low Ci cells of Chlamydomonas: studies using 18O exchange with 13C/18O labeled bicarbonate. Plant Physiol. 1990;94:1250–1257. doi: 10.1104/pp.94.3.1250. [DOI] [PMC free article] [PubMed] [Google Scholar]
- Supuran CT. Carbonic anhydrases as drug targets: general presentation. In: Supuran CT, Winum J-Y, editors. Drug Design of Zinc-Enzyme Inhibitors. New Jersey: John Wiley & Sons, Inc; 2009. pp. 15–17. [Google Scholar]
- Suzuki A, Stern SA, Bozdagi O, Huntley GW, Walker RH, Magistretti PJ, Alberini CM. Astrocyte-neuron lactate transport is required for long-term memory formation. Cell. 2011;144:812–823. doi: 10.1016/j.cell.2011.02.018. [DOI] [PMC free article] [PubMed] [Google Scholar]
- Svichar N, Chesler M. Surface carbonic anhydrase activity on astrocytes and neurons facilitates lactate transport. Glia. 2003;41:415–419. doi: 10.1002/glia.10187. [DOI] [PubMed] [Google Scholar]
- Svichar N, Esquenazi S, Waheed A, Sly WS, Chesler M. Functional demonstration of surface carbonic anhydrase IV activity on rat astrocytes. Glia. 2006;53:241–247. doi: 10.1002/glia.20277. [DOI] [PubMed] [Google Scholar]
- Tong CK, Cammer W, Chesler M. Activity-dependent pH shifts in hippocampal slices from normal and carbonic anhydrase II-deficient mice. Glia. 2000;31:25–30. doi: 10.1002/1098-1136(200008)31:2<125::aid-glia40>3.0.co;2-7. [DOI] [PubMed] [Google Scholar]
- Tseng MT, Chan SA, Schurr A. Ischemia-induced changes in monocarboxylate transporter 1 reactive cells in rat hippocampus. Neurol Res. 2003;25:83–86. doi: 10.1179/016164103101200978. [DOI] [PubMed] [Google Scholar]
- Tu CK, Silverman DN, Forsman C, Jonsson BH. Role of histidine 64 in the catalytic mechanism of human carbonic anhydrase II studied with a site-specific mutant. Biochemistry. 1989;28:7913–7918. doi: 10.1021/bi00445a054. [DOI] [PubMed] [Google Scholar]
- Vince JW, Reithmeier RA. Carbonic anhydrase II binds to the carboxyl terminus of human band 3, the erythrocyte C1/HCO3− exchanger. J Biol Chem. 1998;273:28430–28437. doi: 10.1074/jbc.273.43.28430. [DOI] [PubMed] [Google Scholar]
- Vince JW, Reithmeier RAF. Identification of the carbonic anhydrase II binding site in the Cl−/HCO3− anion exchanger AE1. Biochemistry. 2000;39:5527–5533. doi: 10.1021/bi992564p. [DOI] [PubMed] [Google Scholar]
- Walz W, Mukerji S. Lactate production and release in cultured astrocytes. Neurosci Lett. 1988;86:296–300. doi: 10.1016/0304-3940(88)90499-5. [DOI] [PubMed] [Google Scholar]
- Waniewski RA, Martin DL. Astrocytes and synaptosomes transport and metabolize lactate and acetate differently. Neurochem Res. 2004;29:209–217. doi: 10.1023/b:nere.0000010450.21586.a6. [DOI] [PubMed] [Google Scholar]
- Wender R, Brown AM, Fern R, Swanson RA, Farrell K, Ransom BR. Astrocytic glycogen influences axon function and survival during glucose deprivation in central white matter. J Neurosci. 2000;20:6804–6810. doi: 10.1523/JNEUROSCI.20-18-06804.2000. [DOI] [PMC free article] [PubMed] [Google Scholar]
- Wilson MC, Meredith D, Bunnun C, Sessions RB, Halestrap AP. Studies on the dids binding site of monocarboxylate transporter 1 suggest a homology model of the open conformation and a plausible translocation cycle. J Biol Chem. 2009;284:20011–20021. doi: 10.1074/jbc.M109.014217. [DOI] [PMC free article] [PubMed] [Google Scholar]
- Wilson MC, Meredith D, Manning Fox JE, Manoharan C, Davies AJ, Halestrap AP. Basigin (CD147) is the target for organomercurial inhibition of monocarboxylate transporter isoforms 1 and 4: the ancillary protein for the insensitive MCT2 is Embigin (gp70) J Biol Chem. 2005;280:27213–27221. doi: 10.1074/jbc.M411950200. [DOI] [PubMed] [Google Scholar]
- Wyss MT, Jolivet R, Buck A, Magistretti PJ, Weber B. In vivo evidence for lactate as a neuronal energy source. J Neurosci. 2011;31:7477–7485. doi: 10.1523/JNEUROSCI.0415-11.2011. [DOI] [PMC free article] [PubMed] [Google Scholar]