

Abstract
During early development, peripheral sensory systems generate physiological activity prior to exposure to normal environmental stimuli. This activity is thought to facilitate maturation of these neurons and their connections, perhaps even promoting efficacy or modifying downstream circuitry. In the mammalian auditory system, initial connections form at embryonic ages, but the functional characteristics of these early neural connections have not been assayed. We investigated processes of embryonic auditory development using a whole-head slice preparation that preserved connectivity between peripheral and brainstem stations of the auditory pathway. Transgenic mice expressing fluorescent protein provided observation of spiral ganglion and cochlear nucleus neurons to facilitate targeted electrophysiological recording. Here we demonstrate an apparent peripheral-to-central order for circuit maturation. Spiral ganglion cells acquire action potential-generating capacity at embryonic day 14 (E14), the earliest age tested, and action potential waveforms begin to mature in advance of comparable states for neurons of the ventral cochlear nucleus (VCN) and medial nucleus of the trapezoid body (MNTB). In accordance, auditory nerve synapses in the VCN are functional at E15, prior to VCN connectivity with the MNTB, which occurs at least 1 day later. Spiral ganglion neurons exhibit spontaneous activity at least by E14 and are able to drive third-order auditory brainstem neurons by E17. This activity precedes cochlear-generated wave activity by 4 days and ear canal opening by at least 2 weeks. Together, these findings reveal a previously unknown initial developmental phase for auditory maturation, and further implicate the spiral ganglion as a potential controlling centre in this process.
Key points
Neural activity in sensory systems is important for proper assembly of neural circuits during early development.
In the auditory system, the timing for functional synapse formation and reliance of central circuit formation on peripherally generated activity are unknown.
We used a novel whole-head slice preparation and genetically labelled auditory neurons to provide the first assay of cells at embryonic ages and reveal a peripheral-to-central maturation sequence.
Auditory nerve fibres generate spontaneous action potentials by embryonic day 14 and drive third order central neurons by embryonic day 17, nearly 2 weeks before hearing onset.
This information provides a timeline for initial auditory circuit assembly and the basis to explore mechanisms for initial sensory circuit assembly.
Introduction
For proper neural development, the necessity of signalling from neuronal partners in the form of synaptic activity remains a question of great importance. Genetic silencing of synaptic vesicle release machinery demonstrated that synaptic structures can initially form independently of neurotransmission in early development, but pronounced neurodegeneration occurs soon thereafter (Verhage et al. 2000; Varoqueaux et al. 2002). In sensory systems, considerable attention is given to the roles of peripheral neural activity on perpetuation and refinement of their central synaptic targets (Penn & Shatz, 1999; Rubel & Fritzsch, 2002). However, in mammals relatively little attention has been focused at the earlier, functional assembly of synapses between sensory nuclei, and the comparative physiological development of constituent neurons at embryonic ages. Early communication between axons and target neurons, in the form of synaptic, non-synaptic contact mediated, or secreted cues, probably influences both the structural and physiological development of neurons. Thus, it is critical to define temporal features such as initial anatomical contact of pre- and postsynaptic structures and onset of functional synaptic communication. Observation of corresponding maturational details following these events facilitates an understanding of the complex interplay between the structural, molecular and electrophysiological events that support normal synaptic and neuronal development. These topics are central to dissection of the roles of neural electrical and synaptic activity to guide initial stages of circuit stabilization and cellular maturation.
In the lower auditory system of rodents, peripheral and central neurons are born before the end of the second embryonic week (Pierce, 1967, 1973; Ruben, 1967; Martin & Rickets, 1981; Koundakjian et al. 2007). The potential to propagate electrical signals into the brain exists even before neurogenesis of these neurons is complete. Spiral ganglion neurons extend axons into the ventral cochlear nucleus (VCN) by E12.5 (Karis et al. 2001; Maklad et al. 2010; Lu et al. 2011) and dendrites into the region of hair cells by E15.5 (Bruce et al. 1997; Deng et al. 2006; Koundakjian et al. 2007). However, spiral ganglion cell (SGC) physiology is typically studied neonatally (Lin & Chen, 2000) or after several days in vitro following late embryonic dissection. Targets of SGCs in the VCN have been studied in detail only as early as postnatal day (P) 4 (Wu & Oertel, 1987). Entry of VCN axons into the ipsilateral and contralateral superior olivary complex (SOC), a third-order cellular complex, occurs much earlier, at E14 in mouse and E15 in rat (Kandler & Friauf, 1993; Howell et al. 2007). This time frame allows for the possibility that central auditory connections could become functional prior to peripheral innervations of the brain, as occurs in the chick auditory system (Jackson & Parks, 1982; Lu & Trussell, 2007; Gao & Lu, 2008).
In rodents, physiological properties of the lateral superior olive (LSO) and medial nucleus of the trapezoid body (MNTB), two principal SOC cell groups, have been studied at late embryonic ages, with VCN projections forming functional synapses onto contralateral MNTB neurons at E17 in mouse (Hoffpauir et al. 2010) or onto ipsilateral LSO neurons at E18 in rat (Kandler & Friauf, 1995a,b). Thus, considerable gaps remain in functional assessment of these circuits, especially at earlier embryonic ages, to establish temporal sequences for synapse assembly and onset of synaptic function.
To address these questions, we used acute whole-head mouse slices (Hoffpauir et al. 2010), which we demonstrate here preserved auditory neural connections from peripheral to third-order neural centres in young animals. We focused on embryonic ages until the day of birth (P0) to capture early events in synapse assembly and neuronal function. By using mice with genetically labelled neurons, we could identify SGCs in the immature cochlea and target auditory nerve fibres for electrical stimulation. We also investigated precise timing of functional synaptic connectivity between the spiral ganglion and VCN, and examined biophysical properties of developing auditory neurons. Our data reveal, in contrast to avian data (Jackson & Parks, 1982; Lu & Trussell, 2007; Gao & Lu, 2008), a peripheral-to-central pattern of early neuronal maturation in the auditory system of the mouse that may influence establishment of functional synaptic contacts.
Methods
Ethical approval
All experimental procedures involving animals were reviewed, approved and governed by the West Virginia University Institutional Animal Care and Use Committee in accordance with policies of the United States Public Health Service, in a manner consistent with standards put forth in the Guide for the Care and Use of Laboratory Animals.
Animals
Mice were maintained within the vivarium at the West Virginia University School of Medicine prior to experimentation. Animals were killed by rapid decapitation for removal and use of brain tissue. A total of 180 mouse pups aged E14–P0 from a total of 60 litters were used for these experiments. The FVB/NJ strain (The Jackson Laboratory, Bar Harbor, ME, USA) was selected for these experiments because these animals are efficient breeders and maintain a trajectory of normal hearing threshold throughout life (Zheng et al. 1999). For some experiments, mice containing a Cre-responsive, tdTomato-reporter in the Rosa26 locus (Rosa26-tdTomato, Ai9; Madisen et al. 2010; Jackson Lab no. 007905) were bred with mice expressing Cre-recombinase under a parvalbumin promoter (Pv-Cre; Hippenmeyer et al. 2005). We refer to the resulting mice as Pv-tdTomato. The Pv-Cre line was maintained on a C57/FVB mixed background, while the Rosa26-tdTomato was maintained on an FVB background. To obtain mouse pups of known age, carefully timed pregnancies were carried out by pairing mice overnight. Paw and facial development of prenatal mice as well as crown–rump length measures and weight were observed to verify embryonic age in accordance with The Edinburgh Atlas of Mouse Development (http://www.emouseatlas.org/emap/home). All ages designated in this report are therefore assumed accurate within 12 h. Given that mice have a 19 day (E0–18.5) gestation period, the first 24 h after birth specifies P0, the oldest age at which animals were studied.
Brain slice preparation and maintenance
Late embryonic to early postnatal mice (E14–P0) were used to create brain slices for physiological recording and imaging. Following rapid decapitation, the skin was removed, and entire heads were sliced in a coronal plane at 200–350 μm using a VF-200 slicer (Precisionary Instruments, Greenville, NC, USA), while bathed in oxygenated, ice-cold ACSF solution (Hoffpauir et al. 2010). Tissue slices were maintained in oxygenated ACSF at 35°C for approximately 1 h before cooling to room temperature until needed. Ca2+ imaging and electrophysiology experiments were performed within 6 h of tissue slicing. During experimentation, constant perfusion of 35°C oxygenated ACSF was supplied across an RC27-L recording chamber (Warner Instruments, Hamden, CT, USA) at a rate of approximately 2 ml min−1 via a Valvelink-8 perfusion system (Automate Scientific, San Francisco, CA, USA). The use of chamber and dual in-line solution heaters, monitored by a TC-324B single channel and a TC-344B dual-channel temperature controller (Warner Instruments), maintained a high degree of thermal stability within the recording chamber.
Calcium imaging
Tissue slices were incubated in 10 μm Fura-2 AM (Invitrogen, Carlsbad, CA, USA) containing ACSF solution at room temperature for 22–30 min with at least 10 min of wash in normal ACSF. Digital images (512 × 512 pixels) were acquired with a C9100-12 EM-CCD camera (Hamamatsu, Sewickley, PA, USA) controlled by HC Image software (Hamamatsu) at a capture rate of 25 Hz. A Lambda DG-4 xenon source (Sutter Instruments, Novato, CA, USA) provided excitation light at 340 nm and 380 nm and filter switching for fluorescence imaging (Chroma Fura-2 filter set 71000a, Chroma Technology Corp., Bellows Fall, VT, USA). Emission was collected through a D510/80 bandpass filter controlled by a Lambda 10-2 filter wheel (Sutter Instruments). Imaging was performed using a Zeiss Axioskop2 plus microscope (Zeiss, Thornwood, NY, USA) with a 40× (NA 0.75) immersion lens. Activation of neural activity within the slice was accomplished with a dual-shaft tungsten microelectrode (115 μm tip spacing, FHC, Bowdoinham, ME, USA) typically positioned on the auditory nerve or on a spiral ganglion cell cluster near the base of the cochlea. Stimulation, 150 μs duration at 3 s intervals across a range of increasing stimulus amplitudes, was applied via a S940/S910 stimulus isolation unit (Dagan Corp., Minneapolis, MN, USA). Stimulus protocols were written and controlled using pCLAMP 9.2 software (Molecular Devices, Union City, CA, USA). Analysis within HC Image software to produce ratiometric images was performed equally across an entire field and included ratiometric subtraction of individual pixels, individual channel thresholding and brightness/contrast adjustments.
Electrophysiology
Recording electrodes (borosilicate glass 1.5 mm o.d., 0.86 mm i.d.; Sutter Instruments) were pulled to 2.5–5 MΩ tip resistance with a P-97 pipette puller (Sutter Instruments). Internal recording solution for voltage and current clamp contained (in mm): 114 potassium gluconate, 26 KCl, 2 MgCl2, 0.1 CaCl2, 1.1 EGTA-Na4, 10 Hepes, 5 sodium phosphocreatine and 4 ATP-Mg, at pH 7.3. Extracellular solution of ACSF contained (in mm): 125 NaCl2, 2.5 KCl, 1 MgCl2, 2 CaCl2, 25 glucose, 25 NaHCO3, 1.25 NaH2PO4, 0.4 ascorbic acid, 3 myo-inositol and 2 sodium pyruvate, at pH 7.3. These solutions generated a chloride equilibrium potential of –37.9 mV due to high intracellular chloride concentration, which has been observed in SOC neurons of neonatal rats (Lohrke et al. 2005). In some experiments lidocaine N-ethyl bromide (QX-314; Sigma-Aldrich, St Louis, MO, USA) was included in the intracellular solution at a concentration of 5 mm in order to block Na+ channels of the recorded neuron. Whole-cell current and voltage clamp recordings were performed using a Multiclamp 700A amplifier and a Digidata 1322A digitizer (Molecular Devices) controlled by pCLAMP 9.2 software. Data were acquired at a sampling rate of 20 kHz and low-pass filtered at 6–10 kHz. For voltage clamp recordings, series resistance compensation was set to 70%. Pipette capacitance neutralization and bridge balance were monitored and adjusted throughout current clamp recording. All reported membrane potential values and appropriate voltage measures have been corrected for the calculated liquid junction potential (–13 mV). Current clamp recordings were typically made at both resting membrane potential (RMP, no holding current) and at a standardized membrane potential (SMP) of –70 mV. This SMP value was selected to match the RMP of P14 MNTB cell neurons recorded in brain slice (Hoffpauir et al. 2010). SMP values were specifically used for measures of AP characteristics including latency, half-width and amplitude. Inflection point calculations were determined using a local plot of the first derivative, and qualitatively assessing the increase in slope of the first derivative. Qualitative appraisal directly from the AP voltage trace in older animals yielded essentially identical values. In some younger cells with slower and more subtle slope change, direct qualitative inspection of the AP trace was performed (E14–E16). All VCN recordings were performed at the level of eighth nerve entry and selectively targeted the ventral areas of the VCN near the auditory nerve root. This region of the VCN contains primarily globular bushy and stellate cells (Webster & Trune, 1982), and following hearing onset is preferentially responsive to high-frequency sound. For comparison across neural cell groups, recordings were also made in the basal cochlea and medial MNTB, regions which will share similar high-frequency sensitivity post-hearing. Synaptically evoked current or voltage in the VCN was recorded in response to auditory nerve (AN) stimulation as described in the previous paragraph. Stimulus amplitudes were presented first as an increasing sequence of values, then for most cells repeated in random order with three to four set repeats. The range of stimulus intensity was based upon initial measures of stimulus threshold for individual cells. We measured maximal evoked current amplitude across all stimulus protocols. Current steps in 5 pA increments and 200 ms duration were injected to measure membrane electrical properties and generate action potential (AP) waveforms. Current clamp recording was performed at RMP and SMP to standardize comparisons among developing neurons.
Confocal microscopy
Images of td-Tomato fluorescent protein-expressing neurons were obtained using a Zeiss LSM 510 confocal microscope. Image stacks were acquired with a 10× (0.5 NA), 20× (0.75 NA) or a 63× (1.2 NA) objective lens and processed equally across an entire image field to maximize image brightness and contrast using the ‘levels’ tool adjustment in Adobe Photoshop software (Adobe Systems Incorporated, San Jose, CA, USA).
Analysis
Averaged values are typically reported here ± standard deviation. Voltage was averaged between 160 and 185 ms delay near the end of the current step and averaged from three to five stimulus runs to generate I–V curves. Input resistance was measured as slope across I–V curves constructed from injection of current steps at and hyperpolarized to the membrane potential. Values were calculated using both RMP and SMP. AP parameters were measured on unaveraged traces. AP amplitude was calculated as the difference between the inflection point and the peak voltage, and duration was the width of the AP at half-amplitude. Percentage of cells generating APs was measured at RMP, with measures at SMP during current injection added for comparison. AP latency was measured as the time delay between AN stimulus and both the inflection point and AP peak. Postsynaptic current latency was measured as the time delay between AN stimulus and both the onset and initial maximum of the EPSC. All physiological analyses used Clampfit 9.2 (Molecular Devices) with graphs created using OriginPro8.5 (Northhampton, MA, USA). Student's t test was employed for statistical comparisons, with a P value criterion for significance of ≤ 0.05.
Results
In order to establish a temporal framework for functional connectivity of immature auditory brain regions, we used a mouse whole-head slice preparation containing cochlea, cochlear nucleus (CN) and superior olivary complex (SOC), including the medial nucleus of the trapezoid body (MNTB) (Hoffpauir et al. 2010). This preparation preserves many of the axonal projections and much of the connectivity among these early auditory stations, and allows for convenient experimental access to cell groups and neurons of interest. Use of transgenic animals exhibiting selective expression of the fluorescent reporter tdTomato (Pv-tdTomato mice, see Methods; Shaner et al. 2004; Hippenmeyer et al. 2005) also facilitated these investigations by providing clear anatomic representation of nuclear boundaries, axonal projections and neuronal groups not apparent from standard DIC observation (Fig. 1). At embryonic and early postnatal ages, these animals exhibit selective fluorescence expression within cell bodies and processes of auditory and vestibular ganglion cells, cochlear hair cells and CN neurons (Fig. 1C and Fig. 6A). Experience gained with Pv-tdTomato mice permitted use of non-tdTomato-expressing animals for studies of auditory nerve (AN) innervation of the ventral cochlear nucleus (VCN).
Figure 1. Whole-head mouse slices preserve peripheral and central brainstem auditory stations.
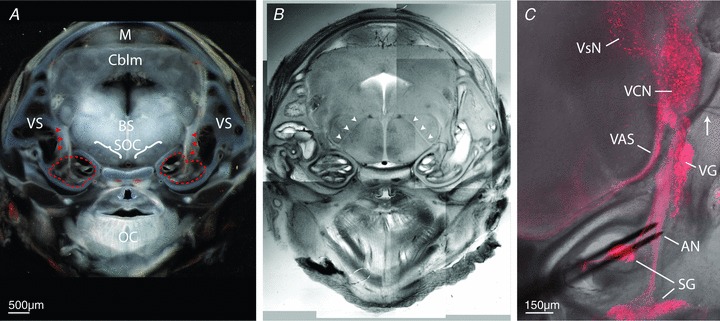
Selective expression of fluorescent reporter protein in an embryonic mouse whole-head slice preparation highlights auditory and vestibular system structures. A, coronal tissue slice, using transmitted light, of entire mouse head at E17-containing cochleae (dashed red outlines), auditory nerves (red arrowheads), peripheral vestibular system (VS), brainstem region (BS), superior olivary complex (SOC), midbrain (M), cerebellum (Cblm) and oral cavity region (OC). B, same tissue from panel A visualized with DIC optics to better reveal brain fibre tracts; arrowheads identify 7th cranial nerve roots. C, confocal image stack projection shows distribution of td-Tomato expression under control of parvalbumin promoter, overlayed on same tissue slice imaged with DIC optics. At embryonic ages, fluorescence is restricted to spiral ganglion (SG), auditory nerve (AN), vestibular ganglion (VG), ventral cochlear nucleus (VCN) neurons, vestibular nuclei (VsN) and axons of the ventral acoustric stria (VAS). Bipolar stimulating electrodes (black) are positioned on the AN, and recording electrode (arrow) is positioned in the ventral region of the VCN near auditory nerve entry zone.
Figure 6. Spiral ganglion neurons generate action potentials by E14.
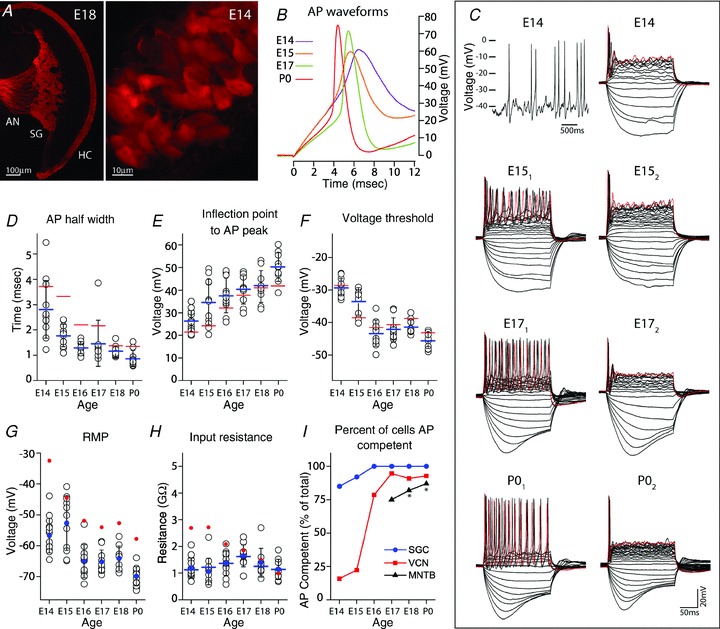
A, wide field view of an E18 cochlea (left) in Pv-tdTomato mice shows fluorescent inner and outer hair cells (HC), spiral ganglion (SG) and auditory nerve (AN) fibres. By E14, SG cell bodies and proximal neurites can be observed with fluorescence imaging (right), facilitating their identification within the cochlea for electrophysiological recording. B, representative AP waveforms of developing SGCs evoked by depolarizing current injection at SMP. C, spontaneous APs occur in SGCs at E14 (upper left) and older ages (not shown). Voltage responses to serial injection of current steps (5 pA increments) are illustrated by representative cases at E14, E15, E17 and P0. AP response is phasic at E14, but can be tonic (subscript 1) or phasic (subscript 2) in older SG cells. Hyperpolarizing current can convert tonic to phasic AP pattern (E15 subscripts 1 and 2 are the same neuron). Red trace is response to largest depolarizing current. D–F, APs become faster and larger, and voltage threshold becomes hyperpolarized during this developmental time frame. G, resting membrane potential becomes more hyperpolarized with age. H, input resistance at RMP (filled blue circles) does not change dramatically across this age range and is similar for SMP (blue bars). In panels D–G, average values for VCN neurons are depicted for comparison (red bars). I, as a population, SGCs acquire AP capability prior to VCN neurons, and VCN neurons prior to MNTB neurons (latter data re-plotted from Hoffpauir et al. 2010, asterisk). In panels D–H, open black circles indicate values for individual neurons, blue denotes SGC values, red denotes VCN values, bars indicate averaged SMP values, filled circles indicate averaged RMP values and black error bars show SD.
Embryonic development of VCN neurons and functional connectivity of auditory nerve afferents
We first determined initial appearance of functional connectivity between SGCs and neurons of the VCN. Anatomical evidence has been provided for innervation of the cochlear nucleus by auditory nerve fibres (ANF) as early as E12.5 (Karis et al. 2001; Lu et al. 2011), with consistent topographic (and probably tonotopic) innervation by E15.5 (Koundakjian et al. 2007). To explore whether this early innervation is functional, we initially used Ca2+ imaging as a more global assay of neural activity than single-cell recording. Bipolar stimulating electrodes were positioned on AN within the basal cochlea (Figs 1C and 2A) and responses to stimulation measured with Fura-2 ratiometric Ca2+ imaging of the VCN (Fig. 2). Our initial experiments showed activation of VCN from AN stimulation at P0. Therefore, Ca2+ responses to AN stimulation were investigated in whole-head slices at progressively younger ages, in 1 day intervals, to determine the earliest responsive age. Stimulus-matched Ca2+ responses in VCN were apparent as early as E15 (Fig. 2C–G). We were unable to elicit responses at E14. Across all ages that showed Ca2+ responses (E15–P0), AN stimulus-induced signals were slow (3–5 s duration), with a rapid onset to peak followed by slow decay towards baseline. At these immature ages, progressively increasing stimulus amplitude could occasionally result in a reduced or absent response (Fig. 2C, cell 3 at 18V).
Figure 2. VCN neurons can be activated by auditory nerve stimulation at E15.
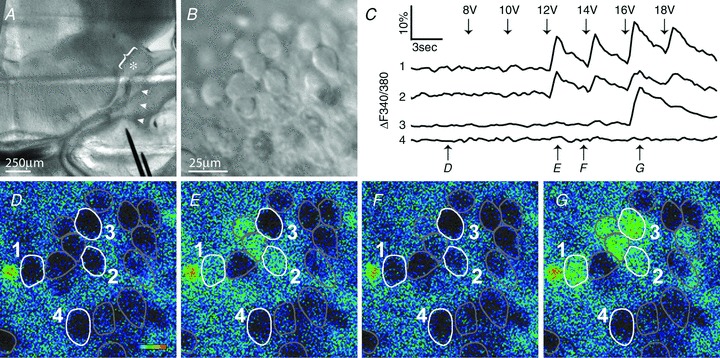
A, E15 whole-head slice preparation has gross structure similar to E17, with AN (arrowheads) extending from cochlea to VCN (bracket). Bipolar stimulating electrodes (black) are placed within cochlea, and typical recording location in VCN at the level of auditory nerve entry is indicated by asterisk. B, DIC image of VCN field defines cellular boundaries for Fura-2 imaging of Ca2+ levels. C, ratiometric Ca2+ signals (340 nm/380 nm) induced by AN stimulation for numbered cells shown in D–G. Cells 1–3, but not 4, exhibit stimulus-locked Ca2+elevation. Temporal sequence of Fura-2 response maps (D–G) is depicted with lower arrows. D–G, pseudocolour maps of Ca2+ signal intensity for field shown in B. Ca2+ intensity depicted with thermal scale (D), with lowest intensity blue and highest red. Several cells show acute stimulus-evoked Ca2+ increase (E, 12 V and G, 16 V stimuli) in comparison with baseline (D) preceding stimulation. Neurons in F have returned to values near baseline about 3 s after 12 V stimulus. Scale in B applies to D–G.
To further characterize early AN synaptic inputs to VCN, we performed whole-cell voltage and current clamp recording of VCN neurons that exhibited Ca2+ elevation following AN stimulation. Recording electrode positions were limited to the ventral aspect of the CN at the rostro-caudal level of auditory nerve entry. In this area of the mouse VCN globular bushy cells predominate, but multipolar cells are also present (Webster & Trune, 1982). A range of AN stimulus amplitudes were applied, and the evoked current was recorded. Maximum evoked synaptic currents were very small at ages E15–16, typically less than 200 pA. Peak current amplitude increased between E16 and P0, reaching an average value of about 1500 pA (Fig. 3A and B). To address the potential for space clamp error contributing to large currents, especially at P0, recordings were made with the Na+ channel blocker QX-314 present in the recording pipette. We recorded currents with similar mean and variance (average 1424 ± 1389 pA, n = 7, no significant difference between groups) that, like control traces, showed evidence for asynchronous synaptic events on the declining phase of the current trace (see Supplemental Fig. S1). The latency from stimulus to initiation of EPSCs decreased with age from about 4 to 1.3 ms (Fig. 3C). We measured the distance between the stimulus site in the basal cochlea to the recording site and, subtracting an estimated synaptic delay of 0.5 ms, calculated an increase in axonal conduction velocity from 0.2 to 0.5 m s−1. These values are consistent with conduction by unmyelinated fibres in immature animals (Fitzgerald, 1985; Lizarraga et al. 2007).
Figure 3. Synaptic currents in VCN neurons are evoked at E15 and grow rapidly after E16.
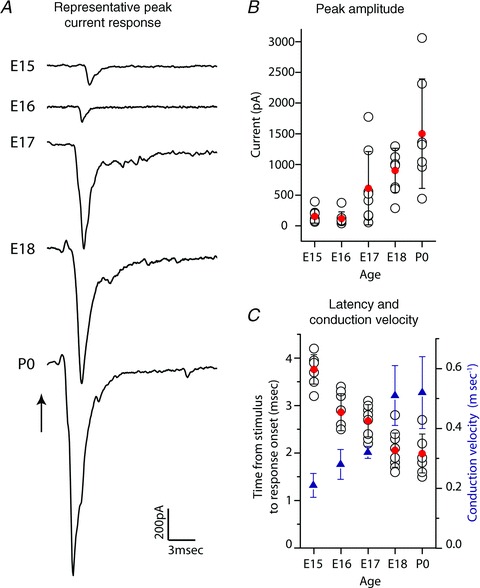
A, AN stimulation (time indicated by arrow) evoked synaptic currents in VCN neurons as early as E15. Representative traces shown for ages E15–P0. B, maximal evoked current amplitude shown for each responsive neuron (open black circles) across age (n = 8 per age for E15–18, n = 7 for P0). Average peak current amplitude (filled red circles) is initially very low, but increased rapidly after E16 to almost 1.5 nA by P0. C, minimum response latency from stimulus to current onset (left axis values, open black circles, n = 8 per age for E15–18, n = 7 for P0) decreased with age. Estimated conduction velocity (right axis) increased across developmental age. Holding potential was –73 mV for all recordings. Open black circles indicate values for individual neurons, filled red circles indicate average values, blue triangles depict average conduction velocity measures, and error bars show SD.
Our recording protocol entailed a switch from voltage to current clamp to assess the developmental appearance and characteristics of action potential (AP) wave shapes elicited by synaptic currents. Synaptically evoked APs represent more naturalistic responses compared with current-evoked membrane APs. Slow, small-amplitude voltage responses were predominant at E15, devoid of typical AP features such as rapid depolarization and a sharp peak (Fig. 4A, bottom trace). Indeed, among eight cells that were positive for AN stimulus-evoked synaptic currents in voltage clamp at E15, only one cell (12%) was capable of AP generation in current clamp. The proportion of VCN cells, positive for current response, that exhibit AN-evoked APs increased rapidly between E16 to 18 (E16, 7/8, 88%; E17, 6/8, 75%; E18, 9/9, 100%; P0, 7/7 100%). Especially after E16, additional synaptic events followed the peak response. AP waveforms changed over this same embryonic time frame, as reported in Fig. 4A, where representative AP responses are shown for each age. APs showed an increase in amplitude (averaged inflection point to peak: 29.7 mV at E16, n = 7; 40.7 mV at E17, n = 6; 42.7 mV at E18, n = 9; 44.3 mV at P0, n = 7) and a decrease in duration, as measured by the half-width (Fig. 4B). The latency from AN stimulus to AP peak decreased rapidly between E16 and P0 (Fig. 4C). Note that these latencies are longer than latencies to current onset and current peak (Fig. 3A and C).
Figure 4. Action potentials are evoked in VCN neurons at embryonic ages.
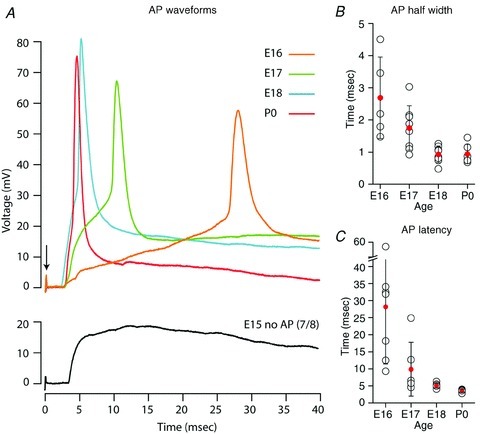
A, APs are first reliably elicited by AN stimulation at E16. For comparison, representative waveforms for ages E15–P0 are aligned (0 mV) at resting membrane potential, with latency relative to AN stimulus (0 ms, arrow). B, AP half-width decreased with age. C, latency from AN stimulation to AP peak decreased with age (n = 6–9 for all ages in panels B and C). Open black circles indicate values for individual neurons, filled red circles indicate average values and error bars show SD.
VCN neurons were further characterized electrophysiologically by intracellular injection of current steps across a range of hyperpolarizing and depolarizing values. This recording protocol was conducted at the resting membrane potential (RMP), and then repeated at the standardized membrane potential (SMP, see Methods). Representative voltage traces for ages E14–P0 are shown in Fig. 5A for recordings at RMP. Although APs could not be induced by AN stimulation at E14, perhaps due to immature synaptic machinery, current injection into E14 VCN neurons in a few cases exhibited sharp voltage responses categorized as APs (3/19,16%). The percentage of cells at RMP capable of generating APs generally increased from E15 to P0 (E15, 4/18, 22%; E16, 11/14, 79%; E17, 18/19, 95%; E18, 10/11, 91%; P0, 13/14, 93%). Aside from E14, these values were comparable to those for APs evoked by AN stimulation (reported above). Interestingly, when cells were held at SMP, the percentage of cells that generated APs was greater than at RMP and increased rapidly from 33% at E14 to 67% at E15, and was over 90% at all subsequent ages. Hyperpolarization to the SMP may have de-inactivated sodium channels and thereby increased spike probability. Current pulses were sufficiently long (200 ms) to examine AP discharge patterns. At E14 and E15, APs were limited to the stimulus onset, but between E16 and P0 a tonic pattern of APs was evident near stimulus threshold (Fig. 5A). For most cells, at the highest current injection values, several APs of diminishing amplitude were elicited before membrane potential settled at a steady depolarized value for the duration of the current step (Fig. 5A, red traces E16–E18). As the AP waveforms were superimposed upon a constant depolarizing current, AP amplitude was measured as the difference between the depolarizing inflection point and peak voltages. AP parameters were measured at SMP to standardize effects of membrane potential and to have sufficient numbers at early ages for comparison with SGCs (presented in the next section). AP amplitude of SMP values increased rapidly between E14 (21 mV) and E18 (41 mV; Fig. 5B), due in part to an increasingly hyperpolarized inflection point (red bars in Fig. 6F) and increased peak voltage (E14, –8.0 mV, n = 7; E18, 1.1 mV, n = 11).
Figure 5. Electrophysiological properties of developing VCN neurons.
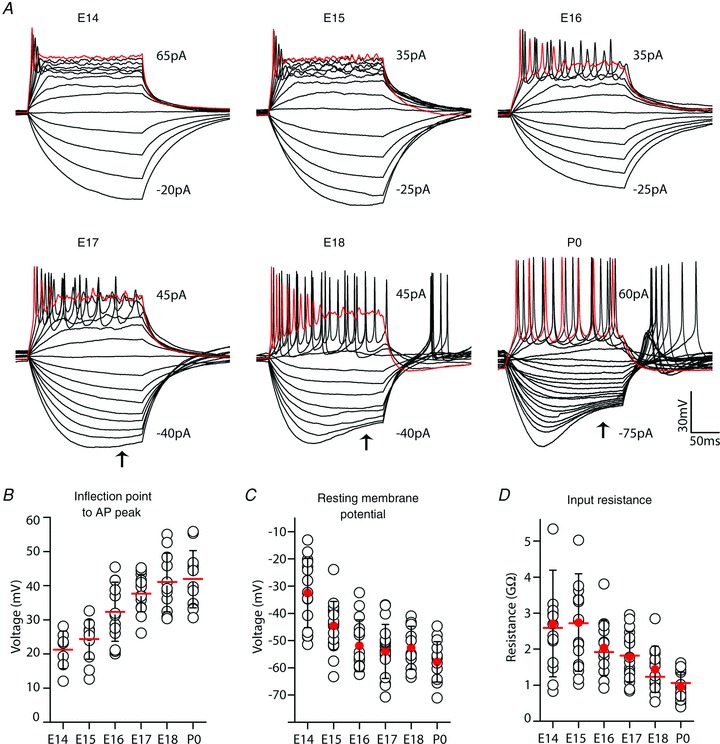
A, representative voltage responses of VCN neurons to serial injection of current steps (5 pA increments, 200 ms duration). Range of plotted current step values are reported for each series; some traces at larger positive values removed to clarify presentation. Voltage response to largest plotted depolarizing current step shown in red. Small AP responses followed by a steady depolarization are present in some cells at E14 and E15. Later ages show progressive appearance of tonic AP firing patterns during current step and sag (arrows) in hyperpolarizing voltage. B, AP amplitude, measured as difference between peak and inflection point, increased with VCN neuron maturation from 21 mV at E14 (n = 7) to over 40 mV by P0 (n = 11–14, each remaining age). C, resting membrane potential (RMP) for VCN neurons declines from –32 mV to about –60 mV by P0 (n = 15–19, all ages). D, input resistance at RMP (filled red circles) declines from very large values (average 2.7 GΩ) after E15 (n = 15–19, all ages). Red bars indicate average values with cells at standardized membrane potential (SMP, –73 mV), open black circles indicate values for individual neurons and black error bars show SD.
Hyperpolarizing current induced a steadily hyperpolarizing voltage in all cells at E14–15. By E17 a slight sag in the hyperpolarizing voltage became evident (Fig. 5A, arrows), indicative of a hyperpolarization-activated conductance (10/19, 53%). This sag was more pronounced at later ages and was present in 100% (12/12) of recorded cells by P0. Averaged RMP levels of VCN neurons became progressively more hyperpolarized from –33 mV at E14 to –58 mV at P0 (Fig. 5C). Input resistance at RMP remained very high across the recording time frame, but declined progressively from an average of 2.6 GΩ at E14–15, to 1.0 GΩ at P0 (Fig. 5D, filled red circles). When cells were held at the SMP, average slope resistance values were comparable at all ages (red bars in Fig. 5D).
Onset and early maturation of spiral ganglion cell action potentials
Although AN stimulation could elicit postsynaptic currents and Ca2+ signals in VCN cells as early as E15, it was not known whether failure to elicit responses at earlier ages was due either to immaturity of synaptic mechanisms or to immature AP-generating mechanisms of spiral ganglion cells (SGC) which are born between E9 and 13 (Ruben, 1967). Pv-tdTomato mice were used to positively identify SGCs in E14–P0 whole-head slices and to guide placement of recording electrodes (Fig. 6A). Voltage responses to intracellular current injection showed AP-generating capability of SGCs by E14 (11/13, 85% at RMP), the earliest age tested (Fig. 6B, C and I). Expression of tdTomato reporter was too weak to reliably identify SGC cells at E13, and they could not be unambiguously identified using DIC imaging. However, the large percentage of E14 SGCs that were capable of generating APs suggests that a subset of even younger SGCs are AP competent.
Representative AP waveforms at SMP showed maturation over the embryonic time period between E14 and P0 (Fig. 6B), including continuously decreasing AP half-width and increasing amplitude, measured as the difference between the depolarizing inflection point and peak voltages (Fig. 6D and E; SMP values). The latter was due in part to a decreasing AP voltage threshold (Fig. 6F). Patterns of AP firing during depolarizing current steps in embryonic SGCs initially were phasic for E14 cells, yet both phasic and tonic firing patterns were evident at RMP at later ages (Fig. 6C), with 42% (5/12) phasic at E15, 27% (3/11) phasic at E16, 30% (3/10) phasic at E17, 30% (3/10) phasic at E18, and 55% (6/11) phasic at P0. Both phasic and tonic responses have been recorded from early postnatal cultured SGCs, but only phasic responses occur in adult cultured SGCs (Mo & Davis, 1997; Lin & Chen, 2000; Adamson et al. 2002; Liu & Davis, 2007). The voltage holding potential was shifted in a hyperpolarizing direction by 3–10 mV in a subset of neurons, primarily at E15. Interestingly, this shift was sufficient to transform the AP firing pattern from tonic to phasic in 80% (4/5) of tonic E15 SGCs where this shift was attempted (Fig. 6C; E151–E152). We also tested for spontaneous APs over several sequential 20 s recording epochs. Spontaneous APs were present in 15% of cells (10 of 67) when tested in a subset of SGC recordings occurring across the age range from E14 (Fig. 6C, upper left) to P0. Rate of firing for these cells ranged from 0.05 Hz to 2.3 Hz.
Passive membrane properties of SGCs were also studied across the late embryonic period. The average RMP value was less than –50 mV across all ages, and became increasingly hyperpolarized with age (Fig. 6G). Input resistance of SGCs remained high at RMP (just above 1 GΩ; blue circles in Fig. 6H), consistent with acute neonatal cultured SGCs (Lin & Chen, 2000), changed little during this time period, and did not differ consistently with measures at SMP (SMP, blue bars in Fig. 6H). Taken together, AP waveform measures, RMP and input resistance values of SGCs are comparable to VCN measures occurring several days later in development, indicative that SGCs have advanced maturation compared with age-matched VCN neurons (blue denotes averaged SGC values, red denotes averaged VCN values, in Fig. 6D–H). A distinct set of SGC recordings were performed at P0 in non-transgenic, FVB mice to assess effects of mouse strain on physiological maturation. Key physiological properties were not significantly different from PV-tdTomato mice (Rin 1.3 ± 0.35 GΩ; RMP, –67 ± 3.3 mV; AP half-width, 1.01 ± 0.16 ms; AP threshold, –46.2 ± 2.3 mV; n = 7).
AN stimulation drives MNTB neurons before birth
Having established the capability of SGCs to generate APs at E14 and to provide synaptic input to VCN neurons that generate APs at E16, we investigated whether early activity of the AN could evoke activation of MNTB neurons. Among SOC targets of the VCN, MNTB connectivity was chosen for investigation due to its innervation by globular bushy cells, which are located in the AN entry zone of the VCN that was included in the whole-head slice preparation (Fig. 1C and Fig. 7A). In this preparation, it has been demonstrated that activation of VCN or ventral acoustic stria can elicit APs in contralateral MNTB principal cells as early as E17 (Hoffpauir et al. 2010). Using Ca2+ imaging to assay functional synaptic activation of the MNTB, AN stimulation yielded stimulus-locked responses in principal cells of the contralateral MNTB at E17 (n = 10 responsive animals, Fig. 7C). AN-evoked responses were not observed when ipsilateral MNTB areas were sampled (Fig. 7C). To further characterize AN stimulation of MNTB principal cells, voltage and current clamp recording was performed on Fura-2-responsive MNTB neurons. Evoked currents were relatively small, with 191 pA averaged peak current, and showed an average latency to onset of 11.9 ms (n = 8) (Fig. 7D, upper). Recording from the same neuron in current clamp showed that AN-evoked voltage responses had an initial slowly depolarizing rise followed by an AP with long after-depolarizing trajectory (Fig. 7D, lower). These APs occurred with an average peak latency of 33.1 ms, probably resulting from summation of multiple synaptic inputs from the VCN (Hoffpauir et al. 2010). EPSC response timing and presence of multiple smaller peaks is suggestive that individual inputs may exhibit multi-vesicular release. A current injection step series (5 pA steps) was also applied to MNTB neurons during current clamp recording (Fig. 7B). Current injection into MNTB neurons was capable of AP generation in 75% (6/8) of tested cells, comparable to the reported value (74%) in a larger population (Hoffpauir et al. 2010). Latency measurements were consistent with activation of MNTB via VCN neurons (Fig. 7E). The onset of postsynaptic currents in VCN preceded those in MNTB by 7.9 ms on average. More importantly, APs in VCN neurons, whether measured at the inflection point or the peak, preceded current onset in MNTB neurons by nearly 4 ms. Bars extending from mean values (filled circles) in Fig. 7E show the entire range of data. One VCN neuron, with latency longer than most MNTB cells, is plotted separately (asterisks). Therefore, by E17 in mouse, this auditory circuit is functional and spontaneous activity in AN fibres could activate third-order neurons of the auditory brainstem via VCN projection neurons.
Figure 7. Peripheral auditory system can drive MNTB activity by E17.
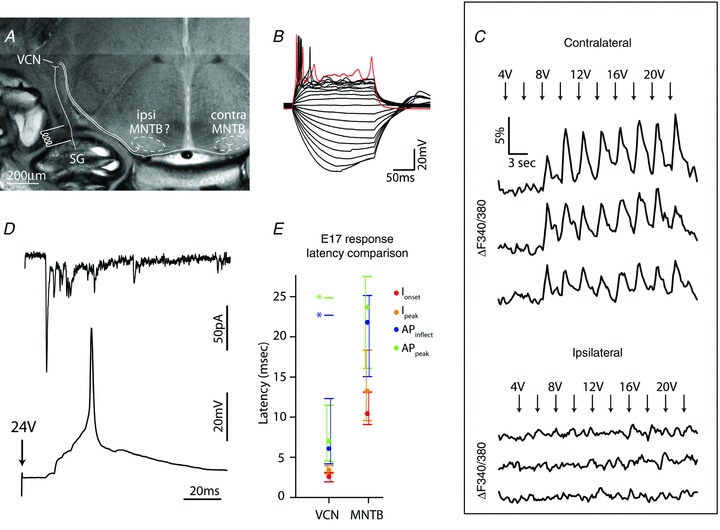
A, whole-head mouse slice at E17 depicting basic connectivity for MNTB input from peripheral SGCs, with electrode stimulation of AN at base of cochlea. We investigated ability to activate ipsilateral and contralateral MNTB from AN stimulation site. B, responses of E17 MNTB principal neuron to series of current steps. C, AN stimulus-locked Ca2+ increases, measured using Fura-2, occur in contralateral, but not ipsilateral, E17 MNTB neurons. D, whole-cell recordings of a single E17 MNTB principal neuron showing evoked synaptic currents and postsynaptic potentials with AP following AN stimulation. E, comparison of latencies for postsynaptic currents (onset and peak values) and APs (inflection point and peak) at E17 in VCN and MNTB following AN stimulation. One VCN cell had very long latency (asterisks), and was excluded from mean calculations (filled circles). Range of responses depicted with bars.
Discussion
We have investigated timing of the earliest synaptic communication between SGCs and their VCN targets through use of a whole-head mouse slice preparation, which preserves neural connectivity between the cochlea and auditory brainstem. We also examined how timing of VCN functional innervation relates to both upstream maturation of SGCs, and to downstream signalling at the MNTB. We found that these emergent connections occur at embryonic ages long in advance of environmentally related activity and precede hair cell-generated activation. SGCs follow a developmental trajectory that precedes central neurons, implying coordination between auditory centres that may promote early neuronal maturation.
Functional connectivity between auditory periphery and CNS
VCN neurons of the mouse receive initial functional innervation from SGCs at E15 (Fig. 2–4), 4 days prior to birth, about 6 days before onset of patterned activity generated by hair cells (Tritsch & Bergles, 2010) and nearly 2 weeks (P8) before sensitivity to airborne sound (Mikaelian & Ruben, 1965; events described in this paragraph depicted in summary timeline in Fig. 8). Most SGCs generate APs by E14, within 2 days after completion of neurogenesis in this cell population. E14 was the earliest age we were able to use Pv-tdTomato mice to verify SGC position and identity. Given the preponderance of cells that generate APs at this age (85%; Fig. 6I), SGCs probably generated APs at even younger ages. Thus, SGCs demonstrate the potential for neural transmission at least 1 day prior to first functional activation of VCN neurons. The presence of spontaneous APs in SGCs as early as E14 (Fig. 6C, upper left) is suggestive that neural communication is probably ongoing in vivo at this early age. Early acquisition by SGCs of AP-generating capability is not dependent upon initiation of hair cell synaptic machinery nor physical contact with hair cells, which occurs at least 2 days later at E16–17 (Koundakjian et al. 2007). Therefore, SGC maturation and signalling is of special significance for potentially influencing downstream auditory centres during the initial phase of circuit assembly, because auditory hair cells do not generate APs until E17.5–18.5 (Marcotti et al. 2003), and even lack spontaneous neurotransmitter release until E16.5 (Johnson et al. 2005).
Figure 8. Timeline for assembly of auditory circuits.
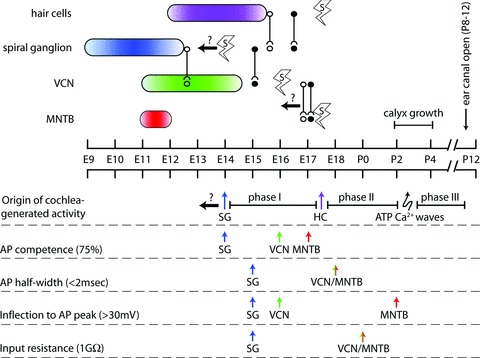
Upper timeline, birthdates of constituent cell groups indicated by coloured ovals. Age of initial connectivity between auditory stations is depicted by lines with open symbols for anatomical proximity (axons have entered postsynaptic cell group), and lines with filled symbols for initial functional communication. Earliest age at which neurons and hair cells generate spontaneous APs is indicated with lightning bolt symbol. Left-facing arrows with question marks denote events that may occur at earlier ages. Lower timeline, three phases of cochlea-generated activity are proposed: phase I from time at which SGCs generate spontaneous activity to time at which hair cells can drive SGC activity, phase II from hair cell-driven SGC activity to onset of ATP generated Ca2+ waves, phase III from onset of ATP Ca2+ waves to onset of sensitivity to airborne sound. Also depicted are temporal sequences comparing auditory stations across measures of AP competence, input resistance, AP breadth and AP height. In general, SGCs develop ahead of VCN and MNTB neurons.
Delay period associated with functional synaptic onset
AN axons first enter the cochlear nucleus of the mouse around E12.5 (Karis et al. 2001; Lu et al. 2011), about 3 days before their synapses become active (Fig. 8). Similarly, AN axons enter the hamster dorsal cochlear nucleus 2 days before synaptic machinery is detectable by electron microscopy (Schweitzer & Cant, 1984). Therefore, either AN entry into the VCN is followed by a waiting period before initiation of physical contact, or synaptogenesis and onset of functional neurotransmission at this stage entails a very slow process following contact. Other sensory systems exhibit delays in synaptogenesis following nerve arrival to CNS target areas. For example, gustatory ganglion innervation of the rostral nucleus of the solitary tract (rNST) (Zhang & Ashwell, 2001) and olfactory mitral cell innervations of pyriform cortex (Schwob et al. 1984; Schwob & Price, 1984; Walz et al. 2006) precedes demonstration of functional synaptic connections (reviewed in Hoffpauir et al. 2009).
We also examined early functional connectivity of a third-order auditory station, the MNTB, which also exhibits a waiting period during circuit assembly, as first described by Kandler & Friauf (1993). VCN fibres first extend into the region of future contralateral MNTB (E14 mouse, Howell et al. 2007; E15 rat, Kandler & Friauf, 1993), providing opportunity for physical interaction with early arriving or migrating MNTB neurons about 3 days before functional interactions have been measured. Axons enter the ipsilateral LSO in the same time frame in both species (Kandler & Friauf, 1993; P. Mathers, personal communication). AN stimulation was sufficient for MNTB neuronal activation as early as E17 (Fig. 7), in agreement with a previous study using stimulation of VCN (Hoffpauir et al. 2010). Interestingly, we found evidence that projections to the MNTB are already selectively contralateral at this age, consistent with adult-like patterning. Given that E17 represents the earliest time at which the MNTB can be discerned in mouse as an individual neuronal cluster, it is not known with certainty whether functional VCN–MNTB connectivity is present even earlier. Notably, analogous projections from chick nucleus magnocellularis (NM) to nucleus laminaris also demonstrate a waiting period between axon arrival and synaptic function (Jackson & Parks, 1982; Young & Rubel, 1986).
Spiral ganglion development precedes other auditory stations
Our data indicate a pattern of sequential synapse development for emergence of lower auditory system circuits, where AN functional connectivity with VCN at E15 precedes onset of VCN to MNTB functional connectivity at E17 (Fig. 8). Even if VCN axons contact MNTB migratory processes (Morest, 1968) or other SOC neurons via ipsilateral projections at earlier ages, appreciable numbers of VCN projection neurons do not acquire AP competence until E16 (Fig. 6I; 79%), limiting activity-related synaptic communication to the MNTB or other SOC nuclei until E16 or later in mice. In addition to the order of synapse formation, consideration of typical features associated with AP maturation at each auditory station also supports a peripheral-to-central developmental pattern (Fig. 8, below timeline). The fraction of VCN neurons that generate APs in response to current injection does not rise above 75% until E16 (Fig. 8, below timeline), while the first recordings of SGCs at E14 have already exceeded this threshold, 85% (11/13) of recorded SGCs. This pattern for higher percentage of AP capability is consistent across late embryonic development for SGCs, VCN neurons and MNTB cells as summarized in Fig. 6I. AP half-width is shorter for SGCs relative to VCN neurons until E18 (Figs 6D and Fig. 8, below timeline); corresponding values for MNTB neurons are longer at each age (Hoffpauir et al. 2010). AP amplitude is generally larger for SGCs relative to VCN neurons (Fig. 6E), and for VCN neurons relative to MNTB neurons (Hoffpauir et al. 2010, their supplemental data; Fig. 8, below timeline). Input resistance values converge for all three cell groups from E17 to P0, but values are lower in SGCs than VCN neurons at E14–16 (Figs 5D, 6H and 8, below timeline) (Hoffpauir et al. 2010). RMP is hyperpolarized in SGCs relative to VCN at all ages (Fig. 6G), and MNTB neurons have comparable values to age-matched VCN cells after E17 (Hoffpauir et al. 2010). LSO neurons in rat generate APs by E18, at least 3 days before birth (Kandler & Friauf, 1995a), but corresponding studies have not been conducted in mice to compare directly with experiments reported here.
Careful investigation of a peripheral-to-central maturational profile in other mammalian sensory systems, aside perhaps from the gustatory system (see above), has not been performed to our knowledge. A peripheral-to-central developmental order for circuit formation does not occur in the avian auditory system. In contrast to the mammalian system, central connections between nucleus magnocellularis (NM) and nucleus laminaris, 2nd and 3rd order neurons, become functional 1–2 days before auditory nerve innervation of NM (Jackson & Parks, 1982; Lu & Trussell, 2007; Gao & Lu, 2008). Therefore, if formation (and potential activity) of more peripheral auditory circuits is instructive for origination and early development of downstream, central auditory stations, it is a developmental strategy not conserved across species.
Activity-dependent signalling for auditory development
Peripheral innervation of the VCN is necessary across a critical period, where removal of AN input leads to large-scale loss of VCN neurons (Harris & Rubel, 2006). In mammals, ablations are limited to postnatal ages and have established the end of the critical period at about P10 (Trune, 1982; Hashisaki & Rubel, 1989; Mostafapour et al. 2000). The onset of this AN critical period in mammals has not been determined, but may begin with functional innervation which we have established at E15–16. Consistent with this idea, critical period onset has been measured in chicks as coincident with initiation of functional innervation of the NM by AN at E11 and neuron survival of the NM appears to be activity dependent (Born & Rubel, 1988; Hashisaki & Rubel, 1989).
Studies designed to silence synaptic communication by elimination of neurotransmitter release via Munc protein knockout demonstrate preservation of early synaptic contacts and brain structure at E12, in the cortex and hippocampus, and at the neuromuscular junction (Verhage et al. 2000; Varoqueaux et al. 2002). However, Munc18-1 knockout results in rampant neurodegeneration of the brainstem by E14.5, and does not specifically examine sensory systems (Verhage et al. 2000). Therefore, it is difficult to extrapolate from these reports the necessity of neurotransmission for initial synaptogenesis (E15–17) in auditory brainstem. Genetic silencing of peripheral activity in mice has been used to manipulate the auditory system from embryonic ages, but observations have only been performed postnatally. Elimination of hair cell AP generation and drastically reduced synaptic transmission by L-type Ca2+ channel knockout (KO) leads to degeneration of a subpopulation of VCN, LSO and MNTB neurons by P4. However, CNS degeneration may alternatively derive from direct effects on these cell groups which also express the channels (Brandt et al. 2003; Hirtz et al. 2011). Degeneration of VCN and MNTB has not been assessed prior to P4 in other genetic hair cell silencing models, including otoferlin and vGlut3 KO mice. In vGlut3 KO, VCN degeneration had begun by P10 (Seal et al. 2008), but was not assessed earlier in either KO strain. Aspects of MNTB to LSO neurotransmission in mice appear normal at P2, and perhaps as late as P8 in vGlut3 KO mice (Noh et al. 2010). Third-order stations in the SOC may demonstrate better survivability following peripheral silencing as they have already formed their own network of efferent contacts, and VCN neurons probably generate increased spontaneous activity from compensatory innervation of alternative sources (Trune & Morgan, 1988; Benson et al. 1997). The degree to which formation of VCN and associated SOC connections require peripheral activity awaits more selective genetic manipulation of individual elements in the auditory circuit and investigation at embryonic ages. Our observations specify timing and possible roles for peripherally generated activity on auditory circuit assembly.
Based in part on embryonic recordings of SGCs, we propose three temporal phases for AN activity-related effects on early auditory CNS development (Fig. 8, origin of cochlea-generated activity). Phase I originates with the onset of SGC AP generation and spontaneous activity by E14. Phase II begins with functional innervation of SGCs by hair cells and AP generation by hair cells (Beutner & Moser, 2001; Marcotti et al. 2003; Johnson et al. 2005), which we suggest would modulate spontaneous AP patterns in SGCs. Phase III begins with increased amplitude and prevalence of ATP-generated hair cell activity, which activates bursting patterns in SGCs that propagate to the MNTB (Tritsch & Bergles, 2010; Tritsch et al. 2010). We observe changes in maturation of VCN neurons that probably relate to activity-driven input under our proposed development phases. The onset of functional innervation of VCN during phase I at E15 immediately precedes or coincides with a drop in input resistance (Fig. 5D), initiation of synaptically evoked APs (Fig. 4A), increase in AP amplitude (Fig. 5B), and the end of a rapid hyperpolarization phase of RMP to values more negative than –50 mV (Fig. 5C). The transition from phase I to phase II at E17.5 is associated with an increase in EPSC amplitude (Fig. 3A), greater reliability for synaptic induction of APs in VCN cells (38% at E16 to 75% at E17), reduction in AP latency and half-width (Fig. 4B and C), appearance of Ih in VCN (Fig. 5A), and increased conduction velocity of AN fibres (Fig. 3C).
Cellular identity in the VCN
Our VCN recordings in embryonic mouse tissue were restricted to the level of eighth nerve entry, dorsal to the nucleus of the acoustic nerve, in an area that contains predominantly globular bushy cells (GBCs), but also stellate neurons (Webster & Trune, 1982). Although this approach restricted the neurons under study relative to the many cell types in the VCN, we did attempt to distinguish globular bushy and stellate cells using physiological criteria. The earliest age this has been achieved is P7 (Wu & Oertel, 1987). In adult VCN, GBCs are associated with slower AP waveform rise/fall, larger AP half-width, and generate spikes with a phasic rather than a tonic pattern in response to current injection steps (Oertel, 1983; Francis & Manis, 2000). These populations, however, are not distinct, and rather form a continuum graded by expression of defining ion channels (Rothman & Manis, 2003). Physiological measures of VCN neurons appeared grouped at some ages (Figs 3–5), but inconsistently across age. Thus, it was difficult to identify subpopulations within our data set.
Morphological assessment of cells labelled during recordings proved indeterminate (not shown), perhaps indicating that GBCs have not yet achieved their characteristic bushy dendritic pattern by P0. In the chick NM, neurons contacted by AN inputs initially show a dendritic morphology of long multipolar projections, and only later appear restricted to single short, highly branched dendrites (Jhaveri & Morest, 1982). A morphological delay of mouse GBCs might be mirrored by presynaptic morphological development, where the large and characteristic endbulbs of Held first appear about the second postnatal week (Limb & Ryugo, 2000). Similarly, early rNST and cerebellar Purkinje cells neurons do not show morphological differentiation and characteristic adult dendritic phenotype until postnatal ages and maturation of biophysical properties (McKay & Turner, 2005; Suwabe et al. 2011). A more concerted study that tracks bushy and stellate populations over the first postnatal week is required to distinguish these cell types at embryonic ages, and is outside of the scope of questions addressed in this manuscript.
Summary
Cochlear ablation and silencing studies have established the necessity of SGC activity as a trophic factor for VCN neuronal survival prior to hearing, but these studies do not address potential instructive signalling of contact or activity in embryonic and neonatal stages of neuronal maturation. Furthermore, early SGC signalling could serve to initiate and direct maturation of downstream auditory stations, such as MNTB, in normal hearing mice. It would be interesting to test for delay of perinatal maturation in central auditory structures with targeted silencing of SGCs between E14 and P0. We demonstrate here that the functional establishment of early stations of mammalian auditory circuits occurs during late embryonic ages, and that neuronal physiological maturation progresses in tandem with synaptic maturation over a period lasting several days. These studies provide an essential timeline to investigate in more detail mechanisms for early circuit assembly in the brainstem auditory system.
Acknowledgments
We thank Marlin Dehoff and David Sims for assistance with animal husbandry and colony maintenance, and Pete Mathers for review of the manuscript. This work was supported by the following funding: NIH F32 DC105462 to G.S.M., NIH DC007695 to G.A.S. and NIH/NCRR CoBRE P30 RR031155 to the WVU Centre for Neuroscience.
Glossary
Abbreviations
- AN
auditory nerve
- AP
action potential
- CN
cochlear nucleus
- E
embryonic
- GBC
globular bushy cell
- KO
knockout
- LSO
lateral superior olive
- MNTB
medial nucleus of the trapezoid body
- NM
nucleus magnocellularis
- rNST
rostral nucleus of the solitary tract
- P
postnatal
- RMP
resting membrane potential
- SGC
spiral ganglion cell
- SMP
standard membrane potential
- SOC
superior olivary complex
- VCN
ventral cochlear nucleus
- vGlut
vesicular glutamate transporter
Author contributions
G.S.M. and G.A.S. cooperatively conceived and designed all experiments, analysed data, interpreted results, authored and revised the manuscript. G.S.M. performed experiments, data analysis, and figure creation. All experiments were performed at West Virginia University Health Sciences Centre. The final version of this manuscript was approved by both authors.
Supplementary material
Supplemental Figure 1
As a service to our authors and readers, this journal provides supporting information supplied by the authors. Such materials are peer-reviewed and may be re-organized for online delivery, but are not copy-edited or typeset. Technical support issues arising from supporting information (other than missing files) should be addressed to the authors
References
- Adamson CL, Reid MA, Mo ZL, Bowne-English J, Davis RL. Firing features and potassium channel content of murine spiral ganglion neurons vary with cochlear location. J Comp Neurol. 2002;447:331–350. doi: 10.1002/cne.10244. [DOI] [PubMed] [Google Scholar]
- Benson CG, Gross JS, Suneja SK, Potashner SJ. Synaptophysin immunoreactivity in the cochlear nucleus after unilateral cochlear or ossicular removal. Synapse. 1997;25:243–257. doi: 10.1002/(SICI)1098-2396(199703)25:3<243::AID-SYN3>3.0.CO;2-B. [DOI] [PubMed] [Google Scholar]
- Beutner D, Moser T. The presynaptic function of mouse cochlear inner hair cells during development of hearing. J Neurosci. 2001;21:4593–4599. doi: 10.1523/JNEUROSCI.21-13-04593.2001. [DOI] [PMC free article] [PubMed] [Google Scholar]
- Born DE, Rubel EW. Afferent influences on brain stem auditory nuclei of the chicken: presynaptic action potentials regulate protein synthesis in nucleus magnocellularis neurons. J Neurosci. 1988;8:901–919. doi: 10.1523/JNEUROSCI.08-03-00901.1988. [DOI] [PMC free article] [PubMed] [Google Scholar]
- Brandt A, Striessnig J, Moser T. CaV1.3 channels are essential for development and presynaptic activity of cochlear inner hair cells. J Neurosci. 2003;23:10832–10840. doi: 10.1523/JNEUROSCI.23-34-10832.2003. [DOI] [PMC free article] [PubMed] [Google Scholar]
- Bruce LL, Kingsley J, Nichols DH, Fritzsch B. The development of vestibulocochlear efferents and cochlear afferents in mice. Int J Dev Neurosci. 1997;15:671–692. doi: 10.1016/s0736-5748(96)00120-7. [DOI] [PubMed] [Google Scholar]
- Deng M, Pan L, Xie X, Gan L. Differential expression of LIM domain-only (LMO) genes in the developing mouse inner ear. Gene Expr Patterns. 2006;6:857–863. doi: 10.1016/j.modgep.2006.02.005. [DOI] [PubMed] [Google Scholar]
- Fitzgerald M. The post-natal development of cutaneous afferent fibre input and receptive field organization in the rat dorsal horn. J Physiol. 1985;364:1–18. doi: 10.1113/jphysiol.1985.sp015725. [DOI] [PMC free article] [PubMed] [Google Scholar]
- Francis HW, Manis PB. Effects of deafferentation on the electrophysiology of ventral cochlear nucleus neurons. Hear Res. 2000;149:91–105. doi: 10.1016/s0378-5955(00)00165-9. [DOI] [PubMed] [Google Scholar]
- Gao H, Lu Y. Early development of intrinsic and synaptic properties of chicken nucleus laminaris neurons. Neuroscience. 2008;153:131–143. doi: 10.1016/j.neuroscience.2008.01.059. [DOI] [PubMed] [Google Scholar]
- Harris JA, Rubel EW. Afferent regulation of neuron number in the cochlear nucleus: cellular and molecular analyses of a critical period. Hear Res. 2006;216–217:127–137. doi: 10.1016/j.heares.2006.03.016. [DOI] [PubMed] [Google Scholar]
- Hashisaki GT, Rubel EW. Effects of unilateral cochlea removal on anteroventral cochlear nucleus neurons in developing gerbils. J Comp Neurol. 1989;283:5–73. doi: 10.1002/cne.902830402. [DOI] [PubMed] [Google Scholar]
- Hippenmeyer S, Vrieseling E, Sigrist M, Portmann T, Laengle C, Ladle DR, Arber S. A developmental switch in the response of DRG neurons to ETS transcription factor signaling. PLoS Biol. 2005;3:e159. doi: 10.1371/journal.pbio.0030159. [DOI] [PMC free article] [PubMed] [Google Scholar]
- Hirtz JJ, Boesen M, Braun N, Deitmer JW, Kramer F, Lohr C, Muller B, Nothwang HG, Striessnig J, Lohrke S, Friauf E. Cav1.3 calcium channels are required for normal development of the auditory brainstem. J Neurosci. 2011;31:8280–8294. doi: 10.1523/JNEUROSCI.5098-10.2011. [DOI] [PMC free article] [PubMed] [Google Scholar]
- Hoffpauir BK, Kolson DR, Mathers PH, Spirou GA. Maturation of synaptic partners: functional phenotype and synaptic organization tuned in synchrony. J Physiol. 2010;588:4365–4385. doi: 10.1113/jphysiol.2010.198564. [DOI] [PMC free article] [PubMed] [Google Scholar]
- Hoffpauir BK, Marrs GS, Mathers PH, Spirou GA. Does the brain connect before the periphery can direct? A comparison of three sensory systems in mice. Brain Res. 2009;1277:115–129. doi: 10.1016/j.brainres.2009.02.050. [DOI] [PMC free article] [PubMed] [Google Scholar]
- Howell DM, Morgan WJ, Jarjour AA, Spirou GA, Berrebi AS, Kennedy TE, Mathers PH. Molecular guidance cues necessary for axon pathfinding from the ventral cochlear nucleus. J Comp Neurol. 2007;504:533–549. doi: 10.1002/cne.21443. [DOI] [PubMed] [Google Scholar]
- Jackson H, Parks TN. Functional synapse elimination in the developing avian cochlear nucleus with simultaneous reduction in cochlear nerve axon branching. J Neurosci. 1982;2:1736–1743. doi: 10.1523/JNEUROSCI.02-12-01736.1982. [DOI] [PMC free article] [PubMed] [Google Scholar]
- Jhaveri S, Morest DK. Sequential alterations of neuronal architecture in nucleus magnocellularis of the developing chicken: a Golgi study. Neuroscience. 1982;7:837–853. doi: 10.1016/0306-4522(82)90046-x. [DOI] [PubMed] [Google Scholar]
- Johnson SL, Marcotti W, Kros CJ. Increase in efficiency and reduction in Ca2+ dependence of exocytosis during development of mouse inner hair cells. J Physiol. 2005;563:177–191. doi: 10.1113/jphysiol.2004.074740. [DOI] [PMC free article] [PubMed] [Google Scholar]
- Kandler K, Friauf E. Pre- and postnatal development of efferent connections of the cochlear nucleus in the rat. J Comp Neurol. 1993;328:161–184. doi: 10.1002/cne.903280202. [DOI] [PubMed] [Google Scholar]
- Kandler K, Friauf E. Development of electrical membrane properties and discharge characteristics of superior olivary complex neurons in fetal and postnatal rats. Eur J Neurosci. 1995a;7:1773–1790. doi: 10.1111/j.1460-9568.1995.tb00697.x. [DOI] [PubMed] [Google Scholar]
- Kandler K, Friauf E. Development of glycinergic and glutamatergic synaptic transmission in the auditory brainstem of perinatal rats. J Neurosci. 1995b;15:6890–6904. doi: 10.1523/JNEUROSCI.15-10-06890.1995. [DOI] [PMC free article] [PubMed] [Google Scholar]
- Karis A, Pata I, van Doorninck JH, Grosveld F, de Zeeuw CI, de Caprona D, Fritzsch B. Transcription factor GATA-3 alters pathway selection of olivocochlear neurons and affects morphogenesis of the ear. J Comp Neurol. 2001;429:615–630. doi: 10.1002/1096-9861(20010122)429:4<615::aid-cne8>3.0.co;2-f. [DOI] [PubMed] [Google Scholar]
- Koundakjian EJ, Appler JL, Goodrich LV. Auditory neurons make stereotyped wiring decisions before maturation of their targets. J Neurosci. 2007;27:14078–14088. doi: 10.1523/JNEUROSCI.3765-07.2007. [DOI] [PMC free article] [PubMed] [Google Scholar]
- Limb CJ, Ryugo DK. Development of primary axosomatic endings in the anteroventral cochlear nucleus of mice. J Assoc Res Otolaryngol. 2000;1:103–119. doi: 10.1007/s101620010032. [DOI] [PMC free article] [PubMed] [Google Scholar]
- Lin X, Chen S. Endogenously generated spontaneous spiking activities recorded from postnatal spiral ganglion neurons in vitro. Brain Res Dev Brain Res. 2000;119:297–305. doi: 10.1016/s0165-3806(99)00169-8. [DOI] [PubMed] [Google Scholar]
- Liu Q, Davis RL. Regional specification of threshold sensitivity and response time in CBA/CaJ mouse spiral ganglion neurons. J Neurophysiol. 2007;98:2215–2222. doi: 10.1152/jn.00284.2007. [DOI] [PubMed] [Google Scholar]
- Lizarraga I, Chambers JP, Johnson CB. Developmental changes in threshold, conduction velocity, and depressive action of lignocaine on dorsal root potentials from neonatal rats are associated with maturation of myelination. Can J Physiol Pharmacol. 2007;85:251–263. doi: 10.1139/y07-021. [DOI] [PubMed] [Google Scholar]
- Lohrke S, Srinivasan G, Oberhofer M, Doncheva E, Friauf E. Shift from depolarizing to hyperpolarizing glycine action occurs at different perinatal ages in superior olivary complex nuclei. Eur J Neurosci. 2005;22:2708–2722. doi: 10.1111/j.1460-9568.2005.04465.x. [DOI] [PubMed] [Google Scholar]
- Lu CC, Appler JM, Houseman EA, Goodrich LV. Developmental profiling of spiral ganglion neurons reveals insights into auditory circuit assembly. J Neurosci. 2011;31:10903–10918. doi: 10.1523/JNEUROSCI.2358-11.2011. [DOI] [PMC free article] [PubMed] [Google Scholar]
- Lu T, Trussell LO. Development and elimination of endbulb synapses in the chick cochlear nucleus. J Neurosci. 2007;27:808–817. doi: 10.1523/JNEUROSCI.4871-06.2007. [DOI] [PMC free article] [PubMed] [Google Scholar]
- McKay BE, Turner RW. Physiological and morphological development of the rat cerebellar Purkinje cell. J Physiol. 2005;567:829–850. doi: 10.1113/jphysiol.2005.089383. [DOI] [PMC free article] [PubMed] [Google Scholar]
- Madisen L, Zwingman TA, Sunkin SM, Oh SW, Zariwala HA, Gu H, Ng LL, Palmiter RD, Hawrylycz MJ, Jones AR, Lein ES, Zeng H. A robust and high-throughput Cre reporting and characterization system for the whole mouse brain. Nat Neurosci. 2010;13:133–140. doi: 10.1038/nn.2467. [DOI] [PMC free article] [PubMed] [Google Scholar]
- Maklad A, Kamel S, Wong E, Fritzsch B. Development and organization of polarity-specific segregation of primary vestibular afferent fibers in mice. Cell Tissue Res. 2010;340:303–321. doi: 10.1007/s00441-010-0944-1. [DOI] [PMC free article] [PubMed] [Google Scholar]
- Marcotti W, Johnson SL, Holley MC, Kros CJ. Developmental changes in the expression of potassium currents of embryonic, neonatal and mature mouse inner hair cells. J Physiol. 2003;548:383–400. doi: 10.1113/jphysiol.2002.034801. [DOI] [PMC free article] [PubMed] [Google Scholar]
- Martin MR, Rickets C. Histogenesis of the cochlear nucleus of the mouse. J Comp Neurol. 1981;197:169–184. doi: 10.1002/cne.901970113. [DOI] [PubMed] [Google Scholar]
- Mikaelian D, Ruben RJ. Development of hearing in the normal CBa-J mouse. Acta Otol. 1965;59:451–461. [Google Scholar]
- Mo ZL, Davis RL. Endogenous firing patterns of murine spiral ganglion neurons. J Neurophysiol. 1997;77:1294–1305. doi: 10.1152/jn.1997.77.3.1294. [DOI] [PubMed] [Google Scholar]
- Morest DK. The collateral system of the medial nucleus of the trapezoid body of the cat, its neuronal architecture and relation to the olivo-cochlear bundle. Brain Res. 1968;9:288–311. doi: 10.1016/0006-8993(68)90235-7. [DOI] [PubMed] [Google Scholar]
- Mostafapour SP, Cochran SL, Del Puerto NM, Rubel EW. Patterns of cell death in mouse anteroventral cochlear nucleus neurons after unilateral cochlea removal. J Comp Neurol. 2000;426:561–571. doi: 10.1002/1096-9861(20001030)426:4<561::aid-cne5>3.0.co;2-g. [DOI] [PubMed] [Google Scholar]
- Noh J, Seal RP, Garver JA, Edwards RH, Kandler K. Glutamate co-release at GABA/glycinergic synapses is crucial for the refinement of an inhibitory map. Nat Neurosci. 2010;13:232–238. doi: 10.1038/nn.2478. [DOI] [PMC free article] [PubMed] [Google Scholar]
- Oertel D. Synaptic responses and electrical properties of cells in brain slices of the mouse anteroventral cochlear nucleus. J Neurosci. 1983;3:2043–2053. doi: 10.1523/JNEUROSCI.03-10-02043.1983. [DOI] [PMC free article] [PubMed] [Google Scholar]
- Penn AA, Shatz CJ. Brain waves and brain wiring: the role of endogenous and sensory-driven neural activity in development. Pediatr Res. 1999;45:447–458. doi: 10.1203/00006450-199904010-00001. [DOI] [PubMed] [Google Scholar]
- Pierce ET. Histogenesis of the dorsal and ventral cochlear nuclei in the mouse. An autoradiographic study. J Comp Neurol. 1967;131:27–54. doi: 10.1002/cne.901310104. [DOI] [PubMed] [Google Scholar]
- Pierce ET. Time of origin of neurons in the brain stem of the mouse. Prog Brain Res. 1973;40:53–65. doi: 10.1016/S0079-6123(08)60679-2. [DOI] [PubMed] [Google Scholar]
- Rothman JS, Manis PB. Differential expression of three distinct potassium currents in the ventral cochlear nucleus. J Neurophysiol. 2003;89:3070–3082. doi: 10.1152/jn.00125.2002. [DOI] [PubMed] [Google Scholar]
- Rubel EW, Fritzsch B. Auditory system development: primary auditory neurons and their targets. Annu Rev Neurosci. 2002;25:51–101. doi: 10.1146/annurev.neuro.25.112701.142849. [DOI] [PubMed] [Google Scholar]
- Ruben RJ. Development of the inner ear of the mouse: a radioautographic study of terminal mitoses. Acta Otolaryngol. 1967;220(Suppl):1–44. [PubMed] [Google Scholar]
- Schweitzer L, Cant NB. Development of the cochlear innervation of the dorsal cochlear nucleus of the hamster. J Comp Neurol. 1984;225:228–243. doi: 10.1002/cne.902250208. [DOI] [PubMed] [Google Scholar]
- Schwob JE, Haberly LB, Price JL. The development of physiological responses of the piriform cortex in rats to stimulation of the lateral olfactory tract. J Comp Neurol. 1984;223:223–237. doi: 10.1002/cne.902230206. [DOI] [PubMed] [Google Scholar]
- Schwob JE, Price JL. The development of axonal connections in the central olfactory system of rats. J Comp Neurol. 1984;223:177–202. doi: 10.1002/cne.902230204. [DOI] [PubMed] [Google Scholar]
- Seal RP, Akil O, Yi E, Weber CM, Grant L, Yoo J, Clause A, Kandler K, Noebels JL, Glowatzki E, Lustig LR, Edwards RH. Sensorineural deafness and seizures in mice lacking vesicular glutamate transporter 3. Neuron. 2008;57:263–275. doi: 10.1016/j.neuron.2007.11.032. [DOI] [PMC free article] [PubMed] [Google Scholar]
- Shaner NC, Campbell RE, Steinbach PA, Giepmans BN, Palmer AE, Tsien RY. Improved monomeric red, orange and yellow fluorescent proteins derived from Discosoma sp. red fluorescent protein. Nat Biotechnol. 2004;22:1567–1572. doi: 10.1038/nbt1037. [DOI] [PubMed] [Google Scholar]
- Suwabe T, Mistretta CM, Krull C, Bradley RM. Pre and postnatal differences in membrane, action potential and ion channel properties of rostral nucleus of the solitary tract neurons. J Neurophysiol. 2011;106:2709–2719. doi: 10.1152/jn.00178.2011. [DOI] [PMC free article] [PubMed] [Google Scholar]
- Tritsch NX, Bergles DE. Developmental regulation of spontaneous activity in the Mammalian cochlea. J Neurosci. 2010;30:1539–1550. doi: 10.1523/JNEUROSCI.3875-09.2010. [DOI] [PMC free article] [PubMed] [Google Scholar]
- Tritsch NX, Rodriguez-Contreras A, Crins TT, Wang HC, Borst JG, Bergles DE. Calcium action potentials in hair cells pattern auditory neuron activity before hearing onset. Nat Neurosci. 2010;13:1050–1052. doi: 10.1038/nn.2604. [DOI] [PMC free article] [PubMed] [Google Scholar]
- Trune DR. Influence of neonatal cochlear removal on the development of mouse cochlear nucleus: I. Number, size, and density of its neurons. J Comp Neurol. 1982;209:409–424. doi: 10.1002/cne.902090410. [DOI] [PubMed] [Google Scholar]
- Trune DR, Morgan CR. Influence of developmental auditory deprivation on neuronal ultrastructure in the mouse anteroventral cochlear nucleus. Brain Res. 1988;470:304–308. doi: 10.1016/0165-3806(88)90249-0. [DOI] [PubMed] [Google Scholar]
- Varoqueaux F, Sigler A, Rhee JS, Brose N, Enk C, Reim K, Rosenmund C. Total arrest of spontaneous and evoked synaptic transmission but normal synaptogenesis in the absence of Munc13-mediated vesicle priming. Proc Natl Acad Sci U S A. 2002;99:9037–9042. doi: 10.1073/pnas.122623799. [DOI] [PMC free article] [PubMed] [Google Scholar]
- Verhage M, Maia AS, Plomp JJ, Brussaard AB, Heeroma JH, Vermeer H, Toonen RF, Hammer RE, van den Berg TK, Missler M, Geuze HJ, Sudhof TC. Synaptic assembly of the brain in the absence of neurotransmitter secretion. Science. 2000;287:864–869. doi: 10.1126/science.287.5454.864. [DOI] [PubMed] [Google Scholar]
- Walz A, Omura M, Mombaerts P. Development and topography of the lateral olfactory tract in the mouse: imaging by genetically encoded and injected fluorescent markers. J Neurobiol. 2006;66:835–846. doi: 10.1002/neu.20266. [DOI] [PubMed] [Google Scholar]
- Webster DB, Trune DR. Cochlear nuclear complex of mice. Am J Anat. 1982;163:103–130. doi: 10.1002/aja.1001630202. [DOI] [PubMed] [Google Scholar]
- Wu SH, Oertel D. Maturation of synapses and electrical properties of cells in the cochlear nuclei. Hear Res. 1987;30:99–110. doi: 10.1016/0378-5955(87)90187-0. [DOI] [PubMed] [Google Scholar]
- Young SR, Rubel EW. Embryogenesis of arborization pattern and topography of individual axons in N. laminaris of the chicken brain stem. J Comp Neurol. 1986;254:425–459. doi: 10.1002/cne.902540402. [DOI] [PubMed] [Google Scholar]
- Zhang LL, Ashwell KW. The development of cranial nerve and visceral afferents to the nucleus of the solitary tract in the rat. Anat Embryol (Berl) 2001;204:135–151. doi: 10.1007/s004290100185. [DOI] [PubMed] [Google Scholar]
- Zheng QY, Johnson KR, Erway LC. Assessment of hearing in 80 inbred strains of mice by ABR threshold analyses. Hear Res. 1999;130:94–107. doi: 10.1016/s0378-5955(99)00003-9. [DOI] [PMC free article] [PubMed] [Google Scholar]
Associated Data
This section collects any data citations, data availability statements, or supplementary materials included in this article.