

Abstract
In the rd1 mouse model for retinal degeneration, the loss of photoreceptors results in oscillatory activity (∼10–20 Hz) within the remnant electrically coupled network of retinal ON cone bipolar and AII amacrine cells. We tested the role of hyperpolarization-activated currents (Ih), voltage-gated Na+ channels and gap junctions in mediating such oscillatory activity. Blocking Ih (1 mm Cs+) hyperpolarized the network and augmented activity, while antagonizing voltage-dependent Na+ channels (1 μm TTX) abolished oscillatory activity in the AII amacrine–ON cone bipolar cell network. Voltage-gated Na+ channels were only observed in AII amacrine cells, implicating these cells as major drivers of activity. Pharmacologically uncoupling the network (200 μm meclofenamic acid (MFA)) blocked oscillations in all cells indicating that Na+ channels exert their influence over multiple cell types within the network. In wt retina, occluding photoreceptor inputs to bipolar cells (10 μm NBQX and 50 μm l-AP4) resulted in a mild (∼10 mV) hyperpolarization and the induction of oscillatory activity within the AII amacrine–ON cone bipolar cell network. These oscillations had similar properties to those observed in rd1 retina, suggesting that no major degeneration-induced network rewiring is required to trigger spontaneous oscillations. Finally, we constructed a simplified computational model that exhibited Na+ channel-dependent network oscillations. In this model, mild heterogeneities in channel densities between individual neurons reproduced our experimental findings. These results indicate that TTX-sensitive Na+ channels in AII amacrine cells trigger degeneration-induced network oscillations, which provide a persistent synaptic drive to downstream remnant neurons, thus appearing to replace photoreceptors as the principal drivers of retinal activity.
Key points
In mouse models for retinal degeneration, photoreceptor death leads to membrane oscillation in the remnant AII amacrine–ON cone bipolar cell network through an unknown mechanism.
We found such oscillations require voltage-gated Na+ channels and gap junctions but not hyperpolarization-activated currents (Ih).
Na+ channels are expressed predominantly in AII amacrine cells and Ih in ON cone bipolar cells, and appear to interact via gap junctions to shape oscillations.
Similar intrinsic oscillations arose in the wild-type (wt) AII amacrine–ON cone bipolar cell network when photoreceptor inputs to bipolar cells were pharmacologically occluded.
Computational modelling captures experimental findings when a low level of cellular heterogeneity is introduced in the coupled network.
These unique insights into the cellular mechanisms underlying spontaneous activity in the degenerating retina might aid in designing the most effective strategies to restore vision using retinal prosthesis.
Introduction
The loss of photoreceptors during retinal degeneration is accompanied by spontaneous network oscillations in the rd1 mouse retina (Ye & Goo, 2007; Margolis et al. 2008; Stasheff, 2008; Menzler & Zeck, 2011). Several lines of evidence suggest that these oscillations arise in the electrically coupled network of ON cone bipolar and AII amacrine cells. First, direct recordings from ON cone bipolar and AII amacrine cells reveal a ∼10 Hz membrane oscillation that does not rely on chemical synaptic transmission (Borowska et al. 2011). Second, pacemaking activity in postsynaptic rd1 ganglion (Margolis et al. 2008; Stasheff, 2008) and amacrine cells (Borowska et al. 2011) largely depends on excitatory synaptic inputs from bipolar cells. Third, spontaneous synaptic inputs to ganglion cells persist during pharmacological blockade of residual photoreceptor, rod-bipolar and inhibitory amacrine cell synapses, suggesting that oscillatory activity originates within presynaptic excitatory neurons (Borowska et al. 2011) rather than from dynamic inhibitory feedback properties of the remnant circuitry (Margolis & Detwiler, 2011). While these studies established an important role for the electrically coupled AII amacrine–ON cone bipolar cell network in driving rhythmic activity in the rd1 retina (Borowska et al. 2011), the biophysical underpinnings of this spontaneous activity remain largely unknown.
Pacemaking activity in other parts of the CNS often arises from non-linear interactions between currents that are activated near resting potentials, including the hyperpolarization-activated currents (Ih), and voltage-gated Ca2+ and Na+ currents (Hausser et al. 2004). In wt retina, voltage-gated Ca2+ channels endow ON cone bipolar cells with oscillatory potentials (Burrone & Lagnado, 1997). However, oscillations in rd1 AII amacrine–ON cone bipolar cells are insensitive to blockers of voltage-gated Ca2+ channels, suggesting that they are mediated by other channel types (Borowska et al. 2011). Here we investigated whether Na+ channels which are known to be expressed in AII amacrine cells (Nelson, 1982; Boos et al. 1993; Wu et al. 2011; Demb & Singer, 2012) and/or Ih which is known to be expressed in ON cone bipolar cells (Muller et al. 2003; Ivanova & Muller, 2006; Fyk-Kolodziej & Pourcho, 2007) could drive oscillations in rd1 retina as they do in other networks (reviewed in Häusser et al. 2004). In addition, it remains unclear whether activity originates within individual AII amacrine cells or ON cone bipolar cells or whether activity requires multiple elements within the coupled network. We therefore also examined the role of gap junctions in generating and propagating activity in the rd1 AII amacrine–ON cone bipolar cell network.
We recorded activity from morphologically identified cells and used pharmacological tools to demonstrate a critical role for Na+ channels in initiating degeneration-induced retinal network oscillations. These channels appear to drive depolarizing activity in multiple AII amacrine cells connected by gap junctions and are strongly regulated by cationic conductances expressed in coupled ON bipolar cells that influence the network resting potential. Using a computational model we explored how mild changes in membrane potential could result in the generation of oscillations within the AII amacrine–ON cone bipolar cell network.
Methods
Experiments were carried out in the rd1 mouse line (B6.C3-Pde6brd1 Hps4le/J; Jackson Laboratories, Bar Harbour, ME, USA) and wild-type mice (C57BL/6J). Animal procedures followed Canadian Council for Animal Care guidelines and were approved by the University of Victoria and Dalhousie University's Committee for Laboratory Animals.
Whole-cell recordings
Electrophysiological measurements were made in whole-mount retina, as previously described (Borowska et al. 2011). The retina was continuously bathed with a Ringer's solution containing (in mm): 110 NaCl, 2.5 KCl, 1 CaCl2, 1.6 MgCl2, 10 dextrose and 22 NaHCO3 that was bubbled with 95% O2–5% CO2 to produce a pH of 7.4. Experiments were performed at 36–37°C. For voltage-clamp experiments, electrodes contained (in mm): 112.5 CsCH3SO3, 9.7 KCl, 1 MgCl2, 1.5 EGTA, 10 Hepes, 4 ATP Mg2+, 0.5 GTP Na3+ and 0.02 Alexa 594. The pH was adjusted to 7.4 with CsOH. For current-clamp experiments electrodes contained (in mm): 115 potassium gluconate, 5 KCl, 1 MgCl2, 10 EGTA, 10 Hepes, 4 ATP Mg2+, 0.5 GTP Na3+ and 0.02 Alexa 594. Recordings were made with a Multiclamp 700B amplifier (Molecular Devices Inc., Sunnyvale, CA, USA). Analog signals were filtered at 1 kHz and sampled at 2 kHz with the Digidata 1400 A/D board (Molecular Devices) under control of pCLAMP10 (Molecular Devices). Junction potentials were calculated to be 14 mV for K+-based solutions and 11 mV for Cs+-based solutions and were corrected offline. After physiological recordings, cells were imaged using a custom two-photon imaging system and identified as outlined previously (Borowska et al. 2011).
Light stimulation
Light stimuli were generated with a DLP projector (Texas Instruments; refresh rate 75 Hz) controlled with custom software. The ambient background intensity, as measured with a calibrated spectrophotometer (USB2000; Ocean Optics, Dunedin, FL, USA) was 3 × 10¹⁰ photons s−1 cm−2 (sampled at 500 nm) which is equivalent to ∼4 photoisomerizations rod−1 s−1 (Applebury et al. 2000; Lyubarsky et al. 2004). This intensity level is considered to be in the mesopic range (Umino et al. 2008). Four hundred micron spots (93% Michelson contrast) centred over the cell (soma) of interest, were focused on the outer segments of the photoreceptors using the sub-stage condenser.
Analysis
Amplitude of oscillations was estimated by the standard deviation of the membrane potential. Frequency characteristics of oscillatory activity were estimated by constructing power spectrum graphs (binned at 1.22–0.48 Hz), from 10 to 30 s segments of representative traces. Peaks in the power spectrum were confirmed by visual inspection of raw data. Paired t tests were used to assess pharmacological experiments. Data in graphs represent mean ± SEM.
Results
Gap junctions and Na+ channels, but not Ih, support network oscillations
To test the role of Ih, Na+ currents and gap junctions in mediating oscillations, we first examined how pharmacologically blocking these channels affected pacemaking activity. All whole-cell electrophysiological measurements were made from ON cone bipolar, AII amacrine or ganglion cells in whole-mount retinal preparations. Alexa 594 was added to the intracellular patch solution allowing cells to be visualized and identified immediately after physiological recordings, using two-photon imaging methods.
Figure 1A illustrates an image stack of an Alexa 594-filled ON cone bipolar cell and an AII amacrine cell, rotated 90 deg to reveal their characteristic morphologies. Membrane oscillations recorded in rd1 AII amacrine and ON cone bipolar cells, prior to imaging, are illustrated in Fig. 1B. Spectral analysis revealed a clear peak in the power spectrum indicating the fundamental frequency of the oscillation (Fig. 1C: for rd1 ON cone bipolar cells), as noted previously (Borowska et al. 2011). On average, oscillations were of similar frequencies in ON cone bipolar cells (15.1 ± 1.3 Hz; n = 14) and in AII amacrine cells (16.8 ± 3.2 Hz: n = 5; P > 0.5), and therefore data from these cells were pooled in subsequent pharmacological experiments.
Figure 1. Intrinsic membrane oscillations in the rd1 cone bipolar–AII amacrine cell network rely on voltage-gated Na+ channels, but not Ih.
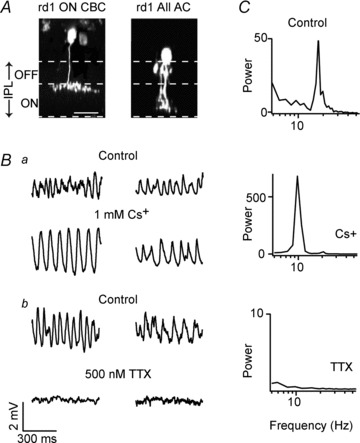
A, two-photon image stacks of an rd1 ON cone bipolar (left) and an AII amacrine cell (right) obtained immediately after physiological recordings (shown in B) in a whole-mount retina. Stacks were rotated 90 deg to depict the depth profiles each of these cells. The dashed lines demarcate the boundaries of the inner plexiform layer (IPL) as assessed by weak ganglion and amacrine cell staining, as well as the putative boundary between the ON and OFF sublaminae (set at 40% of the IPL). Scale bar, 10 μm. B, current-clamp recordings from rd1 ON cone bipolar (left panels) and AII amacrine cells (right panels) in control (upper panels a and b) and in the presence of 1 mm Cs+ (a) or 1 μm TTX (b, recorded in a different ON cone bipolar cell). C, the power spectra of membrane potential of the ON cone bipolar cells shown in Ba and b in different drug conditions as indicated.
Application of 1 mm Cs+ hyperpolarized the membrane potential of both ON cone bipolar cells and AII amacrine cells by 8.2 ± 2.1 mV (n = 7; 4 ON cone bipolar and 3 AII amacrine cells; P = 0.001), suggesting that the predominant effect of Cs+ was to block Ih that was active at rest (Bal & McCormick, 1997). However, this does not preclude the possibility that Cs+ also blocks low-threshold or inward-rectifier K+ channels (Demontis et al. 2009; Tang et al. 2010). Concomitant with hyperpolarization, Cs+ reduced the frequency of oscillations in both ON cone bipolar and AII amacrine cells to an average of 6.4 ± 2.1 Hz (P = 0.001; Fig. 1Ba) but significantly increased the power at the peak oscillatory frequency by 715 ± 207% (P < 0.01; Fig. 1C). While these findings rule out a critical role for Ih in generating oscillations, they suggest it can strongly modulate rhythmic activity.
In contrast to blocking Ih, antagonizing voltage-gated Na+ channels with 0.5–1 μm TTX completely abolished oscillatory activity in rd1 AII amacrine and ON cone bipolar cells (n = 11; 7 ON cone bipolar and 4 AII amacrine cells; Fig. 1Bb), indicating a vital role for these channels in pacemaking activity. In the presence of TTX, no significant peaks were apparent in the power spectrum (Fig. 1C). Furthermore, application of TTX resulted in a mild hyperpolarization of the AII amacrine–ON cone bipolar cell network (3.1 ± 0.8 mV; n = 5; 2 AII amacrine cells and 3 ON cone bipolar cells; data not shown). These direct recordings from rd1 ON cone bipolar cells and AII amacrine cells implicate Na+ channels as a critical element in rhythmogenesis. These findings are surprising in view of a recent study that suggested a non-obligatory role for TTX-sensitive Na+ channels in mediating network oscillations (Menzler & Zeck, 2011; see Discussion).
To test whether individual AII amacrine and ON cone bipolar cells could support pacemaking activity or whether a coupled network was required, we next examined the effects of meclofenamic acid (MFA, 200 μm), a relatively specific gap junction blocker (Manookin et al. 2008; Veruki & Hartveit, 2009). Application of MFA strongly suppressed the amplitude of membrane oscillations (Fig. 2A and B; 74 ± 18% inhibition; n = 10; 3 rd1 AII amacrine cells and 7 rd1 ON cone bipolar cells). In the presence of MFA, no peaks in the power spectrum were evident. The time course of MFA-induced inhibition of oscillatory activity measured in AII amacrine–ON cone bipolar cell activity could be well described with a single exponential function with a time constant of 6.0 ± 0.8 min, consistent with the slow action of MFA on gap junctions (Fig. 2B; Veruki & Hartveit, 2009). In addition, the application of MFA was accompanied by an increase in apparent membrane input resistance (195 ± 33% compared with control; n = 5; P = 0.026; Fig. 2A; Veruki & Hartveit, 2009). These data suggest that gap junctions are critical for the generation of oscillations. Thus, individually, neither ON cone bipolar nor AII amacrine cells appear to have the intrinsic capacity to generate oscillations (but see Cembrowski et al. 2012).
Figure 2. The gap junction antagonist MFA blocks oscillations in the AII amacrine–ON cone bipolar cell network.
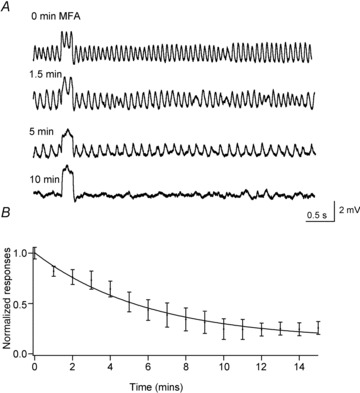
A, oscillatory activity measured in current clamp from an rd1 ON cone bipolar cell at various times (as indicated on the left) after the onset of an application of 200 μm MFA. Each trace includes the membrane response to a 20 pA depolarizing current pulse lasting for 200 ms. B, the normalized standard deviation of membrane potential recorded from 3 rd1 AII amacrine cells and 7 rd1 ON cone bipolar cells is plotted as a function of time. The data are fitted with a single exponential function.
Ih currents are expressed in rd1 ON cone bipolar cells and Na+ currents are expressed in rd1 AII amacrine cells
Since we found that both Ih and Na+ currents influenced spontaneous oscillations in rd1 retina, we next characterized their functional expression pattern in AII amacrine and ON cone bipolar cells in the degenerated retina. Figure 3A illustrates typical voltage-gated currents measured in rd1 AII amacrine and ON cone bipolar cells in response to brief voltage pulses. Depolarization positive to −70 mV evoked small regenerative inward currents in AII amacrine cells, characteristic of those mediated by Na+ channels (Fig. 3Aa; Wu et al. 2011). These currents appeared at a range of potentials, probably resulting from the poor space-clamp of the electrically coupled network of AII amacrine cells (Tian et al. 2010). Moreover, with stronger membrane depolarizations these spikelets could be triggered at extremely high rates (∼300 Hz) although their amplitude was decreased (Fig. 3Aa). In contrast to AII amacrine cells, such regenerative currents were never observed in bipolar cell recordings (Fig. 3Ab; n = 20; note that capacitive currents have not been corrected). Figure 3Ac compares the frequency of inward currents as a function of voltage for AII amacrine and ON cone bipolar cells (5 rd1 AII amacrine cells and 8 rd1 ON cone bipolar cells). Thus, in the rd1 retina regenerative inward Na+ currents appear to be a characteristic feature of AII amacrine cells but not ON bipolar cells, similar to wt retina (Nelson, 1982; Boos et al. 1993; Veruki & Hartveit, 2002; but see Pan & Hu, 2000; Cui & Pan, 2008).
Figure 3. TTX-sensitive Na+ channels are expressed predominantly in rd1 AII amacrine cells whereas Ih is predominantly expressed in rd1 ON cone bipolar cells.

A, voltage-clamp recording from an rd1 AII amacrine cell (a) and ON cone bipolar cell (b). Currents were evoked during voltage steps (–120 mV to +40 mV) from a holding potential of –60 mV. Ac, the frequency of small inward spikelets is plotted as a function of voltage for AII amacrine (AII) and ON cone bipolar cells (BC). Ba and b, in current-clamp mode, injecting steady currents depolarized the membrane (as indicated on the left) and evoked small-amplitude spikelets in control but not in the presence of 1 μm TTX. Bc, the frequency of spikelets in control and in TTX is plotted as a function of injected current. Bd and e, sustained spikelet activity persists in the presence of the gap junction blocker MFA (200 μm) upon steady 40 pA depolarizing current injections. Ca, slowly activating inward currents evoked by hyperpolarizing pulses (−81 mV to −131 mV, 50 ms) from a holding of –71 mV in rd1 ON cone bipolar cells in control (a) and in the presence of 1 mm Cs+ (b). Cc, the amplitude of the slowly activating phase is plotted against voltage for the two conditions.
In current-clamp mode, steady current injections (5 to 100 pA) depolarized the membrane and activated a sustained train of small-amplitude spikelets in AII amacrine (∼10 mV; Fig. 3Ba) but never in bipolar cells (data not shown; n = 8). These spikelets were completely blocked by TTX confirming that they were mediated by voltage-gated Na+ channels (Fig. 3Bb; n = 4). Furthermore, AII amacrine spikelets persisted in the presence of the gap junction blocker MFA, indicating that spikelets could be generated by individual uncoupled AII amacrine cells (Fig. 3Bd and e; n = 2). Since MFA did not appear to block Na+ channels, it suggests that the previously observed effects of MFA on AII amacrine–ON cone bipolar oscillations (Fig. 2) were not mediated through non-specific action on Na+ channels. Together, these data indicate a stronger functional expression of voltage-gated Na+ channels in rd1 AII amacrine cells compared with ON cone bipolar cells, implicating the AII amacrine cells as major drivers of oscillations in the rd1 retina.
In response to hyperpolarizing steps, many rd1 ON cone bipolar cells (5/8), but no rd1 AII amacrine cells (0/5), exhibited slowly activating inward currents, characteristic of Ih (Fig. 3Ca). The slowly activating component was completely blocked by Cs+ (Fig. 3Cb; 98 ± 8% inhibition; n = 5), confirming that these were mediated by Ih. Figure 3Cc plots the amplitude of the slowly activating current in control conditions and in the presence of Cs+, showing an effective block of Ih at all negative potentials. Thus, in rd1 retina, Ih expression appears to be stronger in ON cone bipolar cells than in AII amacrine cells, similar to wt retina (Muller et al. 2003; Ivanova & Muller, 2006; Fyk-Kolodziej & Pourcho, 2007). These data suggest that Ih and Na+ currents reside in different cell types within the electrically coupled network and interact across electrical synapses to shape spontaneous oscillatory activity.
Network oscillations arise in wt retina when photoreceptor transmission is blocked
If Na+ channels and Ih underlie oscillations in the rd1 retina, the question arises as to why similar pacemaking activity is not evident in wt retina. One possibility is that the resting membrane potentials of neurons in the network, which is often a key determinant of pacemaking activity (Bal & McCormick, 1997; Khaliq & Bean, 2010; Huang et al. 2011), is altered in the rd1 compared with the wt retina. To modulate the resting potential of the AII amacrine–ON cone bipolar cell network in wt retina, we occluded photoreceptor-to-bipolar cell synapses using l-AP4 and NBQX. Activating mGluR6 with l-AP4 leads to a closure of the cationic channels in ON bipolar cells and a membrane hyperpolarization. Due to the strong electrical coupling between AII amacrine cells and ON cone bipolar cells, hyperpolarizing ON cone bipolar cells with l-AP4 is expected to result in a hyperpolarization of the entire network (Boos et al. 1993). In addition, we carried out experiments in the mesopic state in which AII–AII amacrine cell coupling is the strongest (Xin & Bloomfield, 1999; Bloomfield & Volgyi, 2004).
Figure 4A shows the light responses of an AII amacrine cell and an ON cone bipolar cell in control Ringer's solution. The resting membrane potential baselines were stable (SD of membrane potential: 0.5 ± 0.1 mV, n = 5, AII amacrine cells; 0.4 ± 0.1 mV, n = 5, ON cone bipolar cells). Flashes of light elicited large graded response in ON cone bipolar cells (Fig. 4Aa). In contrast, AII amacrine cells responded to light with a train of small amplitude spikes that often adapted after the initial phase of the light response. Robust spiking responses were never observed in ON cone bipolar cells, in contrast to ON bipolar cells of the fish retina (Baden et al. 2011; Dreosti et al. 2011). As expected, application of 50 μm l-AP4 and 10 μm NBQX blocked the light-evoked responses in these cells (Fig. 4Ab). However, these blockers also hyperpolarized the membrane potential (7.4 ± 0.7 mV, AII amacrine cells, n = 4; 5.4 ± 2.5 mV, ON cone bipolar cells, n = 5) and induced low-amplitude membrane oscillations in both AII amacrine cells and ON cone bipolar cells (Fig. 4Ab). Spectral analysis revealed that oscillations were of similar frequency to those observed in rd1 retina, with an average peak between 10 and 20 Hz (Fig. 4Bb; 11.0 ± 0.5 Hz, n = 4 AII amacrine cells; 16.6 ± 2.1 Hz, n = 5 ON cone bipolar cells). Thus, occlusion of photoreceptor input to bipolar cells is sufficient to induce oscillations in the wt AII amacrine–ON cone bipolar network. One caveat to these experiments is that occluding photoreceptor input to bipolar cells with the AMPA/KA receptor antagonist (NBQX) would also block bipolar cell inputs to amacrine cells (causing dis-inhibition), and thus does not completely re-create conditions of the rd1 circuit lacking photoreceptors. Nevertheless, these results demonstrate a robust intrinsic oscillatory ability within the ON cone bipolar–AII amacrine cell network that manifests itself when synaptic drive to the network is decreased.
Figure 4. Occluding photoreceptor input to bipolar cells induces membrane oscillations in the wt AII amacrine–ON cone bipolar cell network.
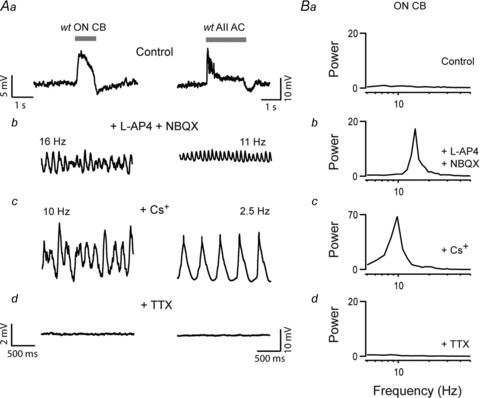
A, current-clamp recordings from an ON cone bipolar (left panels) and an AII amacrine cell (right panels). Aa, responses to a flash of light (horizontal grey bar indicates the duration of the stimulus) in control Ringer solution; Ab, in the presence of l-AP4 and NBQX; Ac, following addition of 1 mm Cs+; and then Ad, with 1 μm TTX added (scale bars the same for panels b–d). B, the power spectra of membrane potential recorded in the same ON cone bipolar cells shown in A (left panel), illustrating the peak frequencies of the oscillations in control solutions or in the presence of the indicated drugs.
To test whether the oscillations observed in wt retina shared a common mechanism to those observed in rd1 retina, we compared their pharmacological properties. Similar to rd1 retina, blocking Ih decreased the frequency of the oscillations in wt AII amacrine–ON cone bipolar cells to 4.4 ± 1.4 Hz and enhanced the peak power at the fundamental frequency more than 10.5-fold (n = 5; 1 ON cone bipolar and 4 AII amacrine cells; Fig. 4Ac and Bc). In addition, oscillations were also completely abolished by TTX (n = 4; 2 ON cone bipolar and 2 AII amacrine cells; Fig. 4Ad and Bd). The finding that oscillations induced by occluding photoreceptor input to bipolar cells in wt retina have the same pharmacological properties as oscillations in rd1 retina suggests that they share a common biophysical mechanism.
Oscillatory activity measured in rd1 retinal ganglion cells
Having developed an understanding of the pharmacology of oscillations in presynaptic AII amacrine and ON cone bipolar cells, we next examined whether these manipulations affected the network's output to postsynaptic ganglion cells. We found that when the output of the network was monitored as spontaneous excitatory postsynaptic currents (sEPSCs) in voltage-clamped rd1 ganglion cells, blocking Ih, Na+ currents and/or gap junctions appeared to have qualitatively the same effects as we had observed on presynaptic oscillatory activity. First, spontaneous EPSCs were augmented upon application of Cs+. Even in cells in which sEPSCs did not exhibit a strong oscillatory component, application of Cs+ induced oscillations (Fig. 5A). On average, Cs+ significantly increased the peak power at the fundamental frequency by 530 ± 140% (n = 6; P = 0.01; Fig. 5A). To test if the effects of Cs+ were mediated by a block of Ih we tested the effects of a more specific antagonist, ZD7288, on spontaneous release. We found that ZD7288 had a qualitatively similar effect on the spontaneous EPSCs as Cs+ (data not shown), confirming the role of Ih in mediating oscillations.
Figure 5. The spontaneous synaptic activity recorded in rd1 ganglion cells in the presence of blockers of Ih, Na+ channels or gap junctions.
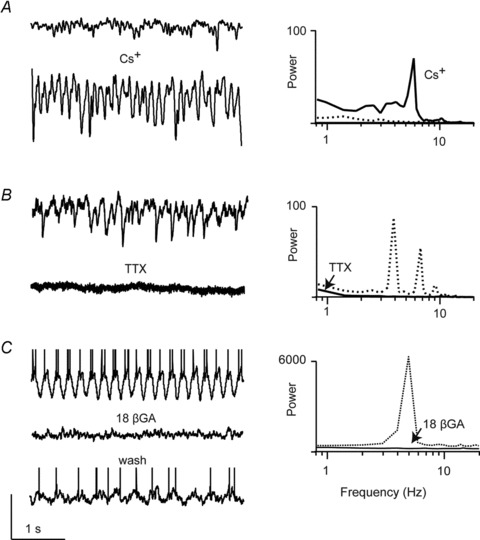
A, sEPSCs in rd1 ON ganglion cells recorded in control Ringer solution (Vhold∼−60 mV; top panels) and in the presence of 1 mm Cs+ (bottom panel) or B, 1 μm TTX (bottom panel, recorded in a different ganglion cell). C, oscillatory activity recorded in current-clamp mode (spikes are truncated to emphasize baseline membrane oscillations) from a ganglion cell in control Ringer solution (top panel) or in the presence 25 μm of the gap junction blocker 18β-glycyrrhetinic acid (18β-GA; middle panel). Bottom panel shows wash. The power spectra of these traces are shown on the right (activity measured in control Ringer solution is shown as dotted traces; those measured in drugs are shown as continuous traces). Vertical scale bar: 100 pA (for A and B), 40 mV for C.
TTX (0.5–1 μm) reduced spontaneous excitatory activity in the majority of cells tested (7 of 9). TTX significantly reduced both the frequency (7.4 ± 3.8 Hz in control vs. 3.6 ± 2.3 Hz in TTX; n = 9; P < 0.05) and peak amplitude of sEPSCs (47.5 ± 45.3 pA in control vs. 12.4 ± 2.9 pA in TTX; n = 9; P < 0.01). In four cells that exhibited pronounced oscillations, TTX completely abolished the peak measured in the power spectrum (98.7 ± 0.175% inhibition; n = 4; Fig. 5B). These results suggest that Na+ channels play an important role in gating information flow through the AII amacrine–ON cone bipolar to ganglion cell pathway, in contrast to wt retina where they do not appear to control the response amplitude of this synapse (Tian et al. 2010).
The gap junction blocker MFA (200 μm) also strongly suppressed sEPSCs measured in rd1 ganglion cells. MFA reduced the frequency of sEPSCs (9.2 ± 5.8 Hz in control to 1.2 ± 1.5 Hz in MFA; n = 5; P < 0.05) and amplitude (87.3 ± 63.3 pA in control vs. 25.2 ± 4.9 pA in MFA; n = 5; P < 0.01; data not shown) consistent with the reported effects of MFA on ganglion cell spontaneous spiking activity (Menzler & Zeck, 2011). It should be noted, however, that the observed effects of MFA were not easily reversible. Therefore, as an additional set of control experiments we also tested the effects of 25 μm 18β-glycyrrhetinic acid (18β-GA), which is known to reversibly block gap junctions in the retina (Xia & Nawy, 2003; Ackert et al. 2009). To obtain longer recordings, required to observe reversibility of the gap junction antagonists, we measured spontaneous spike activity in current clamp from rd1 ganglion cells. In 6 of 6 cells tested, 18β-GA reduced the spontaneous spike rate from 11.1 ± 2.5 Hz to 0.3 ± 0.17 Hz (n = 6, P < 0.01) and in all six of these recordings activity returned to control levels upon washout (10.0 ± 2.3 Hz, P = 0.75). In three of these cells, pronounced oscillatory activity was abolished by 18β-GA (99.8 ± 0.075% inhibition of the peak power; n = 3; Fig. 5C). Thus, monitoring synaptic activity in ganglion cells provided additional support for the obligatory role for Na+ channels and gap junctions, but not Ih, in generating oscillations in the presynaptic networks of the rd1 retina.
To ensure that the observed effects of the above-mentioned drugs were a result of direct action on the AII amacrine–ON cone bipolar cell network, we also measured network output in ganglion cells in the presence of a cocktail of inhibitors which included 100 μm picrotoxin, 5 μm strychnine, 50 μm TPMPA, 20 μm l-AP4, 20 μm NBQX and 50 μm tubocurare. This cocktail blocks putative photoreceptor, amacrine cell (including the cholinergic starburst amacrine cells) and rod bipolar cell synaptic signals, thus pharmacologically isolating the output of the AII amacrine–ON cone bipolar cell network. Under these conditions, output was measured as NMDA-mediated currents measured at +40 mV (Borowska et al. 2011). Cs+, TTX and MFA had qualitatively the same effects on spontaneous activity in rd1 ganglion cells as observed in Ringer solution (data not shown), confirming that a major action of these blockers was on the AII amacrine–ON cone bipolar cell network.
Computational model of oscillations in a reduced AII amacrine–ON cone bipolar cell network
To better understand how Ih and Na+ currents interact through gap junctions to initiate network oscillations, we constructed a computational model of a reduced AII amacrine–ON bipolar cell network (see Appendix I for details). The idealized model network consists of two AII amacrine cells (AC1 and AC2) and one ON cone bipolar cell (BC; Fig. 6A). The two amacrine cells (AC1 and AC2) are electrically coupled to one another gap junction conductance ((Gj) 500 pS; Veruki et al. 2008), and the bipolar cell (BC) is electrically coupled to one of the amacrine cells (AC2; Gj 500 pS). (Veruki & Hartveit, 2002; Trexler et al. 2005). Each amacrine cell has a fast sodium conductance, a delayed rectifying potassium conductance, and a leakage conductance. The amacrine cells are identical except for relatively minor differences in their maximal sodium conductances and/or leakage conductances. The bipolar cell has a hyperpolarization-activated cationic current, a delayed rectifying potassium conductance, and a leakage conductance (details of the model and parameters are provided in Appendix I).
Figure 6. A modified Morris–Lecar computational model of a reduced AII amacrine–ON cone bipolar cell network elucidates the generation of oscillations.
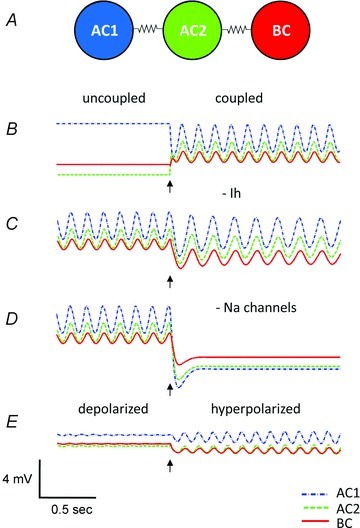
A, schematic diagram of the model network. B, oscillations rely on electrical coupling. Initially, cells are not coupled and remain at their resting potentials. Mild heterogeneities in leak conductances result in slightly different resting potentials for the individual cells. When electrical coupling is activated (arrow), synchronous oscillations are rapidly induced. C, Ih modulates the network oscillations but is not required for the oscillations. When Ih is completely blocked (arrow), oscillations persist but the frequency is decreased from 7.0 Hz to 5.2 Hz. D, Na+ current is required for generation of network oscillations. When INa is blocked (arrow), network oscillations are abolished. E, oscillations are modulated by the state of the bipolar cell. A small steady depolarizing current (0.24 μA cm−2) applied to the bipolar cells stops oscillations. However, when network is hyperpolarized, in this case by blocking Ih in the bipolar cell (arrow), oscillations resume.
The network model is able to reproduce the behaviour observed experimentally. When uncoupled, all of the cells in the model network have stable resting potentials and the network does not oscillate. When cells are electrically coupled to each other, small-amplitude (∼1 to 3 mV) oscillations of ∼8 Hz are induced (Fig. 6B). When Ih is blocked, the frequency of the network oscillations decreases to ∼6 Hz (Fig. 6C). However, when voltage-gated Na+ channels are blocked, the oscillations are extinguished (Fig. 6D), and the membrane potential of the network hyperpolarizes, similar to experimental findings upon TTX application. To directly test the effect of resting membrane potential of the network on oscillations, small steady-state currents were applied. Injections of steady depolarizing current (>0.22 μA cm−2) into the bipolar cell resulted in an inactivation of Na+ channels in the electrically coupled amacrine cells, inhibiting the oscillations. Thus, the generation of oscillations requires the network to be in a relatively hyperpolarized state. This result suggests a mechanism that accounts for the increase in pacemaking activity in wt retina when the network is hyperpolarized by blocking cationic channels in ON bipolar cells with Cs+ and/or l-AP4.
Although the ON bipolar cell appears to control the initiation of oscillations, the model demonstrates that they do not play an obligatory role in driving pacemaking activity. In the absence of the bipolar cell, the oscillations can be initiated by applying a constant depolarizing current to either amacrine cell. The bipolar cell primarily plays the role of a load. By tuning the level of Ih in the bipolar cell or the input from the photoreceptor to the bipolar cell, the effect of this load can bring the ON cone bipolar–AII amacrine cell network into or out of the oscillatory regime (Fig. 6E).
We next tested the robustness of the oscillations to changes in model parameters by examining the state of the system as a function of two parameters (computed using the numerical bifurcation software XPP-AUTO; http://www.math.pitt.edu/~bard/xpp/xpp.html). Figure 7A shows the boundaries between network oscillations and a stable resting state in the model for changes with the maximal hyperpolarization-activated conductance in the bipolar cell  and current applied to the bipolar cell IAPP,B. Point C represents the default state of the rd1 network model. The transition from point C to point C* represents the change in state when Ih is blocked; as shown in Fig. 6C, the oscillations persist. Point E represents the state of the model with a current of 0.24 μA cm−2 applied to the bipolar cell, which suppresses the oscillations. The transition from point E to point E* represents the transition in states when Ih is blocked; as shown in Fig. 6E, oscillations reappear. This figure demonstrates that the responses of the network model to the pharmacological manipulations (shown in Fig. 6) are very robust.
Figure 7. Oscillations are apparent in a wide range of conditions.
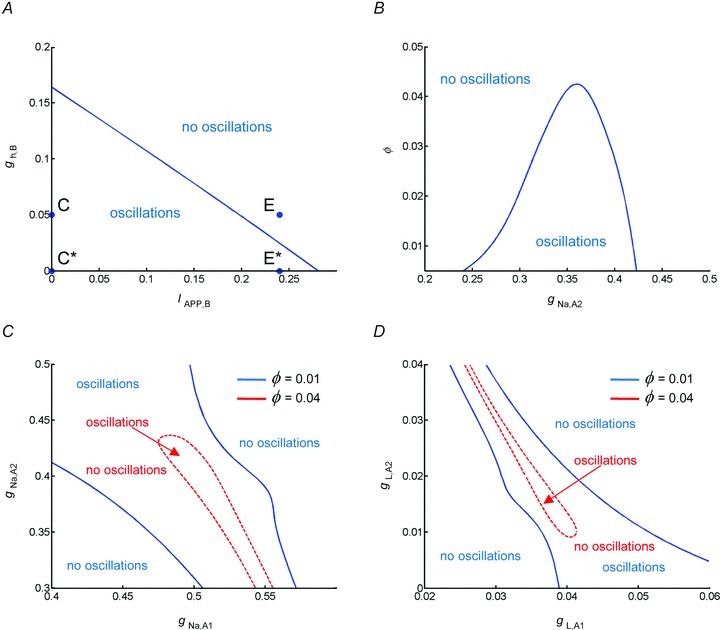
A, boundary between network oscillations and a stable resting state in the model network as a function of the maximal conductance of the hyperpolarization-activated conductance in the bipolar cell  and current applied to the bipolar cell IAPP,B. Point C represents the default state of the rd1 network model, point C* represents the state of the network when Ih is blocked, point E represents the state of the model with a current of 0.24 μA cm−2 applied to the bipolar cell, and point E* represents the transition in states when Ih is blocked and a current of 0.24 μA cm−2 applied to the bipolar cell. B, boundary between network oscillations and a stable resting state in the model network as a function of the scale of rate constant of the potassium currents in the amacrine cells ϕ (larger values correspond to faster dynamics) and the maximal conductance of the Na+ conductance in AC1. C, boundary between network oscillations and a stable resting state in the model network as a function of the maximal Na+ conductances
  and
and  . D, boundary between network oscillations and a stable resting state in the model network as a function of the leakage conductances gL,A1 and gL,A2. For C and D, the boundaries indicated by the dashed curve are for ϕ = 0.01, and the boundaries indicated by continuous curves ϕ = 0.04.
To obtain network oscillations in the model in the absence of intrinsically oscillating cells, we found that the key parameters included the magnitudes of the Na+ conductances ( ), the leakage conductances (gL,A1,gL,A2), and the relative steepness of the Na+ conductance activation curve (Vmz). Therefore, we examined the robustness of the network oscillations to variations in these parameters. Starting with default parameters and changing
  (or
(or  ), the oscillations persist only over an interval of ∼15% of the value of
  (i.e. there is only moderate robustness to variations in the maximal Na+ conductances). Because the rate of the activation of the K+ conductance often has considerable influence on the existence of oscillations, we altered ϕ (which scales the time constant for the recovery process) and found that it affects the robustness of the network oscillations considerably (see Fig. 7B). Decreasing ϕ by a factor of 4 increases the robustness by a factor of 6, i.e. when ϕ = 0.01, oscillations exist over an interval of ∼85% of the value of
  . Figure 7C and D, respectively, show the combination of values of
  ,
,  and
and  for which oscillations exist with ϕ = 0.01 (within the dashed curve) and ϕ = 0.04 (between the continuous curves). These results demonstrate that the network oscillations are quite robust to variations in
  and gL,A when ϕ is sufficiently small.
Of the parameters tested, the oscillations are most sensitive to changes in Vm2 (the parameter controlling the steepness of the Na+ conductance activation curve). For the parameters examined, the model can only support ∼1–2 mV changes (5–10% variation) in Vm2. Subthreshold oscillations actually exist for much greater variation in Vm2, but the cells themselves are intrinsically oscillating at these parameter values.
Discussion
This report elucidates the biophysical mechanisms that contribute to oscillatory activity that accompanies photoreceptor degeneration in the rd1 mouse retina (Ye & Goo, 2007; Margolis et al. 2008; Stasheff, 2008; Borowska et al. 2011; Menzler & Zeck, 2011). Our experimental results indicate that gap junctions play an obligatory role in generating oscillatory activity as they permit strong interactions to occur between rhythmogenic TTX-sensitive Na+ channels in neighbouring AII amacrine cells, as well as with hyperpolarization-activated and mGluR6-gated cationic conductances expressed in neighbouring ON cone bipolar cells.
Differential expression of Ih and Na+ currents within the AII amacrine–ON cone bipolar cell network
In rd1 retina, we observed hyperpolarization-activated, Cs+-sensitive inward currents, indicative of Ih, only in recordings from ON cone bipolar cells. These currents were never observed in recordings from AII amacrine cells. Conversely, we found TTX-sensitive inward currents activated by depolarizing pulses only in AII amacrine cells, and not in ON cone bipolar cells. Since AII amacrine and ON cone bipolar cells are strongly coupled by gap junctions, and since in wt retina some cone bipolar cells are thought to express voltage-gated Na+ channels (Pan & Hu, 2000; Cui & Pan, 2008), we considered the possibility that TTX-sensitive currents measured in the soma of AII amacrine cells might arise in bipolar cells. Several lines of evidence suggest that this is not the case. First, in whole-cell recordings from rd1 bipolar cells, we never observed inward currents upon depolarizing steps. Second, we found robust depolarization-induced spiking in AII amacrine cells that were uncoupled after prolonged exposure to the gap junction blocker MFA. Third, recent evidence has found voltage-gated Na+ channel 1.1 (Nav1.1) as well as axon initial segment markers (ankyrin-G and neurofascin) to be specifically localized to the arboreal processes of AII amacrine cells in wt retina (Wu et al. 2011), suggesting that these cells have the intrinsic ability to generate spikes. Thus, it seems more likely that spikes occurring in AII amacrine cells would spread through gap junctions and significantly boost the membrane potential of ON bipolar cell terminals. Indeed, paired recordings from AII amacrine and ON cone bipolar cells confirm this idea (Veruki & Hartveit, 2002). Fourth, as we only found evidence for Ih in bipolar but not AII amacrine cell recordings, consistent with Ih expression patterns in wt retinal bipolar cell terminals (Muller et al. 2003; Fyk-Kolodziej & Pourcho, 2007), it suggests limited contamination of bipolar cell axon terminal currents in somatic recordings from AII amacrine cells. Finally, it is possible that expression of Na+ channels in ON cone bipolar cells was overlooked due to its relatively weak or cell-specific expression, and ON cone bipolar cells directly contribute to generation of network oscillations. However, such contributions are expected to be weak compared to those from AII amacrine cells that exhibit robust Na+ channel dependent activity. while the electrophysiological measurements made in electrically coupled networks of neurons cannot provide a quantitative estimate of the biophysical properties of Ih and Na+ channels in individual cells, they clearly indicate the presence of Na+ channels in AII amacrine cells and Ih in ON cone bipolar cells.
Obligatory role for Na+ channels but not Ih in generating pacemaking activity
TTX-sensitive Na+ channels are often implicated in triggering oscillatory activity in many parts of the CNS including the ventral tegmental area (Khaliq & Bean, 2010), striatum (Bennett et al. 2000) and suprachiasmatic nucleus (Pennartz et al. 1998; Jackson et al. 2004). However, a previous study suggested a non-obligatory role for TTX-sensitive Na+ channels in mediating network oscillations in the rd1 retina (Menzler & Zeck, 2011). Menzler & Zeck (2011) found that in the rd1 retina the application of TTX decreased the frequency of oscillations (as indicated by local field potentials) but did not completely block them, suggesting that other mechanisms underlie their generation. Thus, we were surprised to find that oscillatory activity that we measured in AII amacrine, ON cone bipolar and ganglion cells was completely blocked by TTX. One possible source for this discrepancy could be attributed to the different dose of TTX used in these studies. In the previous study, a relatively low dose of TTX was used (200 nm), which did not completely abolish spike activity in ganglion cells (Menzler & Zeck, 2011). It seems possible that such a low concentration of TTX would be even less effective at blocking Na+ channel-mediated activity in the AII amacrine–ON cone bipolar cell network, since these cells lie in the middle of the retina. Here, we used a saturating dose of TTX (1 μm) that abolished AII–ON cone bipolar network activity (and all AII amacrine and ganglion cell spike activity) providing compelling evidence that Na+ channels play a major role in driving rhythmic activity in the rd1 retina. A second possibility is that the block of spiking of inhibitory amacrine cells leads to a dis-inhibition of the rd1 circuitry and a secondary oscillatory mechanism, independent of the AII amacrine cell circuitry.
Hyperpolarization-activated currents play diverse physiological roles depending on interactions with particular voltage-gated ion channels. For example, in cardiac myocytes (DiFrancesco & Tortora, 1991) and thalamic relay neurons (Hughes et al. 1998) Ih contributes to intrinsic rhythmic activity, whereas in pyramidal neurons (Fan et al. 2005; Tsay et al. 2007) and certain retinal amacrine cells, not including AIIs (Koizumi et al. 2004), Ih constrains synaptic integration along the dendrites. Recently, changes in Ih expression have also been associated with a variety of seizure models (Chen et al. 2001; Hablitz & Yang, 2010), highlighting the role of Ih in maintaining physiological stability within neural networks. Here we demonstrate that when Ih is blocked, activity in both the rd1 and wt AII amacrine–ON bipolar cell network is augmented, clearly indicating that within the inner retina, Ih is not required to drive oscillations.
Transjunctional electrical interactions underlie oscillatory activity in rd1 retina
Our finding that Ih and Na+ channel conductances are confined to distinct cell types, but that both conductances strongly modulate rhythmic network activity, indicates that these channels interact transjunctionally to shape oscillations. Consistent with this hypothesis, we found that pharmacological block of electrical signalling abolished oscillatory behaviour, demonstrating that individual components of the network do not have an intrinsic oscillatory potential.
Since the role of gap junctions was based on pharmacology, we considered the potential non-specific effects of gap junction blockers on Ca2+ and K+ channels (Vessey et al., 2004; Peretz et al. 2005). Several lines of evidence suggest that the effects of MFA on oscillatory activity within the AII amacrine–ON cone bipolar cell network were due to block of gap junctions. First, we found that the MFA-induced inhibition of oscillatory activity in these cells was relatively slow (full block in 15–20 min), which is a hallmark of gap junction blockade (Veruki & Hartveit, 2009). Second, we observed an increase in membrane resistance that accompanied the effect of MFA on oscillations, consistent with blockade of gap junctions (Veruki & Hartveit, 2009). Third, we have previously shown that oscillations in AII amacrine and ON cone bipolar cells do not rely on voltage-gated Ca2+ channels (Borowska et al. 2011), which are a possible non-specific target of gap junction blockers (Vessey et al., 2004). Fourth, MFA does not appear to block Na+ channel activity in ganglion cells (Menzler & Zeck, 2011) or in AII amacrine cells (Fig. 3B), which are critical for the generation of oscillations. Finally, we found that application of an alternate gap junction blocker, 18β-glycyrrhetinic acid (18β-GA; Xia & Nawy, 2003; Ackert et al. 2009), reversibly blocked oscillations, suggesting that the observed effects of MFA and 18β-GA were primarily mediated through block of gap junctions.
While the actions of gap junction and Na+ channel blockers on oscillatory activity implicate the network of AII amacrine cells in mediating activity, they do not rule out the possibility that ON cone bipolar cells actively participate in the generation of oscillations. Pharmacologically blocking gap junctions probably results in the disruption of both homologous coupling between neighbouring AII amacrine cells and heterologous coupling between AII amacrine and ON cone bipolar cells. Thus, Na+ channel-dependent oscillations could be generated solely within the network of AII amacrine cells or could require additional components expressed in ON cone bipolar cells. Future studies in which genetic disruption of specific homologous or heterologous gap junctions in the rd1 mouse will reveal whether ON cone bipolar cells actively participate in the generation of sustained oscillations.
The participation of ON cone bipolar cells in oscillatory activity is most evident when their cationic conductances, Ih and mGluR6-gated channels are closed (note these channels do not appear to be expressed in AII amacrine cells). Closing either of these cationic channels hyperpolarizes the entire network (Boos et al. 1993). By influencing network resting potential, conductances expressed in ON bipolar cells can control the availability of Na+ channels expressed by AII amacrine cells. Thus, blocking cationic conductances (Ih or mGluR6-gated channels) in ON cone bipolar cells promotes oscillatory activity. Such biophysical interactions between Ih and Na+ channels are also evident in other parts of the brain (Bal & McCormick, 1997; Huang et al. 2011). Conversely, depolarizing the network leads to inactivation of Na+ channels and an inhibition of oscillatory activity. In this manner, the ON bipolar cell can act as a passive ‘load’ to affect oscillatory activity within the gap junction-coupled network.
While the formation of oscillations in the AII amacrine–ON cone bipolar cell network can be parsimoniously explained by relatively small changes in a negative resting membrane potential, whether these occur during retinal degeneration is difficult to directly measure. Indeed ON cone bipolar cells in the rd1 retina appear to be in a hyperpolarized state despite the loss of photoreceptor drive (Borowska et al. 2011), suggesting a decrease in their resting cationic conductances. Interestingly, when organic dye uptake was used to map activity of the mGluR6-gated channel in ON bipolar cells of the rodless coneless mutant mouse (rdcl), little uptake to ON bipolar cells was apparent, suggesting a decreased expression or a near-complete closure of the mGluR6-gated channels in these mutant mice (Marc et al. 2003). However, mGluR6-mediated signalling remains evident in late stages of degeneration in rd1 mice, when residual cone cell bodies are stimulated exogenously (Busskamp et al. 2010), suggesting that the mGluR6-gated pathway is not completely dysregulated. One possibility is that the decreased expression of mGluR6-gated channels leads to an increase in the input resistance of ON bipolar cells, thereby increasing the gain of the photoreceptor-to-ON bipolar cell synapse. The trade-off of a homeostatic increase in synaptic gain appears to be a large increase in spontaneous activity.
Minor heterogeneities in cellular properties give rise to network oscillations
Our experimental findings indicate that the oscillations within the rd1 AII amacrine–ON cone bipolar cell network depend on electrical coupling. This raises the question as to how oscillations arise when neither AII amacrine cells nor ON cone bipolar cells oscillate individually when gap junctions are pharmacologically blocked. Theoretical studies have suggested several possible mechanisms whereby oscillations can arise in networks that lack intrinsically oscillating cells. For example, network oscillations can be associated with waves of activity that are propagated via electrical coupling. These oscillations can be generated by self-sustained re-entrant waves or by waves that are initiated by sparse random activation and shaped into coherent oscillatory activity by the network (Lewis & Rinzel, 2000, 2003). However, these mechanisms typically require strong signals to propagate the waves of activity, so it is unlikely that the sub-threshold oscillations in rd1 retina are generated by these mechanisms.
An alternate mechanism for the generation of oscillations in networks lacking intrinsically oscillating cells has been proposed by Manor et al. (1997). This mechanism relies on mild differences in the channel densities of the cells within the network. In this ‘heterogeneity hypothesis,’ electrical coupling cannot induce synchronous oscillations in a network of non-intrinsically oscillating, isopotential cells. However, if individual cells have channel density values that straddle a parameter region within which an isolated cell would intrinsically oscillate, then electrical coupling can effectively average these values and put the network into an oscillatory regime. That is, electrical coupling of a sufficiently large strength can act to hyperpolarize relatively depolarized cells and depolarize relatively hyperpolarized cells, bringing all cells (and the network) into an oscillatory zone.
The oscillations in our computational model of the AII amacrine–ON cone bipolar cell network bear all of the hallmarks of oscillations generated by this ‘heterogeneity’ mechanism. The isolated amacrine cells in the model exhibit sub-threshold oscillations over a range of parameters, and the average values of the maximal sodium conductance and leakage conductance for AC1 and AC2 fall within this oscillatory window (i.e. an isolated AII amacrine model cell with these average values exhibits oscillations). The synchronous network oscillations in our model only occur when the coupling conductance is above 0.025 mS cm−2. This value falls in the range of those measured experimentally between AII amacrine cells (Veruki et al. 2008) and AII amacrine–ON cone bipolar cells (Veruki et al. 2002; Trexler & Massey, 2005). Furthermore, decreasing the heterogeneity between AC1 and AC2 below a certain level will either annihilate the network oscillations or make one or both of the cells intrinsic oscillators. Thus, the network oscillations in our computational model are generated by the ‘heterogeneity’ mechanism, suggesting a similar mechanism for the generation of network oscillations in the rd1 AII amacrine–ON cone bipolar cell network.
Conclusions
Although the rd1 mouse represents a diseased model, it can provide useful insights into circuit properties of the wt retina. For example, the finding that the AII amacrine-ON cone bipolar cell network synchronizes activity across multiple types of ganglion cells in the rd1 retina (Menzler and Zeck, 2011), suggest it could also be an important source of common noise in the wt retina, where multiple types of neighbouring ganglion cells exhibit substantial correlated activity (Shlens et al. 2008). The strong biophysical interactions between the rd1 and wt AII amacrine and ON cone bipolar cell terminals observed here warrants that care should be taken when interpreting the response properties measured from the somata (Cui & Pan, 2008; Baden et al. 2011) and terminals of individual cells (Baden et al. 2011; Dreosti et al. 2011). Additionally, our finding that TTX strongly inhibits spontaneous synaptic currents in rd1 ganglion cells suggest that voltage-dependent Na+ channels play an important role in gain control of the AII amacrine–ON cone bipolar to ganglion cell pathway, in contrast to its more subtle proposed role in accelerating response kinetics in the wt retina (Tian et al. 2010; Demb & Singer, 2012). Whether Na+ channels play a similar role in the wt retina and how they interact with Ih during light-evoked activity remains a challenge for future investigation.
Finally, optimization of retinal prostheses for restoring vision in photoreceptor degenerated retinas will need to accommodate the oscillatory activity emergent in the absence of photoreceptor drive. The results of this work may aid in the design of pharmacological strategies that alter AII amacrine–ON cone bipolar cell network oscillations. Precise targeting of the Na+ channels in AII amacrine cells, the gap junctions between them and ON cone bipolar cells, or an increase of Ih in bipolar cells, may become achievable goals with the use of genetically mediated interventions.
Acknowledgments
We thank Dr Rob Smith for helpful discussions, Dr William Baldridge for comments on this manuscript, Dr. Karl Farrow for help in calibrating intensity of light stimuli and Dr Jamie Boyd for his help in writing routines for two-photon imaging. The authors would also like to acknowledge the NSERC, CAMBAM and CIHR-funded Summer School on Computational Neuroscience at the University of Ottawa where the collaborative research presented in this study was initiated. This work was supported by the National Science Foundation under grant DMS-09211039 to T.J.L., by the Foundation Fighting Blindness (Canada) and the Canadian Institutes of Health Research (100065) to G.B.A.
Glossary
Abbreviations
- AC
AII amacrine cell
- BC
ON cone bipolar cell
- 18βGA
18β-glycyrrhetinic acid
- l-AP4
l-2-amino-4-phosphonobutyric acid
- Ih
hyperpolarization-activated current
- MFA
meclofenamic acid
- mGluR6
metabotropic glutamate receptor 6
- NBQX
2,3-dioxo-6-nitro-1,2,3,4-tetrahydrobenzo[f]quinoxaline-7-sulfonamide
- rd1
retinal degeneration 1
- TPMPA
(1,2,5,6-tetrahydropyridin-4 yl) methylphosphinic acid
- TTX
tetrodotoxin
- wt
wild type
Appendix I
Model description
The idealized model network consists of two AII amacrine cells (AC1 and AC2) and one bipolar cell (BC). The Morris–Lecar (ML) model (Morris & Lecar, 1981; Ermentrout & Rinzel, 1984) was used as a base model to describe the electrochemical dynamics of the cells. Inactivation dynamics of the fast sodium conductance (Hodgkin & Huxley, 1952) were included in the ML model for amacrine cells dynamics, and the sodium current in the ML model was replaced by a hyperpolarization-activated current to describe the dynamics of the bipolar cell.
Each amacrine cell has a fast sodium current INa,Aj, a (delayed rectifier) potassium current IK,Aj and a leakage current IL,Aj (j = 1,2)
The bipolar cell has a hyperpolarization-activated current Ih,B, a potassium current IK,B and a leakage current IL,B
The two amacrine cells (AC1 and AC2) are electrically coupled to one another by a gap junction, and the ON bipolar cell (BC) is electrically coupled to one of the amacrine cells (AC2). The corresponding current balance equations are
 |
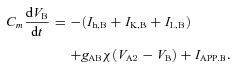 |
where the gap junctions are modelled as ohmic resistances (Bennett, 1972). The dynamics of the gating variables are governed by the equations
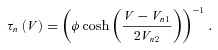 |
The membrane capacitance is Cm = 1 μF cm−2. The maximal ionic conductances are  mS cm−2,
  mS cm−2,
  mS cm−2, gL,A1 = 0.035 mS cm−2, gL,A2 = 0.02 mS cm−2, gL,B = 0.035 mS cm−2, gK,B = 0.3 mS cm−2 and gh,B = 0.05 mS cm−2. The gap junction conductances per unit surface area of the cells are gAA = gAB = 0.05 mS cm−2, and
  is the ratio of the surface areas of the amacrine cells and bipolar cell. IAPP,B is an applied current to the bipolar cells, e.g. from the photoreceptors (the default is IAPP,B = 0). The reversal potentials are ENa = 40 mV, EK,A = –100 mV, EL,A = –60 mV, EK,B = –80 mV, EL,B = –35 mV and Eh,B = –27 mV. The parameters for the steady states and the time constants of the gating variables are Vm1 = –1.2 mV, Vm2 = 20.5 mV, Vn1 = 2 mV, Vn2 = 15 mV, Vh1 = –28 mV, Vh2 = –1 mV, Vq1 = –40 mV, Vq2 = –30 mV,
  and
and  ms.
ms.
Tuning model parameters
To find a parameter regime in which the model displayed subthreshold network oscillations in the absence of intrinsic cellular oscillations, we used phase portrait analysis. The phase portrait analysis suggested that the relative steepness of the Na+ conductance activation curve (Vm2) and a modest heterogeneity of Na+ conductances and/or leakage conductances between AII amacrine cells were key components that supported the oscillatory behaviour. Starting with the ML model as described in Rinzel & Ermentrout (1998), the value of Vm2 was adjusted to 20.5 mV (adding 2 mV to the default value) and  was varied between 0.25 and 0.75 mS cm−2 (approximately the default value ± 50%). We found that a region of
  values that yielded subthreshold oscillations – the size of this region allowed for ∼10% variation in
  . By decreasing
  from 0.036 to 0.02 mS cm−2, we found that the size of this region allowed for ∼20% variation in
  . These parameter values were used as our default parameters when we modelled the pharmacological manipulations in Fig. 6 and examined robustness to changes in key parameters in Fig. 7.
Author contributions
S.T. & G.B.A. conceived and designed the experiments. J.Z., S.T. & T.J.L. performed the computational modelling. J.B., S.T., A.H. & K.J. collected and analysed the data. S.T., T.J.L. and G.B.A. drafted the manuscript and S.B. helped revise it critically for important intellectual content. All authors approved the final version.
References
- Ackert JM, Farajian R, Volgyi B, Bloomfield SA. GABA blockade unmasks an OFF response in ON direction selective ganglion cells in the mammalian retina. J Physiol. 2009;587:4481–4495. doi: 10.1113/jphysiol.2009.173344. [DOI] [PMC free article] [PubMed] [Google Scholar]
- Applebury ML, Antoch MP, Baxter LC, Chun LL, Falk JD, Farhangfar F, Kage K, Krzystolik MG, Lyass LA, Robbins JT. The murine cone photoreceptor: a single cone type expresses both S and M opsins with retinal spatial patterning. Neuron. 2000;27:513–523. doi: 10.1016/s0896-6273(00)00062-3. [DOI] [PubMed] [Google Scholar]
- Baden T, Esposti F, Nikolaev A, Lagnado L. Spikes in retinal bipolar cells phase-lock to visual stimuli with millisecond precision. Curr Biol. 2011;21:1859–1869. doi: 10.1016/j.cub.2011.09.042. [DOI] [PMC free article] [PubMed] [Google Scholar]
- Bal T, McCormick DA. Synchronized oscillations in the inferior olive are controlled by the hyperpolarization-activated cation current Ih. J Neurophysiol. 1997;77:3145–3156. doi: 10.1152/jn.1997.77.6.3145. [DOI] [PubMed] [Google Scholar]
- Bennett BD, Callaway JC, Wilson CJ. Intrinsic membrane properties underlying spontaneous tonic firing in neostriatal cholinergic interneurons. J Neurosci. 2000;20:8493–8503. doi: 10.1523/JNEUROSCI.20-22-08493.2000. [DOI] [PMC free article] [PubMed] [Google Scholar]
- Bennett MV. Electrical versus chemical neurotransmission. Res Publ Assoc Res Nerv Ment Dis. 1972;50:58–90. [PubMed] [Google Scholar]
- Bloomfield SA, Volgyi B. Function and plasticity of homologous coupling between AII amacrine cells. Vision Res. 2004;44:3297–3306. doi: 10.1016/j.visres.2004.07.012. [DOI] [PubMed] [Google Scholar]
- Boos R, Schneider H, Wassle H. Voltage- and transmitter-gated currents of all-amacrine cells in a slice preparation of the rat retina. J Neurosci. 1993;13:2874–2888. doi: 10.1523/JNEUROSCI.13-07-02874.1993. [DOI] [PMC free article] [PubMed] [Google Scholar]
- Borowska J, Trenholm S, Awatramani GB. An intrinsic neural oscillator in the degenerating mouse retina. J Neurosci. 2011;31:5000–5012. doi: 10.1523/JNEUROSCI.5800-10.2011. [DOI] [PMC free article] [PubMed] [Google Scholar]
- Burrone J, Lagnado L. Electrical resonance and Ca2+ influx in the synaptic terminal of depolarizing bipolar cells from the goldfish retina. J Physiol. 1997;505:571–584. doi: 10.1111/j.1469-7793.1997.571ba.x. [DOI] [PMC free article] [PubMed] [Google Scholar]
- Busskamp V, Duebel J, Balya D, Fradot M, Viney TJ, Siegert S, et al. Genetic reactivation of cone photoreceptors restores visual responses in retinitis pigmentosa. Science. 2010;329:413–417. doi: 10.1126/science.1190897. [DOI] [PubMed] [Google Scholar]
- Chen K, Aradi I, Thon N, Eghbal-Ahmadi M, Baram TZ, Soltesz I. Persistently modified h-channels after complex febrile seizures convert the seizure-induced enhancement of inhibition to hyperexcitability. Nat Med. 2001;7:331–337. doi: 10.1038/85480. [DOI] [PMC free article] [PubMed] [Google Scholar]
- Cui J, Pan ZH. Two types of cone bipolar cells express voltage-gated Na+ channels in the rat retina. Vis Neurosci. 2008;25:635–645. doi: 10.1017/S0952523808080851. [DOI] [PMC free article] [PubMed] [Google Scholar]
- Demb JB, Singer JH. Intrinsic properties and functional circuitry of the AII amacrine cell. Vis Neurosci. 2012;29:51–60. doi: 10.1017/S0952523811000368. [DOI] [PMC free article] [PubMed] [Google Scholar]
- Demontis GC, Gargini C, Paoli TG, Cervetto L. Selective Hcn1 channels inhibition by ivabradine in mouse rod photoreceptors. Invest Ophthalmol Vis Sci. 2009;50:1948–1955. doi: 10.1167/iovs.08-2659. [DOI] [PubMed] [Google Scholar]
- DiFrancesco D, Tortora P. Direct activation of cardiac pacemaker channels by intracellular cyclic AMP. Nature. 1991;351:145–147. doi: 10.1038/351145a0. [DOI] [PubMed] [Google Scholar]
- Dreosti E, Esposti F, Baden T, Lagnado L. In vivo evidence that retinal bipolar cells generate spikes modulated by light. Nat Neurosci. 2011;14:951–952. doi: 10.1038/nn.2841. [DOI] [PMC free article] [PubMed] [Google Scholar]
- Ermentrout GB, Rinzel J. Beyond a pacemaker's entrainment limit: phase walk-through. Am J Physiol Regul Integr Comp Physiol. 1984;246:R102–R106. doi: 10.1152/ajpregu.1984.246.1.R102. [DOI] [PubMed] [Google Scholar]
- Fan Y, Fricker D, Brager DH, Chen X, Lu HC, Chitwood RA, Johnston D. Activity-dependent decrease of excitability in rat hippocampal neurons through increases in Ih. Nat Neurosci. 2005;8:1542–1551. doi: 10.1038/nn1568. [DOI] [PubMed] [Google Scholar]
- Fyk-Kolodziej B, Pourcho RG. Differential distribution of hyperpolarization-activated and cyclic nucleotide-gated channels in cone bipolar cells of the rat retina. J Comp Neurol. 2007;501:891–903. doi: 10.1002/cne.21287. [DOI] [PubMed] [Google Scholar]
- Hablitz JJ, Yang J. Abnormal pyramidal cell morphology and HCN channel expression in cortical dysplasia. Epilepsia. 2010;51(Suppl 3):52–55. doi: 10.1111/j.1528-1167.2010.02610.x. [DOI] [PMC free article] [PubMed] [Google Scholar]
- Hausser M, Raman IM, Otis T, Smith SL, Nelson A, du Lac S, Loewenstein Y, Mahon S, Pennartz C, Cohen I, Yarom Y. The beat goes on: spontaneous firing in mammalian neuronal microcircuits. J Neurosci. 2004;24:9215–9219. doi: 10.1523/JNEUROSCI.3375-04.2004. [DOI] [PMC free article] [PubMed] [Google Scholar]
- Hodgkin AL, Huxley AF. Currents carried by sodium and potassium ions through the membrane of the giant axon of Loligo. J Physiol. 1952;116:449–472. doi: 10.1113/jphysiol.1952.sp004717. [DOI] [PMC free article] [PubMed] [Google Scholar]
- Huang Z, Lujan R, Kadurin I, Uebele VN, Renger JJ, Dolphin AC, Shah MM. Presynaptic HCN1 channels regulate CaV3.2 activity and neurotransmission at select cortical synapses. Nat Neurosci. 2011;14:478–486. doi: 10.1038/nn.2757. [DOI] [PMC free article] [PubMed] [Google Scholar]
- Hughes SW, Cope DW, Crunelli V. Dynamic clamp study of Ih modulation of burst firing and delta oscillations in thalamocortical neurons in vitro. Neuroscience. 1998;87:541–550. doi: 10.1016/s0306-4522(98)00170-5. [DOI] [PubMed] [Google Scholar]
- Ivanova E, Muller F. Retinal bipolar cell types differ in their inventory of ion channels. Vis Neurosci. 2006;23:143–154. doi: 10.1017/S0952523806232048. [DOI] [PubMed] [Google Scholar]
- Jackson AC, Yao GL, Bean BP. Mechanism of spontaneous firing in dorsomedial suprachiasmatic nucleus neurons. J Neurosci. 2004;24:7985–7998. doi: 10.1523/JNEUROSCI.2146-04.2004. [DOI] [PMC free article] [PubMed] [Google Scholar]
- Khaliq ZM, Bean BP. Pacemaking in dopaminergic ventral tegmental area neurons: depolarizing drive from background and voltage-dependent sodium conductances. J Neurosci. 2010;30:7401–7413. doi: 10.1523/JNEUROSCI.0143-10.2010. [DOI] [PMC free article] [PubMed] [Google Scholar]
- Koizumi A, Jakobs TC, Masland RH. Inward rectifying currents stabilize the membrane potential in dendrites of mouse amacrine cells: patch-clamp recordings and single-cell RT-PCR. Mol Vis. 2004;10:328–340. [PubMed] [Google Scholar]
- Lewis TJ, Rinzel J. Self-organized synchronous oscillations in a network of excitable cells coupled by gap junctions. Network. 2000;11:299–320. [PubMed] [Google Scholar]
- Lewis TJ, Rinzel J. Dynamics of spiking neurons connected by both inhibitory and electrical coupling. J Comput Neurosci. 2003;14:283–309. doi: 10.1023/a:1023265027714. [DOI] [PubMed] [Google Scholar]
- Lyubarsky AL, Daniele LL, Pugh EN., Jr From candelas to photoisomerizations in the mouse eye by rhodopsin bleaching in situ and the light-rearing dependence of the major components of the mouse ERG. Vision Res. 2004;44:3235–3251. doi: 10.1016/j.visres.2004.09.019. [DOI] [PubMed] [Google Scholar]
- Manookin MB, Beaudoin DL, Ernst ZR, Flagel LJ, Demb JB. Disinhibition combines with excitation to extend the operating range of the OFF visual pathway in daylight. J Neurosci. 2008;28:4136–4150. doi: 10.1523/JNEUROSCI.4274-07.2008. [DOI] [PMC free article] [PubMed] [Google Scholar]
- Manor Y, Rinzel J, Segev I, Yarom Y. Low-amplitude oscillations in the inferior olive: a model based on electrical coupling of neurons with heterogeneous channel densities. J Neurophysiol. 1997;77:2736–2752. doi: 10.1152/jn.1997.77.5.2736. [DOI] [PubMed] [Google Scholar]
- Marc RE, Jones BW, Watt CB, Strettoi E. Neural remodeling in retinal degeneration. Prog Retin Eye Res. 2003;22:607–655. doi: 10.1016/s1350-9462(03)00039-9. [DOI] [PubMed] [Google Scholar]
- Margolis DJ, Detwiler PB. Cellular origin of spontaneous ganglion cell spike activity in animal models of retinitis pigmentosa. J Ophthalmol. 2011;2011:507037. doi: 10.1155/2011/507037. [DOI] [PMC free article] [PubMed] [Google Scholar]
- Margolis DJ, Newkirk G, Euler T, Detwiler PB. Functional stability of retinal ganglion cells after degeneration-induced changes in synaptic input. J Neurosci. 2008;28:6526–6536. doi: 10.1523/JNEUROSCI.1533-08.2008. [DOI] [PMC free article] [PubMed] [Google Scholar]
- Menzler J, Zeck G. Network oscillations in rod-degenerated mouse retinas. J Neurosci. 2011;31:2280–2291. doi: 10.1523/JNEUROSCI.4238-10.2011. [DOI] [PMC free article] [PubMed] [Google Scholar]
- Morris C, Lecar H. Voltage oscillations in the barnacle giant muscle fiber. Biophys J. 1981;35:193–213. doi: 10.1016/S0006-3495(81)84782-0. [DOI] [PMC free article] [PubMed] [Google Scholar]
- Muller F, Scholten A, Ivanova E, Haverkamp S, Kremmer E, Kaupp UB. HCN channels are expressed differentially in retinal bipolar cells and concentrated at synaptic terminals. Eur J Neurosci. 2003;17:2084–2096. doi: 10.1046/j.1460-9568.2003.02634.x. [DOI] [PubMed] [Google Scholar]
- Nelson R. AII amacrine cells quicken time course of rod signals in the cat retina. J Neurophysiol. 1982;47:928–947. doi: 10.1152/jn.1982.47.5.928. [DOI] [PubMed] [Google Scholar]
- Pan ZH, Hu HJ. Voltage-dependent Na+ currents in mammalian retinal cone bipolar cells. J Neurophysiol. 2000;84:2564–2571. doi: 10.1152/jn.2000.84.5.2564. [DOI] [PubMed] [Google Scholar]
- Pennartz CM, De Jeu MT, Geurtsen AM, Sluiter AA, Hermes ML. Electrophysiological and morphological heterogeneity of neurons in slices of rat suprachiasmatic nucleus. J Physiol. 1998;506:775–793. doi: 10.1111/j.1469-7793.1998.775bv.x. [DOI] [PMC free article] [PubMed] [Google Scholar]
- Peretz A, Degani N, Nachman R, Uziyel Y, Gibor G, Shabat D, Attali B. Meclofenamic acid and diclofenac, novel templates of KCNQ2/Q3 potassium channel openers, depress cortical neuron activity and exhibit anticonvulsant properties. Mol Pharmacol. 2005;67:1053–1066. doi: 10.1124/mol.104.007112. [DOI] [PubMed] [Google Scholar]
- Rinzel J, Terman D, Wang X, Ermentrout B. Propagating activity patterns in large-scale inhibitory neuronal networks. Science. 1998;279:1351–1355. doi: 10.1126/science.279.5355.1351. [DOI] [PubMed] [Google Scholar]
- Shlens J, Rieke F, Chichilnisky E. Synchronized firing in the retina. Curr Opin Neurobiol. 2008;18:396–402. doi: 10.1016/j.conb.2008.09.010. [DOI] [PMC free article] [PubMed] [Google Scholar]
- Stasheff SF. Emergence of sustained spontaneous hyperactivity and temporary preservation of OFF responses in ganglion cells of the retinal degeneration (rd1) mouse. J Neurophysiol. 2008;99:1408–1421. doi: 10.1152/jn.00144.2007. [DOI] [PubMed] [Google Scholar]
- Tang X, Schmidt TM, Perez-Leighton CE, Kofuji P. Inwardly rectifying potassium channel Kir4.1 is responsible for the native inward potassium conductance of satellite glial cells in sensory ganglia. Neuroscience. 2010;166:397–407. doi: 10.1016/j.neuroscience.2010.01.005. [DOI] [PMC free article] [PubMed] [Google Scholar]
- Tian M, Jarsky T, Murphy GJ, Rieke F, Singer JH. Voltage-gated Na channels in AII amacrine cells accelerate scotopic light responses mediated by the rod bipolar cell pathway. J Neurosci. 2010;30:4650–4659. doi: 10.1523/JNEUROSCI.4212-09.2010. [DOI] [PMC free article] [PubMed] [Google Scholar]
- Trexler EB, Li W, Massey SC. Simultaneous contribution of two rod pathways to AII amacrine and cone bipolar cell light responses. J Neurophysiol. 2005;93:1476–1485. doi: 10.1152/jn.00597.2004. [DOI] [PubMed] [Google Scholar]
- Tsay D, Dudman JT, Siegelbaum SA. HCN1 channels constrain synaptically evoked Ca2+ spikes in distal dendrites of CA1 pyramidal neurons. Neuron. 2007;56:1076–1089. doi: 10.1016/j.neuron.2007.11.015. [DOI] [PMC free article] [PubMed] [Google Scholar]
- Umino Y, Solessio E, Barlow RB. Speed, spatial, and temporal tuning of rod and cone vision in mouse. J Neurosci. 2008;28:189–198. doi: 10.1523/JNEUROSCI.3551-07.2008. [DOI] [PMC free article] [PubMed] [Google Scholar]
- Veruki ML, Hartveit E. AII (Rod) amacrine cells form a network of electrically coupled interneurons in the mammalian retina. Neuron. 2002;33:935–946. doi: 10.1016/s0896-6273(02)00609-8. [DOI] [PubMed] [Google Scholar]
- Veruki ML, Hartveit E. Electrical synapses mediate signal transmission in the rod pathway of the mammalian retina. J Neurosci. 2002;22:10558–10566. doi: 10.1523/JNEUROSCI.22-24-10558.2002. [DOI] [PMC free article] [PubMed] [Google Scholar]
- Veruki ML, Hartveit E. Meclofenamic acid blocks electrical synapses of retinal AII amacrine and on-cone bipolar cells. J Neurophysiol. 2009;101:2339–2347. doi: 10.1152/jn.00112.2009. [DOI] [PubMed] [Google Scholar]
- Veruki ML, Oltedal L, Hartveit E. Electrical synapses between AII amacrine cells: dynamic range and functional consequences of variation in junctional conductance. J Neurophysiol. 2008;100:3305–3322. doi: 10.1152/jn.90957.2008. [DOI] [PubMed] [Google Scholar]
- Vessey JP, Lalonde MR, Mizan HA, Welch NC, Kelly ME, Barnes S. Carbenoxolone inhibition of voltage-gated Ca channels and synaptic transmission in the retina. J Neurophysiol. 2004;92:1252–1256. doi: 10.1152/jn.00148.2004. [DOI] [PubMed] [Google Scholar]
- Wu C, Ivanova E, Cui J, Lu Q, Pan ZH. Action potential generation at an axon initial segment-like process in the axonless retinal AII amacrine cell. J Neurosci. 2011;31:14654–14659. doi: 10.1523/JNEUROSCI.1861-11.2011. [DOI] [PMC free article] [PubMed] [Google Scholar]
- Xia Y, Nawy S. The gap junction blockers carbenoxolone and 18b-glycyrrhetinic acid antagonize cone-driven light responses in the mouse retina. Vis Neurosci. 2003;20:429–435. doi: 10.1017/s0952523803204089. [DOI] [PubMed] [Google Scholar]
- Xin D, Bloomfield SA. Comparison of the responses of AII amacrine cells in the dark- and light-adapted rabbit retina. Vis Neurosci. 1999;16:653–665. doi: 10.1017/s0952523899164058. [DOI] [PubMed] [Google Scholar]
- Ye JH, Goo YS. The slow wave component of retinal activity in rd/rd mice recorded with a multi-electrode array. Physiol Meas. 2007;28:1079–1088. doi: 10.1088/0967-3334/28/9/009. [DOI] [PubMed] [Google Scholar]