Abstract
A simple, efficient, precise and accurate absorbance ratio method have been developed for the estimation of eprosartan mesylate and hydrochlorothiazide in pure and in fixed dose combination. In this method, UV spectra of eprosartan mesylate and hydrochlorothiazide were overlayed which involves the formation of Q-absorbance equation at 249.1 nm (isobestic point) and 274.5 nm, the max of hydrochlorothiazide. Both the drugs obeyed Beers law in the concentration range of 6-36 μg/ml and 1-10 μg/ml for eprosartan mesylate and hydrochlorothiazide, respectively. The accuracy of the method was determined by recovery studies and was found to be in the range of 102.29-103.10% and 99.52-101.60% for eprosartan mesylate and hydrochlorothiazide, respectively. The method was validated as per ICH guidelines and statistically. The method showed good reproducibility and recovery with % RSD less than 2. The method was found to be simple, economic, accurate and reproducible and can be used for routine analysis of eprosartan mesylate and hydrochlorothiazide in pure and in fixed dose combinations.
Keywords: Absorbance ratio method, eprosartan mesylate, hydrochlorothiazide, ICH guidelines, method validation
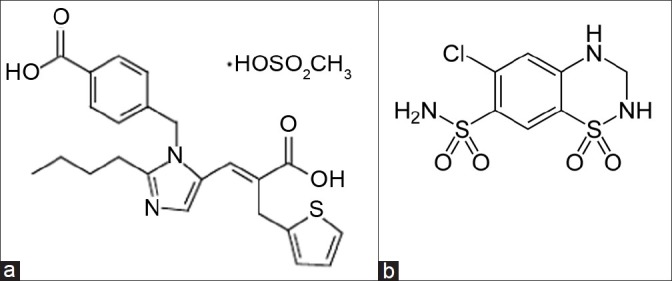
Eprosartan mesylate (EPM)[1,2] a new drug and it is used as an antihypertensive agent which is chemically monomethane sulfonate of (E)-2-butyl-1-(p-carboxybenzyl)-α-2-thienylmethylimidazole-5-acrylic acid (fig. 1). EPM is not official in any pharmacopoeia. EPM, a potent vasoconstrictor, is the principal pressor agent of rennin-angiotensin system. Hydrochlorothiazide (HCT)[3] is used as an antihypertensive agent which is chemically 6-chloro-1,1-dioxo-3,4-dihydro-2H-1,2,4-benzothiadiazine-7-sulfonamide (fig. 1). HCT belongs to the thiazide class of diuretics, acting on the kidneys to reduce sodium (Na) reabsorption in the distal convoluted tubule. This increases the osmolarity in the lumen, causing less water to be reabsorbed from the collecting ducts. This leads to increased urinary output. HCT is official in IP[4], BP[5] and USP[6].
Fig. 1.

Chemical structures
(a) Eprosartan Mesylate (EPM); (b) Hydrochlorothiazide (HCT)
Literature survey revealed that SPE-HPLC-UV[7,8] and LC-MS-MS[9] methods were reported for the estimation of EPM in plasma. HPLC[10], HPTLC and spectroscopic methods[11] have been reported for the determination of HCT in combination with other drugs. HPTLC[12] method was reported for the estimation of EPM and HCT in combined tablet dosage forms. However, there is no UV spectrophotometric method has been reported for the estimation of EPM and HCT in combination. Hence the present work aims to develop a simple, precise, accurate and validated UV spectrophotometric method (absorbance ratio method)[13] for the estimation of EPM and HCT in pure and in fixed dose combination. Confirmation of the applicability of the developed method was validated according to the International Conference on Harmonization (ICH)[14,15] guidelines for the determination of EPM and HCT in pure and in fixed dose combination.
Pharmaceutically pure sample of EPM and HCT were obtained as generous gift samples from Sairam Organics Pvt. Ltd., Hyderabad, India. 0.1M Sodium hydroxide AR grade was used as solvent in this study. Shimadzu model 1700 Double Beam UV/Vis spectrophotometer with a pair of 10 mm matched quartz cells was used for absorbance measurements.
The tablet formulation containing 600 mg of EPM and 25 mg of HCT (Teveten HCT, Solvay Pharmaceuticals, Mumbai, India) was procured from the local market. All the chemicals and reagents used were obtained from Qualigens India Pvt. Ltd., Mumbai, India. 60 mg of EPM and 20 mg of HCT were accurately weighed separately and transferred to two different 100 ml volumetric flasks. Each drug was dissolved in 0.1M sodium hydroxide and made up to the mark with 0.1M sodium hydroxide. The standard stock solutions contain 600 μg/ml of EPM and 200 μg/ml of HCT. These solutions were further diluted separately to obtain (10 μg/ml) of each drug individually.
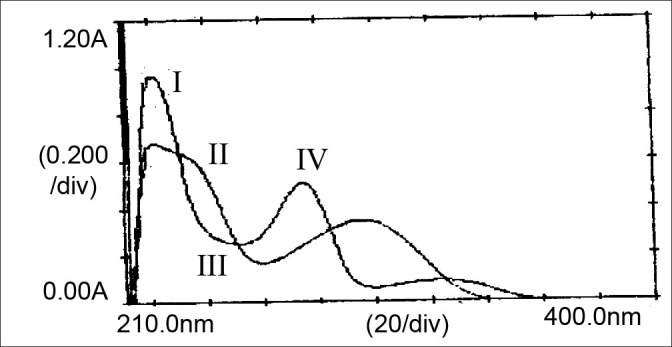
Each standard solution was scanned between the range 200-400 nm in 1 cm cell against blank. Two wavelengths were selected from the overlain spectra. i.e. 249.1 nm (isobestic point) and 274.5 nm (λ max of HCT) for the formation of Q absorbance equation.
One to six millilitres of standard stock solution of EPM and 0.5-5.0 ml standard stock solution of HCT were transferred into a series of six 100 ml volumetric flasks separately and made up to mark with 0.1M sodium hydroxide. The absorbance of different concentration solutions was measured at 274.5 nm and 249.1 nm against 0.1 M sodium hydroxide as blank. The calibration curve was plotted using concentration against absorbance. The solutions were found to be linear with the concentration range of 6-36 μg/ml of EPM and 1-10 μg/ml of HCT. The procedure was repeated for six times.
Different mixtures of the two drugs were prepared by transferring different volumes of EPM and HCT from working standard solutions into 100 ml volumetric flasks and diluting to volume with 0.1M sodium hydroxide. The concentrations of both EPM and HCT were determined by measuring the absorbance of the prepared mixtures at 274.5 nm and 249.1 nm by using absorbance ratio method.
Twenty tablets were weighed accurately and average weight was calculated. The tablets were triturated to a fine powder. An accurately weighed quantity of tablet powder equivalent to 60 mg of EPM was weighed and transferred into 100 ml volumetric flask and added a minimum quantity of 0.1M sodium hydroxide to dissolve the substance and made up to the volume with the same (600 μg/ml). The solution was sonicated for 15 min and centrifuged for 15 min at 100 rpm. The supernatant liquid was separated and filtered through Whatmann filter paper No. 41. From the clear solution, further dilutions were made by diluting 4 ml to 100 ml with 0.1M sodium hydroxide to obtain 24 μg/ml solution of EPM which also contains 1 μg/ml of HCT theoretically. The absorbance was measured at their selected wavelengths and the concentrations of two drugs were estimated by using absorbance ratio method as follows.
For HCT, Cx = (Q0-Q2)/(Q1-Q2) × A/a1---(1), and for EPM, Cy = (Q0-Q1)/(Q2-Q1) × A/a2--(2), Where, Q0 = Absorbance of mixture at 249.1 nm/ Absorbance of mixture at 274.5 nm, Q1 = Absorptivity of HCT at 249.1 nm/ Absorptivity of HCT at 274.5 nm, Q2 = Absorptivity of EPM at 249.1 nm/ Absorptivity of EPM at 274.5 nm, A = Absorbance of mixture at Isobestic point, a1 = Absorptivity of HCT at Isobestic point, a2 =Absorptivity of EPM at Isobestic point, CX = Concentration of HCT, CY = Concentration of EPM. The procedure was repeated for six times.
The accuracy of the proposed method was confirmed by recovery studies. To the pre analyzed formulation, a known amount of raw material was added and it can be analyzed by the proposed method.
To an accurately weighed quantity of the tablet powder equivalent to 60 mg of EPM, 7.5, 15 and 22.5 mg of EPM and 2.5, 5 and 7.5 mg of HCT raw materials were added into a series of 100 ml volumetric flasks. The procedure was repeated as per the analysis of formulation. The amount of each drug recovered was calculated. The procedure was repeated for three times for each concentration.
In quantitative estimation of two components of EPM and HCT by Q-analysis method, absorbance were measured at the isobestic point and wavelength maximum of any one of two drugs. From the overlain spectra of EPM and HCT (fig. 2), absorbance were measured at selected wavelengths i.e., 249.1 nm (isobestic point) and at 274.5 nm, the λmax of HCT. The absorpitivty coefficients of each drug at both wavelengths were determined. Both EPM and HCT obeyed Beers law in the concentration range of 6–36 μg/ml and 1–10 μg/ml, respectively. The optical characteristics such as correlation coefficient, slope, intercept, LOD, LOQ, Molar absorpitivity and Sandell's sensitivity were calculated and are shown Table 1. The correlation coefficient for EPM was found to be 0.9997 and 0.9998 and for HCT, it was found to be 0.9998 and 0.9999 at 274.5 nm and 249.1 nm, respectively. This indicates that the drugs were linear with the selected concentration range.
Fig. 2.

Overlain spectrum of EPM and HCT in 0.1M sodium hydroxide Both the drugs containing 10 μg/ ml; I is HCT; II is EPM; III is Isobestic point (249.1 nm) and IV is the λmax of HCT (274.5 nm)
TABLE 1.
OPTICAL CHARACTERISTICS OF EPM AND HCT

To study the mutual interference, if any, in the simultaneous estimation of EPM and HCT, synthetic mixtures containing various proportions of EPM and HCT were prepared and the contents were estimated by the proposed method. The percentage recovery varied from 99.29% to 101.06% for EPM and 99.29% to 101.69% for HCT indicating that no mutual interference in different ratios for both the drugs.
The amount of EPM and HCT in combined tablet formulation was determined and it was found to be 99.31±0.9821 and 99.91±0.7690 for EPM and HCT respectively. To study the precision of the method the analysis of formulation was carried out for six times. The % RSD values were found to be 0.9889 for EPM and 0.7697 for HCT. The low % RSD values indicated that the amount found was in good agreement with the label claim. Hence the precision of the method was confirmed.
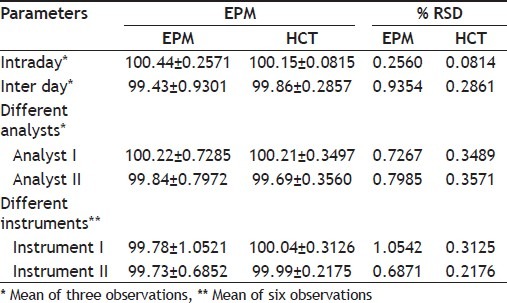
Further, the precision was confirmed by intermediate precision. The analysis of formulation was carried out for three times in the same day and on three successive days. The % RSD values for inter day and intraday analysis of formulation was found to be less than 2%. The ruggedness was confirmed by different analysts and different instruments. The % RSD values for different analysts and different instruments were found to be less than 2%. Hence, the intermediate precision and ruggedness were confirmed. The results for intermediate precision and ruggedness are shown in Table 2.
TABLE 2.
INTERMEDIATE PRECISION AND RUGGEDNESS OF THE METHOD

The accuracy of method was confirmed by recovery studies. To the pre analyzed formulation a known quantity of raw material was added in different concentrations. The amount of drug recovered was calculated and the percentage recovery was found to be in the range of 102.29-103.10% for EPM, 99.52-101.60% for HCT. The procedure was repeated for three times for each concentration and the %RSD values were calculated. The low %RSD values ensure that the excipients used in formulation are not interfering in the analysis of EPM and HCT.
The proposed method is simple, accurate, precise and selective for the simultaneous estimation of EPM and HCT in pure and in fixed dose combination. The method is economical, rapid and do not require any sophisticated instruments contrast to chromatographic method. Hence it can be effectively applied for the routine analysis of EPM and HCT in pure and in fixed dose combination.
ACKNOWLEDGEMENTS
The authors wish to thank Arul Thiru Amma, Thirumati Amma ACMEC TRUST and Dr. T. Ramesh M.D., MAPIMS, Melmaruvathur, for their kind help and providing all necessary facilities. The authors also thankful to Sairam Oraganics, Hyderabad for providing the souvenir sample of EPM and HCT.
Footnotes
Anandakumar, et al.: Simultaneous Estimation of Eprosartan Mesylate and Hydrochlorothiazide by UV Spectrophotometry
REFERENCES
- 1.Budavari S. Merck Research Laboratories. 14th ed. Whitehouse Station, NJ: Merck and Co. Inc; 2006. The Merck Index: An Encyclopedia of Chemicals, Drugs and Biologicals; pp. 621–2. [Google Scholar]
- 2. [Last accessed on 2009 Jul 08]. Available from: http://www.en.wikipedia.org/wiki/Eprosartan_mesylate/
- 3. [Last accessed on 2009 Jul 08]. Available from: http://www.en.wikipedia.org/wiki/Hydrochlorothiazide/
- 4.Government of India, Ministry of wealth and family welfare. Vol. 2. New Delhi: The Controller of Publication; 2007. Indian Pharmacopoeia; pp. 1194–6. [Google Scholar]
- 5.Department of Health and Social Services for Northen Ireland. Vol. 1. London: Stationery Publication; 1993. British Pharmacopoeia; p. 330. [Google Scholar]
- 6.Asian ed. Vol. 2. Rockville MD: United State Pharmacopoeial Convention Inc; 2009. The United State Pharmacopoeia 32 and National Formulary 27; pp. 2566–8. [Google Scholar]
- 7.Ferreiros N, Iriarte G, Alonso RM, Jimenez RM. MultiSimplex and experimental design as chemometric tools to optimize a SPE-HPLC-UV method for the determination of Eprosartan in human plasma samples. Talanta. 2006;69:747–56. doi: 10.1016/j.talanta.2005.11.036. [DOI] [PubMed] [Google Scholar]
- 8.Ferreiros N, Iriarte G, Alonso RM, Jimenez RM, Ortiz E. Validation of a solid phase extraction - high performance liquid chromatographic method for the determination of Eprosartan in human plasma. J Chromatogr A. 2006;1119:309–14. doi: 10.1016/j.chroma.2006.02.055. [DOI] [PubMed] [Google Scholar]
- 9.Liu F, Xu Y, Gao S, Zhang J, Guo Q. Determination of hydrochlorothiazide in human plasma by liquid chromatography/tandem mass spectrometry. J Pharm Biomed Anal. 2007;44:1187–91. doi: 10.1016/j.jpba.2007.04.020. [DOI] [PubMed] [Google Scholar]
- 10.Farthing D, Fakhry I, Ripley EB, Sica D. Simple method for determination of Hydrochlorothiazide in human urine by high performance liquid chromatography utilizing narrow bore chromatography. J Pharm Biomed Anal. 1998;17:1455–9. doi: 10.1016/s0731-7085(98)00021-1. [DOI] [PubMed] [Google Scholar]
- 11.El-Gindy A, Ashour A, Abdel-Fattah L, Shabana MM. Spectrophotometric and HPTLC-densitometric determination of Lisinopril and Hydrochlorothiazide in binary mixtures. J Pharm Biomed Anal. 2001;25:923–31. doi: 10.1016/s0731-7085(01)00382-x. [DOI] [PubMed] [Google Scholar]
- 12.Patel HU, Suhagia BN, Patel CN. Simultaneous analysis of Eprosartan and Hydrochlorothiazide in tablets by high - performance thin - layer chromatography with ultraviolet absorption densitometry. Acta Chromatogr. 2009;21:319–26. [Google Scholar]
- 13.Beckett AH, Stenlake JB. 4th ed. Part 2, New Delhi: CBS Publishers and Distributors; 2007. Practical Pharmaceutical Chemistry; pp. 248–8. [Google Scholar]
- 14.Text on validation of analytical procedures: Methodology International Conference on Harmonization, Geneva. ICH guidelines Q2A. 1994 Mar;:1–5. [Google Scholar]
- 15.Text on validation of analytical procedures: Methodology International Conference on Harmonization, Geneva. ICH guidelines Q2B. 1996 Mar;:1–8. [Google Scholar]


