

Abstract
Background
Diagnosis of eosinophilic esophagitis (EoE) currently requires endoscopic biopsy and histopathologic analysis of the biopsy specimens to count intraepithelial eosinophils. Reflectance confocal microscopy (RCM) is an endomicroscopy technology that is capable of obtaining high-resolution, optically sectioned images of esophageal mucosa without the administration of exogenous contrast.
Objective
In this study, we investigated the capability of a high-speed form of RCM, termed spectrally encoded confocal microscopy (SECM), to count intraepithelial esophageal eosinophils and characterize other microscopic findings of EoE.
Design
A total of 43 biopsy samples from 35 pediatric patients and 8 biopsy samples from 8 adult patients undergoing EGD for EoE were imaged by SECM immediately after their removal and then processed for routine histopathology. Two SECM readers, trained on adult cases, prospectively counted intraepithelial eosinophils and detected the presence of abscess, degranulation, and basal cell hyperplasia on SECM images from the pediatric patients. A pathologist blinded to the SECM data analyzed the same from corresponding slides.
Setting
The Gastrointestinal Unit, Massachusetts General Hospital.
Results
Eosinophils by SECM demonstrated a higher reflectance than the surrounding cells and other inflammatory cells. There was good correlation between SECM and histology maximum eosinophil counts/high-power field (R = 0.76, P < .0001). Intra- and interobserver correlations for SECM counts were very good (R = 0.93 and R = 0.92, respectively; P < .0001). For the commonly used eosinophil count cutoff of 15 per high-power field, the sensitivity and specificity of SECM for EoE were 100%. The sensitivity and specificity for abscess, degranulation, and basal cell hyperplasia were 100% and 82%, 91% and 60%, and 94% and 80%, respectively. Intra- and interobserver agreements for these microscopic features of EoE were very good (κ = 0.9/0.9, 0.84/1.0, 0.91/0.81, respectively).
Limitation
Ex vivo study.
Conclusions
This study demonstrates that RCM can be used to accurately count intraepithelial eosinophils and identify other microscopic abnormalities associated with EoE on freshly excised biopsy samples. These findings suggest that RCM may be developed into a tool for assessing eosinophilic infiltration in the esophagus in vivo.
Eosinophilic esophagitis (EoE) is an inflammatory disease of the esophagus that is characterized by the infiltration of eosinophils within the esophageal epithelium in response to inhaled or food allergens. Only 15 years ago EoE was considered a rare disorder, but it is now known to be more common and increasing in incidence, affecting 0.01% to 0.1% of the pediatric and adult populations.1–3 Although the natural history of this disease is not fully understood, experts fear that long-standing eosinophilic inflammation may give rise to permanent esophageal damage, leading to fibrosis of the lamina propria, esophageal narrowing, and stricture.4–7
Currently, diagnosis of EoE requires upper endoscopy with multiple biopsy samples obtained at the proximal, mid, and distal portions of the esophagus. Eosinophils on histologic slides are counted; finding greater than 15 to 24 eosinophils per high-power field (HPF) (= 400×) in any one of the biopsy specimens renders a diagnosis of EoE.8,9 The number of biopsies performed is also important as a recent study showed that the sensitivity for diagnosis of EoE was only 55% with 1 biopsy, but increased to 100% after 5 biopsies.9 Other histopathologic findings, such as eosinophil degranulation, microabscess, and basal cell hyperplasia, are also seen in EoE, but are currently not required for diagnosis.8,10 Follow-up diagnosis by endoscopic biopsy can be used to manage multiple therapy decisions and regimens throughout the course of the disease.4,7,11–20 Because a high number of repeat endoscopies and biopsies can be involved in the monitoring process, less invasive and more cost-effective methods to assess this disease could decrease the personal and cost burden associated with patient follow-up.4,19,21,22 Further-more, with in vivo microscopy, it is possible to obtain image information from a much larger portion of the mucosa than histology, allowing a more complete assessment of the inflammatory process, which is known to frequently be heterogeneous.9
Confocal laser endomicroscopy (CLE) is a new technique for obtaining microscopic images of GI tract tissues in vivo.23 The 2 clinically available devices, probe-based CLE (pCLE) (Mauna Kea Technologies, Paris, France) and endoscope-based CLE (eCLE) (Pentax, Tokyo, Japan), have been shown to be capable of visualizing epithelial cells, including esophageal intestinal metaplasia, by using intravenous or topical fluorescein as a contrast agent.24–26 Recently, Neumann et al27 described a case report of eosinophilic esophagitis by using fluorescence-based pCLE.
A different form of CLE, termed reflectance confocal microscopy (RCM), measures confocal images of backscattered light and therefore does not require the administration of contrast.28,29 Spectrally encoded confocal microscopy (SECM) is a high-speed form of RCM that is capable of being miniaturized and can acquire images of microscopic structures without fast mechanical scanning.30 Since its first invention, this technology has been developed for faster acquisition, enabling, in principle, scanning of the entire length of the esophagus in a practical procedure time.31 In a recent study, it was suggested that eosinophils may have a very high SECM signal, enabling their differentiation from surrounding esophageal tissues.32 Were SECM to be capable diagnosing EoE, it could become a less-invasive method for monitoring patients on corticosteroid/dietary therapy that does not require the excisional biopsy needed for histopathology or the administration of fluorescent contrast agents used in pCLE and eCLE. In this histopathologic correlative biopsy study, we used SECM to investigate the capability of RCM for use in identifying/counting intraepithelial eosinophils and for the diagnosis of other microscopic features associated with EoE.
MATERIALS AND METHODS
Patient enrollment
SECM imaging was conducted on freshly excised esophageal biopsy samples from patients undergoing a routine EGD at the Massachusetts General Hospital GI endoscopy suites for assessment of EoE from September 2009 to May 2010. Patients with a history of EoE or at risk of having EoE were enrolled in this study. A total of 43 biopsy samples from 35 pediatric patients and 8 biopsy samples from 8 adult patients were imaged by SECM immediately after excision. No biopsy samples were excluded from the analysis. The study protocol was approved by the Partners Internal Review Board under institutional review board expedited approval (Protocol 2007-P-000656). For this study, waiver of consent and authorization to use personal health information was approved by the institutional review board.
SECM system for imaging biopsy samples
The bench-top SECM system used for this study was previously described in detail.32,33 In brief, the SECM system used a wavelength-swept source (central wavelength, 1320 nm; bandwidth, 70 nm; repetition rate, 5 kHz) and a water-immersion objective lens with an effective numerical aperture of 0.7. A single-mode illumination and multi-mode detection imaging configuration was used to reduce laser speckle noise and improve the signal-to-noise ratio.34 Large-area imaging of biopsy samples was achieved by using 2 motorized translation stages. The transverse and axial (depth) resolutions of the bench-top SECM system were 2.3 μm and 9.7 μm, respectively. The transverse sampling resolution was 0.5 μm/pixel. Images were digitized with 16-bit resolution and displayed gray scale. The image dimensions varied from 2 × 1 mm to 5 × 3.6 mm depending on the sample size. The number of axial sections was 15 or 20 with axial scan intervals of 10 μm, resulting in a total depth range between 150 and 200 μm, respectively. The imaging time was between 2 and 15 minutes, depending on the image dimensions and the number of axial sections.
Imaging procedure
During routine EGD, pinch biopsy samples were taken with forceps per standard patient care. The first 1 or 2 biopsy samples excised from each patient were used in this study. Whether 1 or 2 biopsies were used depended on the total duration of the experimental procedure, which per institutional review board protocol, could not exceed 15 minutes. The biopsy samples were gently washed with phosphate-buffered saline solution to remove excess mucus. The samples were examined by using a portable magnifier to determine their orientation so that they could be imaged with the epithelial surfaces preferably facing up toward the objective lens. The samples were then placed in imaging chambers under coverslips and imaged by the SECM bench-top system. No exogenous agents were applied to the specimens. After imaging, the biopsy samples were marked with black ink, placed into formalin containers, and sent to the pathology laboratory for routine histologic processing.
Histopathologic processing
All biopsy samples were embedded in paraffin, sectioned with a thickness of 5 μm, and subsequently stained with hematoxylin and eosin (H&E) per the standard of care of the Massachusetts General Hospital Gastrointestinal Pathology Service. All slides were digitized in their entirety by using the Nanozoomer (Hamamatsu Corporation, Japan) whole-slide scanner. For selected cases containing eosinophils, we additionally attempted to obtain a 1-to-1, cellular level match between SECM and histology. For these cases, we re-embedded the remaining biopsy sample so that it could be sectioned en face. The specimen was leveled every 4 μm through the entire sample, stained with H&E, and digitized. One-to-one matches were obtained by identifying corresponding architecture on histology and SECM and then by increasing magnification to identify individual matching cells on both data sets. To facilitate this matching process, the red channels of the digitized H&E slides were divided by the green channels to create red/green images that highlighted the eosinophils.
SECM image processing
SECM images were background-subtracted to remove any wavelength-dependent intensity variations of the light source. Two-dimensional median filtering by using a 2 × 2-pixel kernel was performed to reduce salt and pepper noise. Cross-sectional images were generated from the 3-dimensional (3D) SECM data sets by first registering each frame by using rigid body rotation (Stackreg, ImageJ 1.43)35,36 and then by 2-dimensional orthogonal multiplanar reconstruction with a maximum intensity projection of 5 μm (Osirix 3.6). For slides in which we were able to obtain 1:1 cellular level matches between SECM and histology, we calculated the target-to-background intensity ratio (TBIR) of the inflammatory cells, defined as the mean SECM intensity of the inflammatory cells divided by the mean SECM intensity of the surrounding tissue.
Histopathologic analysis
Original cross-sectional H&E-stained histology slides from the biopsy specimens were randomized and reviewed by a GI pathologist (G.L.) who was blinded to the SECM results. Maximum eosinophil counts per high-power field (HPF, 400×, 550-μm field), and the presence/ absence of abscess, eosinophil degranulation, and basal cell hyperplasia were tabulated. Eosinophil degranulation was evaluated on H&E slides as absent/mild versus extensive in the maximally involved areas on the selected subset of cases that contained intraepithelial eosinophils (≥1 eosinophils/HPF).
SECM image analysis
Two SECM readers (G.T. [reader 1], H.Y. [reader 2]) were trained to count eosinophils and diagnose abscess, eosinophil degranulation, and basal cell hyperplasia by evaluating corresponding SECM and histopathology images from the adult cases. Criteria for diagnosis are depicted in Table 1. These readers who were blinded to the histopathology of the pediatric cases then prospectively read the SECM images from the 43 biopsy samples from pediatric patients, including obtaining the maximum eosinophil count per cross-sectional HPF (550-μm field) and delineating the presence/absence of abscess, extensive eosinophil degranulation, and basal cell hyperplasia on transverse image planes. Readers repeated the SECM analysis 24 hours after the first reading to assess the intraobserver variation.
Table 1.
SECM criteria for diagnosis
| Feature | SECM criteria |
|---|---|
| Eosinophils | Highly reflecting cells |
| Irregular distribution | |
| Bilobed nuclei | |
| Abscess | Accumulation of SECM-delineated eosinophils |
| Degranulation | Stellate or irregular cell contours |
| Poorly delineated cell boundaries | |
| Amorphous highly reflecting granular material | |
| Basal cell hyperplasia | Basal cell layer thickness >20 μm |
SECM, Spectrally encoded confocal microscopy.
Statistical analysis
Primary results reported are from SECM reader 1. Correlations between SECM and histology maximum eosinophil counts and intra- and interobserver correlations for SECM counts were determined by using linear regression with Pearson correlation coefficients and P values (PRISM 5, GraphPad Software, Inc, La Jolla, Calif). For the commonly used eosinophil count cutoff of 15 eosinophils/HPF,8 the sensitivity and specificity of SECM for EoE were calculated. Cohen's κ was used for analysis of intra- and interobserver agreement. The sensitivity and specificity and intra- and interobserver agreements for SECM diagnosis of abscess, eosinophil degranulation, and basal cell hyperplasia were determined by using histology as the criterion standard. For eosinophil degranulation, we used a subset of cases in which histology showed the presence of eosinophils. Mean TBIR values are reported ± standard deviation (SD). Unpaired Student t tests were used to assess differences in signal strengths for distinct cell types. A P value of <.05 was considered statistically significant.
RESULTS
A total of 43 biopsy samples from 35 pediatric patients (24 male and 11 female; median age 11.2 years; range 1.8–21.1 years) were successfully imaged and processed for analysis. All of the biopsy samples were used for analysis. Histopathologic analysis revealed that 17 of the 43 biopsy samples (40%) were positive for EoE with an increased number of esophageal eosinophils (>15 eosinophils/HPF), 10 cases (23%) were positive for abscess, 11 (26%) for eosinophil degranulation, and 18 (42%) for basal cell hyperplasia. SECM imaging was successfully performed in all cases, with 22 (51%) imaged with the luminal surface up.
SECM imaging of normal esophageal squamous epithelium, confirmed by histology (Fig. 1A), demonstrated lamina propria papillae (Fig. 1B), keratinocyte cell walls, and nuclei (Fig. 1C). The thickness of the basal layer in the normal esophageal squamous epithelium was measured to be approximately 20 μm (arrows in Fig. 1C), consistent with the histopathologic finding. In contrast to the images from the normal squamous mucosa, SECM images from patients with EoE showed irregularly distributed highly reflecting cells within the epithelium, many of which contained bilobed nuclei typical of eosinophils (Fig. 2).
Figure 1.
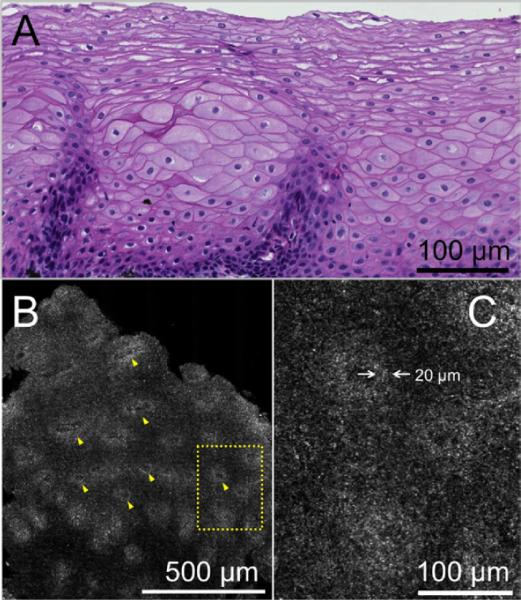
Histopathologic and spectrally encoded confocal microscopy (SECM) images from esophageal biopsy of normal squamous mucosa from the mid esophagus of a 20-year-old female patient with a previous diagnosis of eosinophilic esophagitis and currently taking acid reflux medication. A, Histopathologic section (H&E, orig. mag. ×20) shows normal squamous mucosa with no evidence of eosinophils. B, Corresponding SECM image of normal squamous mucosa 80 μm below the surface shows transversely sectioned papillae (yellow arrowheads) at low magnification. C, High-magnification view of the SECM image demonstrates regions of higher reflectance surrounding the papillae. The thickness of this layer was measured to be 20 μm, consistent with the size of basal cells (white opposing arrows).
Figure 2.
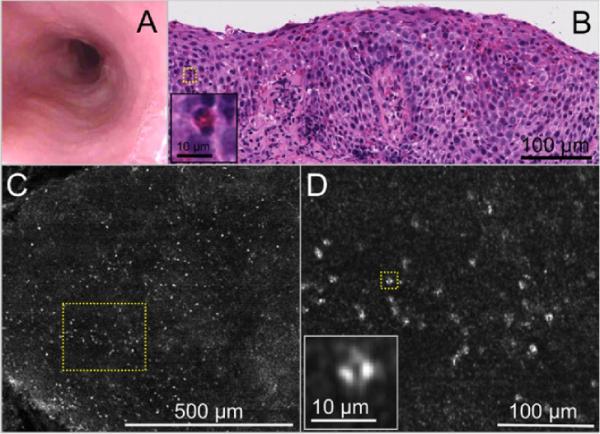
Images obtained from an 11-year-old male patient with a diagnosis of eosinophilic esophagitis who was on a regular diet. A, Videoendoscopy image demonstrates faint evidence of rings, white plaques, and a slightly diminished vascular pattern. B, Histopathology (H&E, orig. mag. ×20) demonstrates an abundance of eosinophils within the squamous epithelium (>25 eosinophils/high-power field) with evidence of degranulated eosinophils, abscess, and basal cell hyperplasia. Inset, corresponding to yellow dotted box in B shows an eosinophil with a bilobed nucleus. C, SECM, obtained at 50 μm from the surface, demonstrates a diffuse infiltration of highly scattering cells at low magnification. D, A higher magnification view of the yellow dotted box in C and inset shows that these cells are eosinophils with bilobed nuclei.
One-to-one registration of SECM with histology images of eosinophils
To confirm the capability of SECM to identify individual eosinophils, we conducted 3D histology on selected biopsy samples and registered them with their corresponding 3D SECM data sets. Figure 3A and B depicts digitized histology demonstrating numerous eosinophils, so denoted by eosinophilic cytoplasm and presence of a nucleus (red arrows) and highlighted in the red/green transformation of the digitized H&E slide (red arrows, Fig. 3C,D). Bright cells in the registered SECM images were identified at the same location as each of the eosinophils identified by histology (green arrows, Fig. 3E,F). Other highly reflecting pixels in the SECM image corresponded to eosinophil cytoplasmic fragments or the presence of an eosinophil in the adjacent histologic section. The mean TBIR for eosinophils was 3.93 ± 1.39 (n = 28, mean ± SD). We found that other leukocytes, including lymphocytes and neutrophils, identified in the matching 3D SECM histology data sets, did not have a strong SECM signal compared with eosinophils. Lymphocytes exhibited very low SECM signal, with a mean TBIR of 1.04 ± 0.26 (n = 18, mean ± SD). The difference between the TBIR for eosinophils and lymphocytes was statistically significant (P < .0001). By using the matching 3D SECM histology data sets, we only were able to match 2 neutrophils at the single-cell level. The mean TBIR for neutrophils was 1.68 ± 0.25 (mean ± SD, P < .05). We note that neutrophil TBIR result should be interpreted with caution because there were so few neutrophils identified. The paucity of neutrophils in our specimens is not unexpected, given the low differential distribution of neutrophils in EoE patients.37
Figure 3.

Spectrally encoded confocal microscopy (SECM) and histopathologic images of biopsy sample acquired from a 6-year-old male patient with eosinophilic esophagitis, demonstrating 1-to-1 cellular level matches. A, Digital histology (H&E, orig. mag. ×20) shows the papillae structure (red asterisks) and intraepithelial eosinophils. B, Expanded view of A shows intact eosinophils (red arrows) as well as eosinophilic cytoplasm fragments. C, D, Color transformation (red/green) of histology in A and B, respectively, allows the eosinophils (red arrows) to be seen more clearly. E, F, Corresponding registered SECM images demonstrate the papillae (green asterisks) and highly reflecting cells (green arrows) that are directly matched to the eosinophils seen by histology. Scale bars = 100 μm.
Eosinophil counts
Cross-sectional reformatting of the SECM data sets (Fig. 4A–C) allowed the SECM readers to obtain eosinophil counts that could be directly compared with the counts rendered by analysis of cross-sectional histopathology. A high degree of correlation was found between the maximum SECM and histology eosinophil counts/HPF (R = 0.76; P < .0001) (Fig. 4D). Intra- and interobserver correlations for SECM counts were also strong (R = 0.93 and R = 0.92, respectively; P < .0001). When a cutoff threshold of 15 eosinophils/HPF was used, SECM was 100% sensitive (95% CI, 74%–100%) and 100% specific (95% CI, 74%–100%) for diagnosing EoE.
Figure 4.

Representative orthogonally reformatted spectrally encoded confocal microscopy (SECM) images and scatterplot of histology versus SECM eosinophil counts (43 biopsy samples; reader 1). A, Cross-sectional SECM image of biopsy sample acquired from a 3-year-old male patient with no diagnostic abnormality identified by histopathology. B, Cross-sectional SECM image of biopsy sample acquired from a 13-year-old male patient with established eosinophilic esophagitis (EoE). The SECM image shows frequent highly scattering cells, consistent with eosinophils. C, Cross-sectional SECM image of biopsy acquired from a 6-year-old male patient with moderately active EoE. The SECM image demonstrates numerous eosinophils. D, The scatterplot of histology and SECM counts (reader 1) was rendered on the high-power field (550-μm diameter circular region) that contained the maximum eosinophil count. Scale bars = 50 μm.
Other microscopic features of EoE
We found that SECM can also enable the visualization of other microscopic features associated with EoE. Figure 5A and B shows representative images of an abscess from the biopsy sample of a 14-year-old EoE patient. Aggregates of eosinophils shown in the histology slide (Fig. 5A) and SECM image (Fig. 5B) were found exclusively in EoE patients. The images in Figure 5C,D were obtained from a biopsy sample taken from a 14-year-old male patient with established EoE on an elimination diet. Eosinophilic degranulation, which is thought to be one of the features that distinguish EoE from GERD,38,39 was observed in the histology slide (Fig. 5C) as well as the SECM image (Fig. 5D). Figure 5E,F depicts images of a biopsy sample from a 2-year-old male patient with EoE. Histology (Fig. 5E) shows basal cell hyperplasia, elongation of the lamina propria papillae, and the presence of intraepithelial eosinophils, consistent with EoE.10,37,40 A corresponding SECM image also demonstrated numerous eosinophils as well as a thickened basal cell layer (Fig. 5F). The measured thickness of this layer was approximately 70 μm (arrows in Fig. 5F), which was increased compared with that found in normal biopsy samples (Fig. 1C). Results comparing SECM with histopathology findings are summarized in Table 2, including sensitivity, specificity, and inter- and intraobserver agreement for abscess, degranulation, and basal cell hyperplasia.
Figure 5.

Representative histology and spectrally encoded confocal microscopy (SECM) images of microscopic features of eosinophilic esophagitis. A, Histology image of eosinophilic abscess shows aggregates of eosinophils in the esophageal epithelium. B, Corresponding SECM image demonstrates a large number of closely spaced eosinophils. C, Histology image of eosinophil degranulation shows stellate eosinophils and extracellular eosinophilic granules. D, Corresponding SECM image demonstrates cells that have an irregular shape and poorly delineated cell boundaries. Extracellular highly scattering granular densities consistent with granules are also seen on the SECM image. E, Histology image of basal cell hyperplasia shows a thickened basal layer and elongated papillae. F, The corresponding SECM image demonstrates numerous eosinophils and a thickened highly reflecting layer surrounding the papillae of the lamina propria (compare with the layer surrounding the papillae seen in the normal esophagus in Figure 1C). The thickness of this layer was measured to be 70 μm (white opposing arrows). Scale bars = 100 μm.
Table 2.
Summary of results
| Test characteristic | Value (95% CI) |
|---|---|
| Eosinophil counts | |
| Correlation with histology, R | 0.76* (0.60–0.86) |
| Intraobserver correlation, R | 0.93*† (0.87–0.96), 0.93*‡ (0.88–0.96) |
| Interobserver correlation, R | 0.92* (0.86–0.96) |
| EoE (>15 eos/HPF) | |
| Sensitivity | 1.0 (0.82–1.0) |
| Specificity | 1.0 (0.87–1.0) |
| Intraobserver agreement, κ | 0.95† (0.86–1.0), 0.95‡ (0.86–1.0) |
| Interobserver agreement, κ | 1.0 (1.0–1.0) |
| Eosinophilic abscess | |
| Sensitivity | 1.0 (0.72–1.0) |
| Specificity | 0.82 (0.66–0.91) |
| Intraobserver agreement, κ | 0.9† (0.77–1.0), 0.85‡ (0.69–1.0) |
| Interobserver agreement, κ | 0.9 (0.77–1.0) |
| Eosinophil degranulation | |
| Sensitivity | 0.91 (0.62–0.98) |
| Specificity | 0.6 (0.36–0.80) |
| Intraobserver agreement, κ | 1.0† (1.0–1.0), 0.75‡ (0.49–1.0) |
| Interobserver agreement, κ | 0.84 (0.62–1.0) |
| Basal cell hyperplasia | |
| Sensitivity | 0.94 (0.74–0.99) |
| Specificity | 0.8 (0.61–0.91) |
| Intraobserver agreement, κ | 0.91† (0.78–1.0), 0.81‡ (0.64–0.99) |
| Interobserver agreement, κ | 0.81 (0.64–0.99) |
EoE, Eosinophilic esophagitis; eos/HPF, eosinophils per high-power field.
P < .0001.
Primary results are from reader 1.
Reader 2.
DISCUSSION
The results of this study demonstrate that RCM can be used to characterize the key histopathologic features of EoE in fresh and unaltered human esophageal biopsy specimens, including the capability to visualize and accurately count intraepithelial eosinophils, identify eosinophil abscess and degranulation, and diagnose basal cell hyperplasia, without the addition of exogenous contrast agents. Although this study was conducted ex vivo by using biopsy samples, commercially available CLE devices, currently configured to detect fluorescence light, could in principle be modified to obtain RCM images,28 making it possible to evaluate EoE in vivo. The endoscope-compatible RCM tool could be used to study the evolution and natural history of EoE infiltration and its response to therapy. The findings of this study also motivate the future development of a minimally invasive (ie, transnasal) RCM or SECM probe that could be used in an office procedure without sedation and configured to automatically obtain microscopic images over the length of the entire esophagus.31,32
A key component to the attractiveness of RCM for EoE analysis clinically is that images of individual eosinophils can be obtained with high contrast without administering exogenous contrast agents. We postulate that the physical basis of RCM for identifying eosinophils is primarily related to the large size and refractive index of the granules within the eosinophil's cytoplasm. Modeling of light scattering from cells has revealed that organelles that are large and have a high refractive index gradient exhibit stronger optical backscattering and therefore a stronger RCM signal.41–43 Of the 3 major types of granules present in the cytoplasm of eosinophils, “specific” crystalloid granules, which contain major basic protein, eosinophil peroxidase, eosinophil cationic protein, and eosinophil-derived neurotoxin, are the most abundant.44,45 These crystalloid granules have been reported to measure between 0.5 to 1.3 μm in diameter,44,46 significantly larger than those found in other granulocytes.44,46 Although the refractive index of these granules has not been directly measured, a recent publication suggests that it is quite high, approaching 1.6, because of the density and types of crystalloid proteins contained within.45 Because the refractive index of the cytoplasm ranges from 1.35 to 1.37,47,48 the refractive index gradient induced by these granules is likely very large. In contrast, squamous cells do not have such granules.49,50 As a result, we believe that the eosinophil's cytoplasm will backscatter light more intensely than the surrounding esophageal epithelium, resulting in high RCM image contrast for eosinophils. In addition to granules, nuclei can also generate an RCM signal because of their size and the refractive index of chromatin (1.39–1.45).47,48 Eosinophils may therefore be further discriminated in RCM images by using nuclear morphology cues, such as their bilobed shape.44
The findings that eosinophils are highly backscattering may motivate the investigation of the use of other reflectance-based imaging technologies for EoE diagnosis. For example, it has been reported that backscattering spectroscopy can detect dysplasia in Barrett's esophagus by using spectroscopic information from light scattered by nuclei.51 It could be informative to conduct research to ascertain whether these other backscattering-based imaging modalities are capable of identifying eosinophils and can be used for EoE diagnosis. RCM can also be used to identify other pathologies of esophagus, such as specialized intestinal metaplasia and Barrett's esophagus with dysplasia by applying acetic acid.32 Aceto-whitening, which enhances nuclear contrast, enables the clear visualization of subcellular features of the esophagus and other organs,52,53 indicating that RCM can be used as a diagnostic and monitoring tool for various diseases of the GI tract.
As with all CLE techniques, including RCM, images are inherently transverse, in contrast to conventional cross-sectional histopathology. We developed a method for simultaneously obtaining multiple SECM images at different depths that can be incorporated into a small-diameter probe.54 With this technique, cross-sectional images, such as that shown in Figure 4, can be reconstructed for eosinophil counting that can be referenced to previous histopathologic criteria and thresholds. The imaging depth range of RCM is limited to about 200 μm, which may prevent the visualization of eosinophils deep within the esophageal wall. Nonetheless, we believe that SECM is well suited for EoE diagnosis because it is well documented that the eosinophilic infiltrate typically manifests near the luminal surface.8,10,37,55,56
There are several limitations to this study. First, imaging was not conducted in vivo, but within 15 minutes after tissue excision by biopsy. As such, these results should be considered preliminary until they are reproduced in vivo. Although differences in RCM tissue morphology between living and immediately excised specimens are not well studied, comparable microscopic features of the squamous epithelium have been found in RCM data obtained elsewhere in vivo.28,32 In the analysis for interobserver agreements, 2 SECM readers assessed the same data set. In contrast, once the SECM probe is built and used in vivo, there will be additional variability because of different views and the agreement might be different. Thus, the interobserver correspondence results reported in this study represent the reader-to-reader variability of SECM, not the interobserver agreement for diagnosing EoE in vivo. For the evaluation of the eosinophil degranulation, as conducted by Parfitt et al56 and Chehade et al,40 we used a semiquantitative evaluation method rendered on H&E-stained slides instead of quantitative grading analysis by using major basic protein immunostaining. This could lead to underestimation of eosinophil degranulation because of the reported difficulty of detecting extracellular granules by conventional H&E staining.39,40 Finally, in this study, the imaging speed was limited by the computer-controlled stages that scanned the biopsy samples through the focused beams. Because of this limitation, we were only able to image 1 or 2 samples acquired per patient. Although we analyzed the biopsy data independently, the fact that 2 samples from the same patient have some degree of correlation could affect the results. We are currently developing a transnasal SECM probe that will acquire images more than 2 orders of magnitude faster, which will allow a 10-cm length of esophagus to be imaged in approximately 1 minute. This endoscopic SECM probe will helically scan the entire esophagus in a manner similar to that of previously reported SECM probe and optical frequency domain imaging catheter technology.31,57
Take-home Message
Spectrally encoded confocal microscopy (SECM) accurately identified individual eosinophils ex vivo with a high degree of contrast.
A high correlation between SECM and histology maximum eosinophil counts was found. SECM also accurately identified other histologic features of eosinophilic esophagitis, including basal layer hyperplasia and eosinophil abscess and degranulation.
ACKNOWLEDGMENTS
The authors thank Jie Zhao, William Anim, Haidong You, and Mark Merren for assistance in histopathologic processing. They also thank Mireille Rosenberg, Mari Mino-Kenudson, William Puricelli, and Kevin Gallagher for assistance in conducting this study. They thank Elkan Halpern for helpful discussions on statistics.
This research was supported in part by National Institutes of Health (grant numbers R21CA122161 and R01DK091923).
Abbreviations
- CLE
confocal laser endomicroscopy
- 3D
3-dimensional
- EoE
eosinophilic esophagitis
- H&E
hematoxylin and eosin
- HPF
high-power field
- pCLE
probe-based confocal laser endomicroscopy
- RCM
reflectance confocal microscopy
- SD
standard deviation
- SECM
spectrally encoded confocal microscopy
- TBIR
target-to-background intensity ratio
Footnotes
DISCLOSURE: The following authors disclosed a financial relationship relevant to this publication: Drs Tearney and Bouma consult for and receive nonclinical sponsored research from Ninepoint Medical Inc. Ninepoint Medical Inc. has a technology-licensing agreement with Massachusetts General Hospital. Some authors (G.J.T., B.E.B., H.Y., D.K.) have rights to receive royalties as a result of this licensing arrangement. Dr. Namati works as a consultant for and has equity interest in Ninepoint Medical Inc. The other authors disclosed no financial relationships relevant to this publication.
REFERENCES
- 1.Chehade M, Sampson HA. Epidemiology and etiology of eosinophilc esophagitis. Gastrointest Endosc Clin N Am. 2008;18:33–44. viii. doi: 10.1016/j.giec.2007.09.002. [DOI] [PubMed] [Google Scholar]
- 2.Kapel RC, Miller JK, Torres C, et al. Eosinophilic esophagitis: a prevalent disease in the United States that affects all age groups. Gastroenterology. 2008;134:1316–21. doi: 10.1053/j.gastro.2008.02.016. [DOI] [PubMed] [Google Scholar]
- 3.Veerappan GR, Perry JL, Duncan TJ, et al. Prevalence of eosinophilic esophagitis in an adult population undergoing upper endoscopy: a prospective study. Clin Gastroenterol Hepatol. 2009;7:420–6. 426, e1–2. doi: 10.1016/j.cgh.2008.10.009. [DOI] [PubMed] [Google Scholar]
- 4.Liacouras CA. Eosinophilic esophagitis. Gastroenterol Clin North Am. 2008;37:989–98. xi. doi: 10.1016/j.gtc.2008.09.004. [DOI] [PubMed] [Google Scholar]
- 5.Atkins D, Kramer R, Capocelli K, et al. Eosinophilic esophagitis: the newest esophageal inflammatory disease. Nat Rev Gastroenterol Hepatol. 2009;6:267–78. doi: 10.1038/nrgastro.2009.45. [DOI] [PubMed] [Google Scholar]
- 6.Prasad GA, Talley NJ. Eosinophilic esophagitis in adults. Gastroenterol Clin North Am. 2008;37:349–68. v–vi. doi: 10.1016/j.gtc.2008.03.002. [DOI] [PubMed] [Google Scholar]
- 7.Putnam PE, Rothenberg ME. Eosinophilic esophagitis: concepts, controversies, and evidence. Curr Gastroenterol Rep. 2009;11:220–5. doi: 10.1007/s11894-009-0034-2. [DOI] [PubMed] [Google Scholar]
- 8.Furuta GT, Liacouras CA, Collins MH, et al. Eosinophilic esophagitis in children and adults: a systematic review and consensus recommendations for diagnosis and treatment. Gastroenterology. 2007;133:1342–63. doi: 10.1053/j.gastro.2007.08.017. [DOI] [PubMed] [Google Scholar]
- 9.Gonsalves N, Policarpio-Nicolas M, Zhang Q, et al. Histopathologic variability and endoscopic correlates in adults with eosinophilic esophagitis. Gastrointest Endosc. 2006;64:313–9. doi: 10.1016/j.gie.2006.04.037. [DOI] [PubMed] [Google Scholar]
- 10.Collins MH. Histopathologic features of eosinophilic esophagitis. Gastrointest Endosc Clin N Am. 2008;18:59–71. viii–ix. doi: 10.1016/j.giec.2007.09.014. [DOI] [PubMed] [Google Scholar]
- 11.Remedios M, Campbell C, Jones PM, et al. Eosinophilic esophagitis in adults: clinical, endoscopic, histologic findings, and response to treatment with fluticasone propionate. Gastrointest Endosc. 2006;63:3–12. doi: 10.1016/j.gie.2005.07.049. [DOI] [PubMed] [Google Scholar]
- 12.Teitelbaum JE, Fox VL, Twarog FJ, et al. Eosinophilic esophagitis in children: immunopathological analysis and response to fluticasone propionate. Gastroenterology. 2002;12:1216–25. doi: 10.1053/gast.2002.32998. [DOI] [PubMed] [Google Scholar]
- 13.Aceves SS, Bastian JF, Newbury RO, et al. Oral viscous budesonide: a potential new therapy for eosinophilic esophagitis in children. Am J Gastroenterol. 2007;102:2271–9. doi: 10.1111/j.1572-0241.2007.01379.x. quiz 2280. [DOI] [PubMed] [Google Scholar]
- 14.Aceves SS, Dohil R, Newbury RO, et al. Topical viscous budesonide suspension for treatment of eosinophilic esophagitis. J Allergy Clin Immunol. 2005;116:705–6. doi: 10.1016/j.jaci.2005.05.011. [DOI] [PubMed] [Google Scholar]
- 15.Dohil R, Newbury R, Fox L, et al. Oral viscous budesonide is effective in children with eosinophilic esophagitis in a randomized, placebo-controlled trial. Gastroenterology. 2010;139:418–29. doi: 10.1053/j.gastro.2010.05.001. [DOI] [PubMed] [Google Scholar]
- 16.Liacouras CA, Spergel JM, Ruchelli E, et al. Eosinophilic esophagitis: a 10-year experience in 381 children. Clin Gastroenterol Hepatol. 2005;3:1198–206. doi: 10.1016/s1542-3565(05)00885-2. [DOI] [PubMed] [Google Scholar]
- 17.Markowitz JE, Spergel JM, Ruchelli E, et al. Elemental diet is an effective treatment for eosinophilic esophagitis in children and adolescents. Am J Gastroenterol. 2003;98:777–82. doi: 10.1111/j.1572-0241.2003.07390.x. [DOI] [PubMed] [Google Scholar]
- 18.Gonsalves N. Eosinophilic esophagitis: history, nomenclature, and diagnostic guidelines. Gastrointest Endosc Clin N Am. 2008;18:1–9. vii. doi: 10.1016/j.giec.2007.09.010. [DOI] [PubMed] [Google Scholar]
- 19.Gupta SK. Noninvasive markers of eosinophilic esophagitis. Gastrointest Endosc Clin N Am. 2008;18:157–67. xi. doi: 10.1016/j.giec.2007.09.004. [DOI] [PubMed] [Google Scholar]
- 20.Putnam PE. Eosinophilic esophagitis in children: clinical manifestations. Gastroenterol Clin North Am. 2008;37:369–81. vi. doi: 10.1016/j.gtc.2008.02.009. [DOI] [PubMed] [Google Scholar]
- 21.Aceves SS, Furuta GT, Spechler SJ. Integrated approach to treatment of children and adults with eosinophilic esophagitis. Gastrointest Endosc Clin N Am. 2008;18:195–217. xi. doi: 10.1016/j.giec.2007.09.003. [DOI] [PubMed] [Google Scholar]
- 22.Putnam PE. Eosinophilic esophagitis in children: clinical manifestations. Gastrointest Endosc Clin N Am. 2008;18:11–23. vii. doi: 10.1016/j.giec.2007.09.007. [DOI] [PubMed] [Google Scholar]
- 23.Kiesslich R, Goetz M, Neurath MF. Virtual histology. Best Pract Res Clin Gastroenterol. 2008;22:883–97. doi: 10.1016/j.bpg.2008.05.003. [DOI] [PubMed] [Google Scholar]
- 24.Kiesslich R, Gossner L, Goetz M, et al. In vivo histology of Barrett's esophagus and associated neoplasia by confocal laser endomicroscopy. Clin Gastroenterol Hepatol. 2006;4:979–87. doi: 10.1016/j.cgh.2006.05.010. [DOI] [PubMed] [Google Scholar]
- 25.Nguyen NQ, Leong RW. Current application of confocal endomicroscopy in gastrointestinal disorders. J Gastroenterol Hepatol. 2008;23:1483–91. doi: 10.1111/j.1440-1746.2008.05469.x. [DOI] [PubMed] [Google Scholar]
- 26.Pohl H, Rösch T, Vieth M, et al. Miniprobe confocal laser microscopy for the detection of invisible neoplasia in patients with Barrett's oesophagus. Gut. 2008;57:1648–53. doi: 10.1136/gut.2008.157461. [DOI] [PubMed] [Google Scholar]
- 27.Neumann H, Vieth H, Vieth M, et al. First description of eosinophilic esophagitis using confocal laser endomicroscopy (with video) Endoscopy 2011. 43(Suppl 2):E66. doi: 10.1055/s-0030-1255904. [DOI] [PubMed] [Google Scholar]
- 28.Nakao M, Yoshida S, Tanaka S, et al. Optical biopsy of early gastroesophageal cancer by catheter-based reflectance-type laser-scanning confocal microscopy. J Biomed Opt. 2008;13:054043. doi: 10.1117/1.2983674. [DOI] [PubMed] [Google Scholar]
- 29.Yoshida S, Tanaka S, Hirata M, et al. Optical biopsy of GI lesions by reflectance-type laser-scanning confocal microscopy. Gastrointest Endosc. 2007;66:144–9. doi: 10.1016/j.gie.2006.10.054. [DOI] [PubMed] [Google Scholar]
- 30.Tearney GJ, Webb RH, Bouma BE. Spectrally encoded confocal microscopy. Opt Lett. 1998;23:1152–4. doi: 10.1364/ol.23.001152. [DOI] [PubMed] [Google Scholar]
- 31.Yelin D, Boudoux C, Bouma BE, et al. Large area confocal microscopy. Opt Lett. 2007;32:1102–4. doi: 10.1364/ol.32.001102. [DOI] [PubMed] [Google Scholar]
- 32.Kang D, Suter MJ, Boudoux C, et al. Comprehensive imaging of gastroesophageal biopsy samples by spectrally encoded confocal microscopy. Gastrointest Endosc. 2010;71:35–43. doi: 10.1016/j.gie.2009.08.026. [DOI] [PMC free article] [PubMed] [Google Scholar]
- 33.Boudoux C, Yun S, Oh W, et al. Rapid wavelength-swept spectrally encoded confocal microscopy. Opt Express. 2005;13:8214–21. doi: 10.1364/opex.13.008214. [DOI] [PubMed] [Google Scholar]
- 34.Yelin D, Bouma BE, Yun SH, et al. Double-clad fiber for endoscopy. Opt Lett. 2004;29:2408–10. doi: 10.1364/ol.29.002408. [DOI] [PubMed] [Google Scholar]
- 35.Thevenaz P, Ruttimann UE, Unser M. A pyramid approach to subpixel registration based on intensity. IEEE Trans Image Process. 1998;7:27–41. doi: 10.1109/83.650848. [DOI] [PubMed] [Google Scholar]
- 36.Rasband WS. ImageJ. U.S. National Institutes of Health; Bethesda, Maryland: 1997–2010. [Accessed Nov 2010]. Available at: http://rsb.info.nih.gov/ij/ [Google Scholar]
- 37.Odze RD. Pathology of eosinophilic esophagitis: what the clinician needs to know. Am J Gastroenterol. 2009;104:485–90. doi: 10.1038/ajg.2008.40. [DOI] [PubMed] [Google Scholar]
- 38.Dellon ES, Gibbs WB, Fritchie KJ, et al. Clinical, endoscopic, and histologic findings distinguish eosinophilic esophagitis from gastroesophageal reflux disease. Clin Gastroenterol Hepatol. 2009;7:1305–13. doi: 10.1016/j.cgh.2009.08.030. quiz 1261. [DOI] [PMC free article] [PubMed] [Google Scholar]
- 39.Mueller S, Aigner T, Neureiter D, et al. Eosinophil infiltration and degranulation in oesophageal mucosa from adult patients with eosinophilic oesophagitis: a retrospective and comparative study on pathological biopsy. J Clin Pathol. 2006;59:1175–80. doi: 10.1136/jcp.2005.031922. [DOI] [PMC free article] [PubMed] [Google Scholar]
- 40.Chehade M, Sampson MA, Morotti RA, et al. Esophageal subepithelial fibrosis in children with eosinophilic esophagitis. J Pediatr Gastroenterol Nutr. 2007;45:319–28. doi: 10.1097/MPG.0b013e31806ab384. [DOI] [PubMed] [Google Scholar]
- 41.Arifler D, Pavlova I, Gillenwater A, et al. Light scattering from normal and dysplastic cervical cells at different epithelial depths: finite-difference time-domain modeling with a perfectly matched layer boundary condition. J Biomed Opt. 2003;8:484–94. doi: 10.1117/1.1578640. [DOI] [PubMed] [Google Scholar]
- 42.Drezek R, Dunn A, Richards-Kortum R. A pulsed finite-difference time-domain (FDTD) method for calculating light scattering from biological cells over broad wavelength ranges. Opt Express. 2000;6:147–57. doi: 10.1364/oe.6.000147. [DOI] [PubMed] [Google Scholar]
- 43.Drezek R, Guillard M, Collier T, et al. Light scattering from cervical cells throughout neoplastic progression: influence of nuclear morphology, DNA content, and chromatin texture. J Biomed Opt. 2003;8:7–16. doi: 10.1117/1.1528950. [DOI] [PubMed] [Google Scholar]
- 44.Lacy P, Becker A, Moqbel R, editors. The human eosinophil. Lippincott Williams & Wilkins; Baltimore (Md): 2003. Wintrobe's clinical hematology. 2003. [Google Scholar]
- 45.Yurkin MA, Semyanov KA, Maltsev VP, et al. Discrimination of granulocyte subtypes from light scattering: theoretical analysis using a granulated sphere model. Opt Express. 2007;15:16561–80. doi: 10.1364/oe.15.016561. [DOI] [PubMed] [Google Scholar]
- 46.Puppels GJ, Kemperman PM, Sandilands A, et al. Raman microspectroscopic approach to the study of human granulocytes. Biophys J. 1991;60:1046–56. doi: 10.1016/S0006-3495(91)82142-7. [DOI] [PMC free article] [PubMed] [Google Scholar]
- 47.Brunsting A, Mullaney PF. Differential light scattering from spherical mammalian cells. Biophys J. 1974;15:439–53. doi: 10.1016/S0006-3495(74)85925-4. [DOI] [PMC free article] [PubMed] [Google Scholar]
- 48.Drezek R, Zuluaga A, Richards-Kortum R, editors. Relationship between microscopic structure and scattering properties. implications for OCT imaging. Marcel Dekker; New York (NY): 2002. Handbook of optical coherence tomography. [Google Scholar]
- 49.Snell R. An electron microscopic study of the human epidermal keratinocyte. Z Zellforsch Mikrosk Anat. 1967;79:492–506. doi: 10.1007/BF00336309. [DOI] [PubMed] [Google Scholar]
- 50.Tearney GJ, Brezinski ME, Southern JF, et al. Determination of the refractive index of highly scattering human tissue by optical coherence tomography. Opt Lett. 1995;20:2258. doi: 10.1364/ol.20.002258. [DOI] [PubMed] [Google Scholar]
- 51.Qiu L, Pleskow DK, Chuttani R, et al. Multispectral scanning during endoscopy guides biopsy of dysplasia in Barrett's esophagus. Nat Med. 2010;16:603–6. doi: 10.1038/nm.2138. 1p following 606. [DOI] [PMC free article] [PubMed] [Google Scholar]
- 52.Hoffman A, Kiesslich R, Bender A, et al. Acetic acid-guided biopsies after magnifying endoscopy compared with random biopsies in the detection of Barrett's esophagus: a prospective randomized trial with crossover design. Gastrointest Endosc. 2006;64:1–8. doi: 10.1016/j.gie.2005.09.031. [DOI] [PubMed] [Google Scholar]
- 53.Sankaranarayanan R, Wesley R, Somanathan T, et al. Visual inspection of the uterine cervix after the application of acetic acid in the detection of cervical carcinoma and its precursors. Cancer. 1998;83:2150–6. [PubMed] [Google Scholar]
- 54.Kang D, Yoo H, Jillella P, et al. Comprehensive volumetric confocal microscopy with adaptive focusing. Biomed Opt Express. 2011;2:1412–22. doi: 10.1364/BOE.2.001412. [DOI] [PMC free article] [PubMed] [Google Scholar]
- 55.Lim JR, Gupta SK, Croffie JM, et al. White specks in the esophageal mucosa: an endoscopic manifestation of non-reflux eosinophilic esophagitis in children. Gastrointest Endosc. 2004;59:835–8. doi: 10.1016/s0016-5107(04)00364-5. [DOI] [PubMed] [Google Scholar]
- 56.Parfitt JR, Gregor JC, Suskin NG, et al. Eosinophilic esophagitis in adults: distinguishing features from gastroesophageal reflux disease: a study of 41 patients. Mod Pathol. 2006;19:90–6. doi: 10.1038/modpathol.3800498. [DOI] [PubMed] [Google Scholar]
- 57.Suter MJ, Vakoc BJ, Yachimski PS, et al. Comprehensive microscopy of the esophagus in human patients with optical frequency domain imaging. Gastrointest Endosc. 2008;68:745–53. doi: 10.1016/j.gie.2008.05.014. [DOI] [PMC free article] [PubMed] [Google Scholar]