

Abstract
The functions of prefrontal cortex remain enigmatic, especially for its anterior sectors, putatively ranging from planning to self-initiated behavior, social cognition, task switching, and memory. A predominant current theory regarding the most anterior sector, the frontopolar cortex (FPC), is that it is involved in exploring alternative courses of action, but the detailed causal mechanisms remain unknown. Here we investigated this issue using the lesion method, together with a novel model-based analysis. Eight patients with anterior prefrontal brain lesions including the FPC performed a four-armed bandit task known from neuroimaging studies to activate the FPC. Model-based analyses of learning demonstrated a selective deficit in the ability to extrapolate the most recent trend, despite an intact general ability to learn from past rewards. Whereas both brain-damaged and healthy controls used comparisons between the two most recent choice outcomes to infer trends that influenced their decision about the next choice, the group with anterior prefrontal lesions showed a complete absence of this component and instead based their choice entirely on the cumulative reward history. Given that the FPC is thought to be the most evolutionarily recent expansion of primate prefrontal cortex, we suggest that its function may reflect uniquely human adaptations to select and update models of reward contingency in dynamic environments.
Introduction
Recent work has linked models of reward-based decision making to anatomical substrates within the prefrontal cortex (PFC). Relatively well established are the roles of ventromedial and orbital PFC in encoding reward value and dorsolateral PFC in linking rewards to cognitive control (Miller and Cohen, 2001), supported by functional imaging (O'Doherty et al., 2003; Wunderlich et al., 2009) and lesion data in humans (Bechara et al., 2000; Fellows and Farah, 2005; Camille et al., 2011) and nonhuman primates (Noonan et al., 2010; Walton et al., 2010). The frontopolar cortex (FPC; encompassing Brodmann's area 10) has remained more enigmatic, with contributions to planning, self-directed behavior, social cognition, task-switching, memory, attentional control (Ramnani and Owen, 2004; Koechlin and Hyafil, 2007; Pollmann et al., 2007), and operant learning under changing contingencies (Strange et al., 2001). Model-based neuroimaging has implicated the FPC in the exploration of unfamiliar options (Daw et al., 2006) and in tracking the value of foregone options (Boorman et al., 2009). Though extremely informative, neuroimaging addresses the contributions of the brain to behavior indirectly. A direct demonstration requires evidence from the focal disruption of normal brain function; thus, lesion data give a vital complement to functional imaging. In humans, damage to the anterior prefrontal cortex has been linked to impairments of planning and decision making, pronounced in environments that demand the strategic allocation of attention to multiple concurrent tasks (Koechlin et al., 1999; Burgess, 2000; Dreher et al., 2008), yet it is not clear whether or how such effects might relate to mechanisms of reward-based learning and decision making.
To address this open question, we examined the behavior of patients with damage to the anterior prefrontal cortex on a task shown in a previous fMRI study to engage FPC. Participants chose repeatedly among slot machines (bandits) with slowly varying payoffs (Daw et al., 2006). In contrast to distinctly reward-related responses in ventromedial PFC, Daw et al. (2006) observed the activation of FPC when behavior deviated from choices predicted by a simple reinforcement learning (RL) model. Such deviations marked exploratory switching between bandits, when subjects forewent the RL-predicted optimum to examine other options. This finding implicates FPC in exploratory switching but leaves critical open questions, notably, how is exploratory switching in this context to be understood computationally? Does it require activity in FPC? We applied model-based analyses to the behavior of eight patients with lesions encompassing FPC who were otherwise high functioning (group FP). We compared their behavior with that of patients with lesions sparing FPC and with comparison subjects who were neurologically intact. In these two comparison groups and in the behavioral data from participants in the earlier fMRI study, our analyses revealed a previously overlooked source for deviations from an RL model: a tendency to extrapolate short-term trends in payoffs from a given bandit into the future. Yet patients with damage to the FPC lacked this tendency. Thus, rather than a general disruption of exploratory switching, our results support the interpretation that impaired exploratory behavior may be linked to a specific abnormality in extrapolating from short-term trends.
Materials and Methods
Participants
Participants were recruited from the Patient Registry of the Division of Cognitive Neuroscience at the University of Iowa [frontopolar (FP) and brain-damaged comparison (BDC) patients] or the local community [normal comparison (NC) subjects] group (Table 1). Patients with lesions that included part or all of the FPC were assigned to the FP group (n = 8; six men, two women). In both lesion groups, only right-handed subjects were included. In most cases, lesions in FP subjects were bilateral, though their distribution was predominantly right sided (see Fig. 2). BDC subjects included any patients whose lesions did not encroach on FPC (n = 8; three men, five women). In seven BDC patients, lesions affected the left- or right-sided temporal lobe (n = 3, n = 4, respectively); in two, lesions included portions of the prefrontal cortex, extending to the right (n = 1) and left (n = 1) frontal operculum. Lesion etiologies for the two lesion groups included surgical resection for the treatment of tumors (4 and 1, respectively, for FP and BDC groups), surgical resection for the treatment of epilepsy (0 and 3), aneurysm (2 and 0), ischemic stroke (0 and 2), vascular malformation (1 and 1), and abscess (1 and 0). Lesions in the FP group were predominantly bilateral (n = 7) with one unilateral right lesion, whereas lesions in the BDC group were all unilateral. Groups also differed with respect to lesion volume, with the FP group having a larger average volume than the BDC group [mean (SD) 72.6 (36.6) cm3 and 23.3 (8.6) cm3, respectively; p < 0.001, Wilcoxon rank-sum test]. All patients were tested during the chronic phase of recovery, at least 6 months after the lesion was first noted. Full-scale IQ (FS-IQ) scores did not differ significantly between the NC and lesion groups (Kruskal–Wallis test, p = 0.1614), nor did age (Kruskal–Wallis test, p = 0.3432).
Table 1.
Participant data
| Group | Gender | Age (years) | Ed | VIQ | PIQ | FS-IQ |
|---|---|---|---|---|---|---|
| FPC | 6 M/2 F | 52 (15) | 14 (3.4) | 114 (20) | 105 (19) | 111 (19) |
| BDC | 3 M/5 F | 45 (18) | 14 (2) | 100 (8) | 106 (8) | 103 (7) |
| NC | 4 M/10 F | 53 (10) | 16 (1.8) | 110 (10) | 108 (8) | 110 (8) |
Values age given as mean (SD). All participants were fully right handed. M, Male; F, female; VIQ, verbal IQ; PIQ, performance IQ. IQ data were obtained from the WAIS-III (FP, BDC) or estimated from the NART, WRAT-R or abbreviated WAIS-III (NC). Ed, Years of education.
Figure 2.
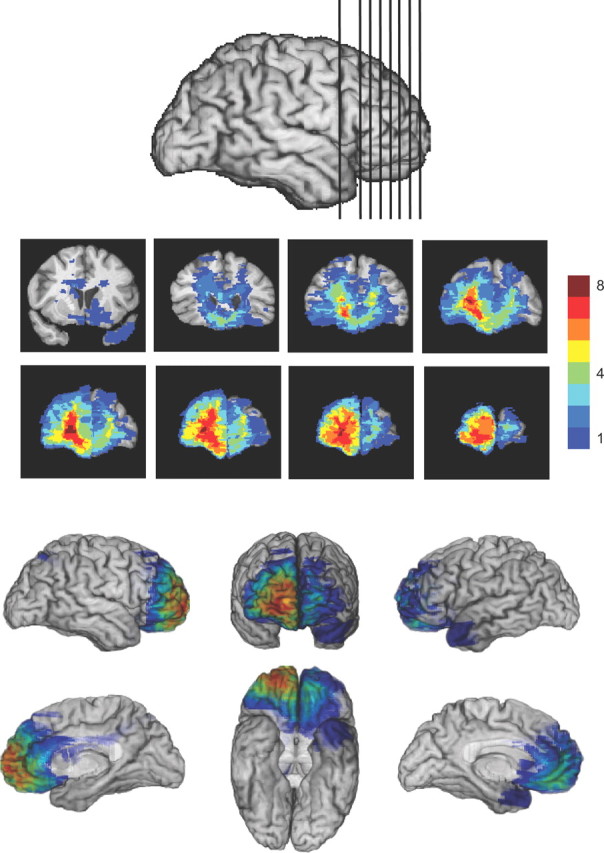
Lesion overlap in the FP group. Lesions were predominantly right sided and included cortex and white matter outside the FPC; all but one patient had bilateral involvement.
Healthy comparison subjects (n = 14; four men, 10 women) were recruited from the community. FS-IQ scores for NC subjects [estimated from the abbreviated Wechsler Adult Intelligence Test III (WAIS-III) for 5 subjects and otherwise the National Adult Reading Test or reading subtest of the Wide Ranging Achievement Test Revised (WRAT-R)] did not differ significantly from those for lesion groups (from the full Wechsler Adult Intelligence Scale) [mean (SD): 110.0 (7.0), 103.1 (7.0), and 110.8 (19.1) for NC, FP, and BDC, respectively; Kruskal–Wallis test, p = 0.14]. The groups did not differ significantly in age [mean (SD) 53.2 (10.4), 44.8 (18.2), 52.4 (15.3) years; Kruskal–Wallis test, p = 0.32].
Five additional lesion patients were tested and excluded from further analysis. One subject was excluded because of visual impairment, which made her unable to complete the task. One patient had difficulty remaining awake during the task, which resulted in a high proportion (12.7%) of missed response windows. The third subject was excluded because the involvement of FPC could not be determined with certainty from available CT images. Two patients were excluded because they were not right handed.
Task
We used a simple economic decision task known as a four-armed bandit task, which required subjects to choose from among four slot machines (bandits) whose payoffs varied independently of each other over time according to a constrained Gaussian random walk. Subjects were free to select any of the bandits at each trial, with the value of the choice outcome revealed for only the single chosen bandit. Subjects were asked to perform the task to win as many points as possible. After receiving instruction, they were allowed a practice run that continued until they felt they understood the task. All procedures were approved by the Biomedical Institutional Review Board of the University of Iowa.
Task parameters were identical to those described by Daw et al. (2006) except that the response period was extended to 3 s. Stimuli were presented on a 21 inch CRT monitor at a distance of 107 cm. On each trial, subjects were presented with four differently colored bandits at each of the screen quadrants. On selection, each bandit returned a positive reward whose value ranged between 0 and 100. Payoff varied according to a slowly drifting pseudorandom walk, fixed across subjects, with added Gaussian noise, different across subjects, of constant SD (Fig. 2, inset). Subjects were instructed to select the bandit they expected would yield the greatest reward. The experimental session began with instructions and a practice session until the participant understood the task. Bandits retained the same color and position throughout the experiment. Subjects completed two blocks of 150 trials each; however, because of a technical error, data were obtained from only the first block in two of the eight subjects in the FP group. The reported findings were robust to exclusion of the second block across all subjects and, hence, could not be attributed to this omission.
Choice models
Subjects' choices were assumed to depend on the history of payoffs returned by each bandit and the history of chosen bandits. The goal of our analysis was to reveal the properties of the stochastic function, which relates choice outcome history to selection probability using sets of assumptions that are neither overly restrictive nor underconstrained given the data. To first characterize this relationship descriptively while making only relatively weak assumptions about its form, we initially fit a generalized linear model to examine the overall pattern of statistical dependencies between payoffs and choice (Lau and Glimcher, 2005), and used this to motivate and verify the basic form of a more structurally constrained “model-based” approach that assumes a particular parameterized valuation algorithm. In particular, for the latter we assumed that subjects' responses obeyed a standard RL process but augmented this with an additional component compared with previous models.
Conditional logit model
For descriptive modeling, we applied conditional logit regression to characterize subjects' choices in terms of the rewards received previously. This procedure generalizes logistic regression to multinomial dependent variables (here, choice of one of four bandits) by modeling the conditional log odds ratio of events as linear in the inputs (McFadden, 1974).
The regression has the form
 |
where at is the choice at time t, w is a vector of regression weights, common between all bandits i ∈ [1,2,3,4], and xi,t is a vector of bandit-specific explanatory variables for bandit i at time t. This consists of the payoffs received for the most recent five choices of that bandit and an indicator variable that takes the value 1 if i was the most recently selected bandit and 0 if it was otherwise.
Reinforcement learning model for valuation
RL models, which include temporal difference (TD) learning, are widely applied in characterizing the value computations underlying reward learning (Sutton, 1988). Here, we used the form of the model from Schönberg et al. (2007), which is a slightly simplified form of the Kalman filter model used by Daw et al. (2006).
The algorithm learns a value Vt(i) for each bandit i, which is updated whenever i is chosen by Vt+1(i) = Vt(i) + αδt. Here, the prediction error δt = rt − Vt(i) is the difference between the predicted reward Vt,i and the obtained reward rt. If bandit i is not chosen on trial t, then Vt+1(i) = Vt(i).
By iteratively substituting the update rule within itself, it is easy to verify that this procedure estimates Vt(i) as an exponentially weighted average over rewards received for previous choices of the bandit, specifically as ∑kα(1 − α)k−1rk, where rk is the reward received for the kth most recent choice of the bandit. Thus, the RL model constrains weights to follow an exponential decay as a function of selection lag (Lau and Glimcher, 2005). The adequacy of fit of the RL model can be evaluated by comparing these weights with weights directly fit in the conditional logit model, which are not similarly constrained.
Recent selection term.
To model any autocorrelation in the choices not explained by the rewards, we included a dependence on recency of selection. The corresponding term increments each time a given option is chosen and otherwise decays geometrically:
 |
This term models the tendency to either persevere or switch in the selection of recently selected bandits, regardless of payoff.
Lag difference term.
To account for negative weighting on the penultimate payoff observed in NC subjects (see Fig. 3), we augmented the model that included RL and recent selection terms with a term that models the effect of recent trend in the payoffs on the preference for any bandit. Short-term trend is incorporated in the model as the difference between the two most recent payoffs [lag difference (LD)] that is, Dt(i) = rk − rk+1, where rk and rk+1 denote the last two rewards received on bandit i. Note that in terms of the unconstrained conditional logit model of Equation 1, this term assigns regression weights of 1 and −1, on the lag-1 and lag-2 rewards, respectively; the weighted sum of this term in combination with the TD value learning component (Eq. 3, below) predicts that the regression weights on the reward history should decay exponentially, except with extra positive (or negative) weight on the most recent reward, and an equal amount of extra negative (or positive) weight on the second most recent reward. When the lag difference term is sufficiently large, relative to the RL term, weighting on the penultimate term may become negative.
Figure 3.

Conditional logit (CL) model. Weights in the CL model show the influence of past reward on selection probability, where the choice value of each bandit is given by a weighted sum over recent payoffs from the bandit. Significance levels under the Wilcoxon rank-sum test (H0, zero median) or Kruskal–Wallis tests (H0, equal medians) are indicated (*p < 0.01, otherwise as shown for p < 0.05). Significant group effects are shown (horizontal bar).
Choice probability.
We used a softmax model to relate the value, recent selection, and lag-difference terms to the choices:
 |
Here, the inverse temperature parameters βV, βC, and βD weight the contribution of the three terms to the choices and determine the degree of stochasticity in the choices.
Conditional on learning rate, α, this equation can also be viewed as a case of the conditional logit model of Equation 1, in which the value, recent selection, and lag difference terms are explanatory variables and their temperature parameters play the role of the weights w. Moreover, because the value and lag difference terms are themselves just linear combinations of past rewards, these combinations scaled by βV and βD imply equivalent weightings for the explanatory variables (lagged rewards) in the conditional logit model (see Fig. 4).
Figure 4.

Separate additive contributions of RL and LD terms to weighing of payoffs as a function of selection lag for each group. Points represent individual fits, and lines indicate median weighting across individuals. Top, RL weighting. Middle, LD weighting. Bottom, Sum RL+LD weighting. Note the absence of a contribution of the LD term in group FP. Results do not change with the exclusion of the outlier in group FP.
Model fitting
For both models, maximum likelihood estimates of model parameters were obtained for each subject using a nonlinear function optimization algorithm implemented in the MatLab (MathWorks) optimization toolbox. The quantity optimized was the log likelihood over all the choices (the logs of the probabilities given by Equation 1 or for the subject's choice summed over all trials t). We worked out, for each subject, the reward history weights, equivalent to the regression weights for the conditional logit model of Equation 1, that are implied by the best-fitting parameters for the components of the RL model.
We also fit the RL model under the restriction βD = 0, which is equivalent to a standard RL model without the lag difference term. We used likelihood ratio tests to assess statistically whether any improvement in model fit due to the inclusion (vs exclusion) of the lag difference term was expected due to chance and overfitting, taking into account the additional free parameters (one βd per subject) included in the full model. Specifically, under the null hypothesis of βD = 0, twice the difference of best-fit log likelihoods between the nested RL and RL+LD models asymptotically follows a χ2 distribution with 1 df per parameter, providing a statistical test (likelihood ratio test) of the contribution of the LD term (McCullagh and Nelder, 1999). To test the full RL model against the version lacking the lag difference component within each group, we used this likelihood ratio test on the likelihoods for the choices under either model, aggregated over all members of the group, with degrees of freedom equal to the number of members in the group. This treats the identity of the best-fitting model (but not the underlying parameters) as a fixed effect within the group (Daw, 2011)
To avoid local optima in fitting the nonlinear RL models, the search was repeated for 500 randomly chosen starting points. We constrained the learning rate parameter α to lie between 0 and 2 (because 1 < α < 2, though senseless as a learning rate parameter, may allow the RL model without the lag difference component to reproduce the effect of a negative weighting on the penultimate reward), and the decay parameter k to lie between −1 and 1. The parameter fits nevertheless did not fall outside the expected range of (0, 1) in any instance.
To evaluate the significance of between-group differences in light of across-subject (within group) variation in the estimated parameters, nonparametric tests—the Kruskal–Wallis test, rank-sum, and sign-rank tests—were applied to the parameter estimates across subjects. This treats the individual parameters as random effects instantiated once per subject and tests group level variation in these effects using a nonparametric variant of the summary statistics procedure (Holmes and Friston, 1998). Table 2 provides a summary of the estimated parameters for the RL+LD model. RL+LD fits are shown (see Fig. 4).
Table 2.
Parameters for the RL+LD model
| Parameter | Description | FPC | BDC | NC |
|---|---|---|---|---|
| βV | RL inverse temperature | 0.33 (0.36) | 0.53 (0.38) | 0.45 (0.39) |
| α | RL learning rate | 0.52 (0.46) | 0.35 (0.48) | 0.43 (0.45) |
| βC | Recency inverse temperature | 0.75 (1.1) | 0.66 (0.89) | 0.63 (1.31) |
| κ | Recency decay | 0.40 (0.34) | 0.14 (0.55) | 0.42 (0.39) |
| βD | Lag difference | −0.008 (0.015) | 0.034 (0.026) | 0.026 (0.023) |
Mean (SD) is shown for parameter values within each participant group.
Analysis of reward trends on stay and switch trials.
Mean difference between the lag-1 and lag-2 trials was computed for the previously selected bandit (chosen on the lag-1 trial) separately for trials in which the same bandit was reselected (stay trials) and trials in which a new bandit was chosen (switch trials). For switch trials, the mean trend was also computed for the selected bandit. To examine the association between response type (stay vs switch) and mean trend and the interaction with groups, we applied repeated-measures ANOVA to the means computed for each subject, taking trial type and group as factors. Degrees of freedom for the ANOVA were adjusted for deviations from the assumption of sphericity using the Greenhouse–Geisser correction. Parametric tests were used in this case because equivalent nonparametric repeated measures methods were not available.
MANCOVA and ANCOVA.
BDC and FP groups were not matched with respect to lesion volume or lateralization, which leaves these as possible confounding factors. A difference of lesion volume, in particular, may raise the concern of uncontrolled-for effects. To address this concern, we applied two multivariate ANCOVAs that separately included lesion volume and lateralization index, in addition to subject group, as continuous explanatory variables. Lateralization index was computed as the absolute value of the ratio of the difference between volumes in the right and left hemispheres over total volume, and lesion volume was computed as a percentage of total brain volume in the template space. These models assume that individual parameter estimates are drawn from a multivariate Gaussian distribution, whose mean is a linear function of a group indicator variable and other continuous regressors. Both univariate ANCOVAs, focusing on the effect in the LD parameter, and multivariate ANCOVAs (MANCOVAs) were performed to evaluate any possible contributions of volume and lateralization to the observed effects.
Simulation
To establish baselines against which to compare participant performance, we simulated 10,000 runs from a maximally efficient theoretical observer who would weight past outcomes optimally given the class of RL learning models used here and 10,000 runs from a theoretical observer who chose randomly. The efficient observer behaved according to a reinforcement learning model whose learning rate and inverse temperature parameters were chosen by using separate simulations to maximize expected returns given the drift and noise variance of the generating model. The random observer chose randomly from all four bandits with equal probability and independently of all past rewards and choices. Over the 10,000 runs, the random observer average per trial earning fell within a 95% CI of 45.9–49.0. For the efficient observer, using optimized parameters (β = 0.25, α = 0.41), the 95% CI for average payoff was 58.3–62.5.
Results
Task and overall performance
Participants performed a four-armed bandit task, which required them to choose repeatedly from one of four slot machines to win money (Fig. 1). A key feature of the task is that the payoff contingencies associated with each of the slot machines varied randomly, independently, and slowly over time, normally motivating players to monitor and compare past outcomes to determine which option would be best at present.
Figure 1.

Experimental task. Participants chose from among four differently colored bandits, which yielded a positive reward between 0 and 100. Payoff varied according to a slowly drifting pseudorandom walk, fixed across subjects (inset, solid line), with added Gaussian noise, different across subjects, of constant SD (inset, shaded region).
We tested eight participants selected from the patient registry of the University of Iowa Division of Behavioral Neurology and Cognitive Neuroscience, whose brain lesions compromised the FPC (FP group) (Fig. 2). Although patients were selected for FPC damage, in every case lesions also extended into other sectors of the anterior and medial prefrontal cortex. The FP group performed at an overall level comparable to that of BDC and healthy NC subjects. Groups did not differ in the proportion of trials in which responses switched from one bandit to another for NC, BDC, and FP, respectively (0.39, 0.41, and 0.38; Kruskal–Wallis test, p = 0.58), in mean reward earned per trial (57.1, 58.6, and 57.7 points; p = 0.49), or in median reaction time (642, 486, and 587 ms; F(2,29) = 1.36, p = 0.27; Kruskal–Wallis test, p = 0.09). All groups performed substantially better than chance (95% CI for the random observer in simulations: 45.9–49.0) on average, though two participants performed in the chance range, one in group NC (average reward, 47.7) and one in group BDC (average reward, 48.4). Average performance for all groups approached the lower margin of a simulated observer using an RL model with parameters optimized to maximize earnings, for which average payoff ranged from 58.3 to 62.5.
Choice analysis
To understand how participants learned from rewards, we studied the trial-by-trial dependence of choices on recent rewards. To verify first the general form of this dependence, while making relatively weak assumptions about it, we used a conditional logit regression to predict choices by arbitrarily weighted sums of recent rewards (Lau and Glimcher, 2005). We compared the weights on lagged rewards obtained from this regression analysis with those predicted by a standard RL model. RL models estimate the value of an option as an exponentially weighted average of past rewards and so predict that past reward on an option should encourage choosing it again, with an effect that declines monotonically over trials and is everywhere positive. The Kalman filter model, which was used to characterize choices and BOLD activity in the previous fMRI study (Daw et al., 2006) and from which the RL model follows in a limiting case, makes an analogous prediction.
However, choices in the present dataset were qualitatively contrary to this standard modeling assumption. Instead, for the NC group, the second most recent (lag-2) reward on an option actually discouraged choosing it (negative coefficient; sign-rank test, p = 0.025 uncorrected) (Fig. 3). A negative lag-2 weight can be explained if participants assumed that short-term trends in the payoffs predict future rewards because trend inferred from the difference between the two most recent rewards contributes a negative term to the total lag-2 weight. In general, sensitivity to short-term trend should create a positive deviation from the RL model prediction in the lag-1 weight and a negative deviation in the lag-2 weight, which may still remain positive.
We therefore considered whether subjects allowed the reward trend to influence their choices. Accordingly, we characterized their behavior using a two-component model composed of the sum of a standard RL model that averages past rewards (but cannot track trends) with a trend-extrapolating component (lag difference) (Fig. 4). For the reward-averaging component, we used the RL model, which captures the essential structure of this sort of learning with fewer free parameters than the Kalman filter. The lag difference component models the effect of the short-term trend in the payoffs on the preference for any slot machine, given by the difference between the last two payoffs for that slot machine (driving an option's net value up or down for an increasing or a decreasing payoff). For the groups without FPC damage, the two-component model provided a better description of choices than the standard RL model alone. The likelihood ratio test evaluates whether the improvement in fit was expected under chance due to the additional free parameters (NC group: p < 0.001, df = 14; BDC group: p < 0.001, df = 8), whereas the null hypothesis was not rejected for the FP group (p = 0.12, df = 8).
Having characterized subjects' choices with this two-component model, we used the best-fitting estimates of the model's free parameters to examine differences between groups in the contributions of these components to behavior. The model's two additive reward-driven effects are governed by three parameters: a learning rate parameter (for the RL component) and two “inverse temperature” parameters, which represent the strengths of the RL-learned values and the short-term trend (from the lag difference component) in driving choices. To capture residual autocorrelation in the choices (Lau and Glimcher, 2005), an additional term with two further free parameters modeled the tendency to persist or switch in the selection of recently chosen bandits (recency effect) as an exponentially decaying weight on the indicator for recent selections. FP subjects were normal with respect to all components of the model except trend extrapolation. Specifically, there were no group differences for either the RL inverse temperature or the learning parameters (F(2,27) = 0.284, p = 0.755 and F(2,27) = 0.577, p = 0.568; Kruskal–Wallis test, p = 0.55 and p = 0.56, respectively) or in the two parameters modeling the recency effect (Table 2). This is a notable negative result because the RL inverse temperature parameter controls the degree of random “exploration” in choices and might thus have been hypothesized on the basis of the fMRI study to have been higher (less exploratory) in the FP group. (Conversely, if behavior were nonspecifically impaired and thus more random in either patient group, this inverse temperature would be expected to be reduced.) Differences were instead observed in the lag difference parameter, which was positive in the NC and BDC groups (t = 4.43, p < 0.004 and t = 4.39, p < 0.005; Wilcoxon rank-sum, p = 0.0023 and p = 0.016, respectively, Bonferroni corrected) but nonsignificant in the FP group (t = −1.01, p = 0.16; rank-sum, p = 0.31). Importantly, the group effect for the lag difference was significant (F(2,27) = 8.6, p = 0.005, Bonferroni corrected; Kruskal–Wallis test, p = 0.009, corrected) with significant post hoc differences between FP and NC and between FP and BDC (t = −3.47, p = 0.005 and t = −3.8201, p = 0.002; Kruskal–Wallis test, p < 0.01, respectively, corrected with Tukey's HSD) but not between NC and BDC (p = 0.412, uncorrected). Thus, FP subjects showed a selective absence of a single component of choice behavior: trend extrapolation.
Reward trends on stay and switch trials
Next, we looked at the patterns of raw stay and switch behavior to seek evidence for group differences in choice patterns consistent with the model fits. To better understand the dependence on trend vis-à-vis the decision to continue selecting the same bandit or to switch, we adopted a simpler, relatively unrestrictive analysis of average change in reward (Δreward). Average change was computed for the bandits chosen at lag-1 and lag-2 on trials in which the previous choice was repeated (stay trials) and on switch trials in which a new bandit was selected (Fig. 5). This analysis by itself cannot demonstrate trend following because RL valuation is correlated with trend even in the absence of any contribution from the LD term, but it may provide insight into differences of behavior during stay and switch trials. Repeated-measures ANOVA revealed a significant effect of trial type (switch vs stay) (F(1.56,42.8) = 35.0, p < 0.001) and an interaction between trial type and group (F(3.17,42.83) = 2.8, p = 0.046). Mean Δreward for the previously selected bandit on switch trials was negative (mean = −1.9, SD = 1.2; F(1,27) = 59.8, p < 0.001) with a nonsignificant interaction with group (F(2,27) = 1.5, p = 0.24). For stay trials, mean difference was positive (mean = 0.92, SD = 0.87; F(1,27) = 30.6, p < 0.001) with a significant interaction with group (F(2,27) = 3.13; p = 0.02). For the chosen bandit, no significant difference was observed in the intercept of mean Δreward (F(1,27) = 0.08; p = 0.775), although there was a marginal interaction with group (F(2,27) = 2.95; p = 0.07). During stay trials, group FP had lower mean Δreward for the lag-1-selected bandit than did comparison groups (NC: t = −2.46, p = 0.02, uncorrected; BDC: t = −1.70, p = 0.10, uncorrected) and a marginally less negative mean difference for the switch trials (NC: t = 1.65, p = 0.112; BDC: t = 1.40, p = 0.173). These results and trends are consistent with the suggestion from the model fits that group FP showed a differential sensitivity to trend from the control groups, resulting in a different pattern of switching.
Figure 5.

Mean change in reward (difference between the lag-1 and lag-2 payoffs, Δreward) for stay and switch trials. Mean change is shown for trials in which the same choice was repeated (stay trials) and in which a new bandit was chosen (switch trials). For switch trials, Δreward is shown both for the selected bandit (switch, lag-0 choice) and for the previously selected bandit (switch, lag-1 choice). Significance of group effects in each category is indicated with uncorrected p values. Overall significance for the group effect was p = 0.046 (repeated-measures ANOVA).
Gender differences
The lesion and comparison groups were not matched in gender ratio; more men were in the FP group than in the BDC and NC groups (Table 1). To verify that these differences could not account for our observation, we performed statistical tests on gender differences within the NC, BDC, and pooled NC plus BDC groups. None of the parameters in the RL+LD model showed significant gender-related effects (minimum, p = 0.13). However, without correcting for multiple comparisons, in the lag weights from the linear conditional logit model a gender effect was observed on the lag-2 weight (uncorrected rank-sum, p = 0.024 and p = 0.041 for NC and NC+BDC, respectively). Mean lag-2 weight was lower for men (−2.16 ± 1.7) than for women (−0.6 ± 0.85) in the NC group. Although this analysis did not correct for multiple comparisons, it raises the possibility of a gender difference in the weighting of past payoffs and is suggestive of a greater tendency to extrapolate trends among men than among women. Such an effect, however, did not reach significance in the lag difference parameter of the RL+LD model. More important, a gender effect of this sort opposes the observed difference between FP and comparison subjects; we found that FP subjects showed more positive weighting of the lag-2 payoff; the greater relative number of men in the FP group therefore cannot explain the effect of group.
Dependence on lesion volume and lateralization
An unavoidable limitation of lesion studies of the present size is that lesion comparison groups may not be matched with respect to etiology, volume, lateralization, or other characteristics, many of which generally covary with lesion location. Of particular concern in the present case are the notable differences in lesion volume and lateralization between groups, with the FP group having on average larger and more bilateral lesions. We addressed these differences as possible explanations for the group effects observed on our task by performing two MANCOVAs with lesion volume and lateralization as continuous covariates. Because each covariate adds five parameters to the model, we examined them separately to avoid excessive model parameterization and consequent loss of power.
Group differences in the LD parameter remained significant after inclusion of the lesion lateralization index (F(2,26) = 8.24, p = 0.002, uncorrected). The contrasts among group means showed the lag difference parameter for both the NC and the BDC groups to be greater than for the FP group (p = 0.055, p = 0.021, respectively, uncorrected,). No interactions with lateralization approached significance (p > 0.2). The partial effect size for the LD parameter was partial η2 = 0.38.
With lesion volume as a covariate, the group effect in the LD parameter remained marginally significant (F(2,26) = 2.9; p = 0.071, uncorrected). The contrast between group means for NC and FP no longer reached significance (p = 0.24) but remained significant for BDC versus NC (p = 0.036). No interaction with lesion volume approached significance (p > 0.2). The partial effect size for the LD parameter was partial η2 = 0.18.
Reanalysis of behavioral data
Interpretation of the present results may depend and bear on the fMRI findings of Daw et al. (2006), who used the same task. In considering this relationship, it is important to examine whether the behavior between the groups is comparable because the 2006 study was performed under different conditions (during fMRI scanning; tighter response deadlines) and drew on a subject population [previously reported normal comparison group (PNC); n = 14] that differed in a number of respects from the present one, notably in age and nationality. Accordingly, we repeated the same RL model fits and nonparametric analyses as described in the previous sections on the behavioral data from the earlier study. This analysis confirmed that the mean and median LD parameters exceeded zero for group PNC (F(1,19) = 5.5, p = 0.030; signed-rank test, p = 0.029), implying trend following similar to the comparison groups in the present study. Although direct cross-study comparison between the two groups must be treated with caution for the reasons mentioned, the LD parameter for PNC did not differ significantly from that for the NC group (t = −1.50, p = 0.18, uncorrected; Wilcoxon rank-sum, p = 0.14, uncorrected), though it was significantly lower than that for BDC (t = −2.13; p = 0.040, uncorrected; rank-sum, p = 0.069). Finally, the median LD for PNC significantly exceeded that for FP (t = 2.26, p = 0.029, uncorrected; rank-sum, p = 0.043), in line with other comparison groups.
We confirmed that choices identified as exploratory according to the RL model (similar to the model from the earlier study) occurred predominantly on switch trials (average correlation between exploration and switching within PNC: M = 0.53, SD = 0.34); that is, trials that deviated from the RL prediction were more likely to be switch trials. We also observed that difference of lag-1 and lag-2 rewards correlated significantly with exploratory choices (F(21.8,1.6) = 5.2, p = 0.01). Mean difference for the most recently selected bandit was negative on exploratory trials (M = −1.00, SD = 0.35; p = 0.01, uncorrected) and positive on greedy (nonexploratory) trials (M = 0.31, SD = 0.11; p = 0.035, uncorrected). For the chosen bandit on exploratory trials, mean difference was marginally negative (M = −0.83, SD = 0.35; p = 0.08).
Discussion
With the present results, we identify a computationally specific origin for choices in changing environments that deviate from the predictions of a standard reinforcement learning model. We trace this component to anterior sectors of the prefrontal cortex. Using complementary model-based and less restrictive descriptive analyses, we examined the dependence of choices on reward history, isolating distinct components of the dependence and comparing them across lesion and nonlesion groups. We found that patients with FPC lesions were not grossly impaired in overall task performance and, contrary to our original hypothesis, that they did not show any general impairment in exploratory switching. Instead, we isolated a specific component of reward learning that normally guided responses in both comparison groups: participants in both lesion and healthy comparison groups tended to extrapolate the short-term trend in recent payoffs to predict future outcomes.
Although other aspects of reward learning and choice were indistinguishable from comparison groups, the frontopolar group behavior was not influenced by reward trend. This observation led us to refine the original hypothesis on the contribution of FPC to exploratory switching, assigning it a more specific role in the extrapolation of trends based on the recent history of rewards. Given that a chief effect of trend extrapolation on choices in the present task is to drive them away from a favored bandit whose value drops, this role, though unexpected, is highly consistent with the findings of a previous report of FPC activation during exploratory choices, operationalized there as deviations from an RL model that did not account for trend extrapolation (Daw et al., 2006). Indeed, the present findings (particularly given our demonstration here of the same trend-tracking behavior, previously undetected in the earlier dataset) may shed light on a question left unanswered by the way in which exploration was operationalized (in the negative, as otherwise unexplained behavior) in the original study by Daw et al. (2006): what computation or events triggered the exploratory behavior associated with frontopolar activation?
Although the previous imaging study (Daw et al., 2006) motivated us to focus on a very specific anatomical hypothesis about FPC, the lesion overlap in the present study does not provide a unique anatomical specificity due to the nature of the lesions. In all cases, lesions in the FP group extended to neighboring areas and subjacent white matter. Thus, though they address the original hypothesis, in themselves the lesion data are not sufficient to unambiguously connect the deficit we observed to FPC. Consequently, it remains unclear to what extent the present results can be attributed to damage within the FPC in isolation or to a larger network of anterior and ventral prefrontal cortices with which the FPC is interconnected. As with all studies of human lesions, the findings should be taken as demonstrating a clear dissociation among processes, but future studies will be required possibly using experimental lesions in animals to determine the precise neuroanatomical substrates. Lesions of FPC, in particular, frequently extend to the ventromedial prefrontal cortex and vice versa. Few, if any, lesion studies to date appear to have sufficient specificity and power to convincingly distinguish separate contributions of these neighboring sectors (Shallice and Burgess, 1991; Bechara et al., 1994; Burgess et al., 2000; Fellows and Farah, 2005; Pollmann et al., 2007). Thus, anatomical conclusions regarding FPC in humans are most strongly supported by the convergence of functional imaging and lesion data, with the former honing the anatomical specificity of the latter (Pollmann et al., 2007). The success of such a synthetic approach also depends on accurately distinguishing the primitive operations underlying the behavioral process by way of computational or structural modeling (Burgess et al., 2000).
Linking the present result back to more general cognitive mechanisms, the ability to extrapolate trends from sequential data likely requires processes for manipulating multiple separate representations (in this instance, of current and previous rewards) beyond those required by reinforcement learning. Such processes may be related to other functions associated with FPC, including integrating the outcomes of multiple cognitive events (Ramnani and Owen, 2004), decisions and their outcomes (Tsujimoto et al., 2010), and chosen and foregone option values (Boorman et al., 2009). All this is generally consistent with an emerging consensus implicating FPC in maintaining goal-related information and in initiating new behavioral sequences when competing courses of action must be evaluated concurrently (Koechlin et al., 1999; Boorman et al., 2009). Nevertheless, finding a more precise unifying model of the functions of FPC remains an open problem. It does not seem that other putative functions of FPC previously reported can be directly related to trend following, nor does the present result bear a clear-cut relationship with models of task switching. It may align more closely with work that implicates FPC in the comparison of sequential outcomes in the context of change detection (Pollmann et al., 2007; Pollmann and Manginelli, 2009) or encoding of responses when future responses depend on past responses (Tsujimoto et al., 2010).
In particular, the trend following component we introduce here departs from the suggestion of previous work using a similar task (Boorman et al., 2009) in that it operates on the valuation of the chosen bandit in a manner that does not depend on the value of the foregone bandits. One way to encompass these varying results within broader themes from the literature is to suggest that FPC more generally participates in complex causal or probabilistic modeling that demands attending to, encoding, updating, and comparing specific pieces of information in the environment beyond those required by a simple reinforcement learning process. In particular, a number of studies point to the importance of FPC in modulating attention to both externally presented and internally maintained information (Burgess et al., 2007; Pollmann et al., 2007). A function consistent with these observations would place FPC in the role of selecting the appropriate model for a given environment and directing other cognitive resources toward information required to implement the model; the details of its involvement would then depend on task by way of the particular models a task induces. There are a number of other possible ways in which FPC might contribute to such a function, such as by encoding the needed additional information on past outcomes or by comparing outcomes against model predictions. Further work will be required to delineate more clearly the necessary role of the FPC in each of these possibilities.
Finally, healthy participants extrapolated recent trends despite the fact that such trends have no predictive value for a momentumless random walk of the type we used to generate payoffs. (That is, because the payoffs diffused at each step by independent identically distributed noise, the change in payoff at one point is not predictive of later change.) Extrapolating the trend, therefore, was in principle a suboptimal strategy in the present study, though due to the noisy nature of the payoffs the consequent decrease of earnings is negligible here. Although our results leave open whether the differences between groups would remain when trend following is advantageous or more overtly disadvantageous, they imply a role for FPC in inappropriate trend following. If FPC does operate in selecting the relevant model for a given environment, it should play an important role in generating behavioral biases, which arise from model misapplication. Such biases can be consequential; for example, a similar bias has been observed in the valuation of stocks, in which people are often prone to extrapolate trends even when those are irrelevant to future prediction, potentially affecting the valuation of whole markets (Barberis et al., 1998). Although such an effect was not observed here, this raises the possibility that patients with FPC lesions could outperform healthy subjects under some circumstances, as has been observed with ventromedial PFC lesions on some tasks of reward-based decision making (Shiv et al., 2005). Understanding the neural origins of such biases will be important for anticipating them and addressing their consequences. Nevertheless, they must be adaptive under some circumstances given the disproportionate expansion of the FPC in human evolution since divergence from other hominoids (Semendeferi et al., 2001; Amati and Shallice, 2007). In general, trend extrapolation is predictive when change unfolds in a manner that is relatively consistent from timestep to timestep (e.g., the waxing and waning of vegetation with the seasons). It remains an intriguing challenge to identify more precisely the adaptive pressures that might have favored such biases and their relationship to uniquely human aspects of cognition.
Footnotes
Supported by National Institute of Neurological Disorders and Stroke Grant P50 NS19632 (D.T., R.A.), National Institute on Drug Abuse Grant DA022549 (D.T.), National Institute of Mental Health Grant MH080721 (R.A.), and the Tamagawa University Global Centers of Excellence Program of the Japanese Ministry of Education, Culture, Sports, and Technology (C.K.K., R.A.). N.D.D. was supported by a Scholar Award from the McKnight Foundation and a Scholar Award from the James S. McDonnell Foundation.
The authors declare no competing financial interests.
References
- Amati D, Shallice T. On the emergence of modern humans. Cognition. 2007;103:358–385. doi: 10.1016/j.cognition.2006.04.002. [DOI] [PubMed] [Google Scholar]
- Barberis N, Shleifer A, Vishny R. A model of investor sentiment. J Financial Econ. 1998;49:307–343. [Google Scholar]
- Bechara A, Damasio AR, Damasio H, Anderson SW. Insensitivity to future consequences following damage to human prefrontal cortex. Cognition. 1994;50:7–15. doi: 10.1016/0010-0277(94)90018-3. [DOI] [PubMed] [Google Scholar]
- Bechara A, Tranel D, Damasio H. Characterization of the decision-making deficit of patients with ventromedial prefrontal cortex lesions. Brain. 2000;123:2189–2202. doi: 10.1093/brain/123.11.2189. [DOI] [PubMed] [Google Scholar]
- Boorman ED, Behrens TE, Woolrich MW, Rushworth MF. How green is the grass on the other side? Frontopolar cortex and the evidence in favor of alternative courses of action. Neuron. 2009;62:733–743. doi: 10.1016/j.neuron.2009.05.014. [DOI] [PubMed] [Google Scholar]
- Burgess PW. Strategy application disorder: the role of the frontal lobes in human multitasking. Psychol Res. 2000;63:279–288. doi: 10.1007/s004269900006. [DOI] [PubMed] [Google Scholar]
- Burgess PW, Veitch E, de Lacy Costello A, Shallice T. The cognitive and neuroanatomical correlates of multitasking. Neuropsychologia. 2000;38:848–863. doi: 10.1016/s0028-3932(99)00134-7. [DOI] [PubMed] [Google Scholar]
- Burgess PW, Gilbert SJ, Dumontheil I. Function and localization within rostral prefrontal cortex (area 10) Philos Trans R Soc Lond B Biol Sci. 2007;362:887–899. doi: 10.1098/rstb.2007.2095. [DOI] [PMC free article] [PubMed] [Google Scholar]
- Camille N, Griffiths CA, Vo K, Fellows LK, Kable JW. Ventromedial frontal lobe damage disrupts value maximization in humans. J Neurosci. 2011;31:7527–7532. doi: 10.1523/JNEUROSCI.6527-10.2011. [DOI] [PMC free article] [PubMed] [Google Scholar]
- Daw ND. Trial-by-trial data analysis using computational models (tutorial review) In: Delgado MR, Phelps EA, Robbins TW, editors. Decision making, affect, and learning: attention and performance XXIII, Sec 1. Oxford: Oxford UP; 2011. p. 3. [Google Scholar]
- Daw ND, O'Doherty JP, Dayan P, Seymour B, Dolan RJ. Cortical substrates for exploratory decisions in humans. Nature. 2006;441:876–879. doi: 10.1038/nature04766. [DOI] [PMC free article] [PubMed] [Google Scholar]
- Dreher JC, Koechlin E, Tierney M, Grafman J. Damage to the fronto-polar cortex is associated with impaired multitasking. PLoS One. 2008;3:e3227. doi: 10.1371/journal.pone.0003227. [DOI] [PMC free article] [PubMed] [Google Scholar]
- Fellows LK, Farah MJ. Different underlying impairments in decision-making following ventromedial and dorsolateral frontal lobe damage in humans. Cereb Cortex. 2005;15:58–63. doi: 10.1093/cercor/bhh108. [DOI] [PubMed] [Google Scholar]
- Holmes AP, Friston KJ. Generalisability, random effects and population inference. Neuroimage. 1998;7:S754. [Google Scholar]
- Koechlin E, Hyafil A. Anterior prefrontal function and the limits of human decision-making. Science. 2007;318:594–598. doi: 10.1126/science.1142995. [DOI] [PubMed] [Google Scholar]
- Koechlin E, Basso G, Pietrini P, Panzer S, Grafman J. The role of the anterior prefrontal cortex in human cognition. Nature. 1999;399:148–151. doi: 10.1038/20178. [DOI] [PubMed] [Google Scholar]
- Lau B, Glimcher PW. Dynamic response-by-response models of matching behavior in rhesus monkeys. J Exp Anal Behav. 2005;84:555–579. doi: 10.1901/jeab.2005.110-04. [DOI] [PMC free article] [PubMed] [Google Scholar]
- McCullagh P, Nelder JA. Generalized linear models. Ed 2. Boca Raton, FL: Chapman and Hall; 1999. [Google Scholar]
- McFadden D. Conditional logit analysis of qualitative choice behavior. In: Zarembka P, editor. Frontiers in econometrics. New York: Academic; 1974. pp. 105–142. [Google Scholar]
- Miller EK, Cohen JD. An integrative theory of prefrontal cortex function. Annu Rev Neurosci. 2001;24:167–202. doi: 10.1146/annurev.neuro.24.1.167. [DOI] [PubMed] [Google Scholar]
- Noonan MP, Walton ME, Behrens TE, Sallet J, Buckley MJ, Rushworth MF. Separate value comparison and learning mechanisms in macaque medial and lateral orbitofrontal cortex. Proc Natl Acad Sci U S A. 2010;107:20547–20552. doi: 10.1073/pnas.1012246107. [DOI] [PMC free article] [PubMed] [Google Scholar]
- O'Doherty JP, Dayan P, Friston K, Critchley H, Dolan RJ. Temporal difference models and reward-related learning in the human brain. Neuron. 2003;38:329–337. doi: 10.1016/s0896-6273(03)00169-7. [DOI] [PubMed] [Google Scholar]
- Pollmann S, Manginelli AA. Early implicit contextual change detection in anterior prefrontal cortex. Brain Res. 2009;1263:87–92. doi: 10.1016/j.brainres.2009.01.039. [DOI] [PubMed] [Google Scholar]
- Pollmann S, Mahn K, Reimann B, Weidner R, Tittgemeyer M, Preul C, Müller HJ, von Cramon DY. Selective visual dimension weighting deficit after left lateral frontopolar lesions. J Cogn Neurosci. 2007;19:365–375. doi: 10.1162/jocn.2007.19.3.365. [DOI] [PubMed] [Google Scholar]
- Ramnani N, Owen AM. Anterior prefrontal cortex: insights into function from anatomy and neuroimaging. Nat Rev Neurosci. 2004;5:184–194. doi: 10.1038/nrn1343. [DOI] [PubMed] [Google Scholar]
- Schönberg T, Daw ND, Joel D, O'Doherty JP. Reinforcement learning signals in the human striatum distinguish learners from nonlearners during reward-based decision making. J Neurosci. 2007;27:12860–12867. doi: 10.1523/JNEUROSCI.2496-07.2007. [DOI] [PMC free article] [PubMed] [Google Scholar]
- Semendeferi K, Armstrong E, Schleicher A, Zilles K, Van Hoesen GW. Prefrontal cortex in humans and apes: a comparative study of area 10. Am J Phys Anthropol. 2001;114:224–241. doi: 10.1002/1096-8644(200103)114:3<224::AID-AJPA1022>3.0.CO;2-I. [DOI] [PubMed] [Google Scholar]
- Shallice T, Burgess PW. Deficits in strategy application following frontal lobe damage in man. Brain. 1991;114:727–741. doi: 10.1093/brain/114.2.727. [DOI] [PubMed] [Google Scholar]
- Shiv B, Loewenstein G, Bechara A, Damasio H, Damasio AR. Investment behavior and the negative side of emotion. Psychol Sci. 2005;16:435–439. doi: 10.1111/j.0956-7976.2005.01553.x. [DOI] [PubMed] [Google Scholar]
- Strange BA, Henson RN, Friston KJ, Dolan RJ. Anterior prefrontal cortex mediates rule learning in humans. Cereb Cortex. 2001;11:1040–1046. doi: 10.1093/cercor/11.11.1040. [DOI] [PubMed] [Google Scholar]
- Sutton RS. Learning to predict by the methods of temporal differences. Machine Learning. 1988;3:9–44. [Google Scholar]
- Tsujimoto S, Genovesio A, Wise SP. Evaluating self-generated decisions in frontal pole cortex of monkeys. Nat Neurosci. 2010;13:120–126. doi: 10.1038/nn.2453. [DOI] [PMC free article] [PubMed] [Google Scholar]
- Walton ME, Behrens TE, Buckley MJ, Rudebeck PH, Rushworth MF. Separable learning systems in the macaque brain and the role of orbitofrontal cortex in contingent learning. Neuron. 2010;65:927–939. doi: 10.1016/j.neuron.2010.02.027. [DOI] [PMC free article] [PubMed] [Google Scholar]
- Wunderlich K, Rangel A, O'Doherty JP. Neural computations underlying action-based decision making in the human brain. Proc Natl Acad Sci U S A. 2009;106:17199–17204. doi: 10.1073/pnas.0901077106. [DOI] [PMC free article] [PubMed] [Google Scholar]