Abstract
Type 2 diabetes mellitus (T2DM) is a risk factor for Alzheimer disease (AD). Populations at risk for AD show altered brain activity in the default mode network (DMN) before cognitive dysfunction. We evaluated this brain pattern in T2DM patients. We compared T2DM patients (n = 10, age = 56 ± 2.2 years, fasting plasma glucose [FPG] = 8.4 ± 1.3 mmol/L, HbA1c = 7.5 ± 0.54%) with nondiabetic age-matched control subjects (n = 11, age = 54 ± 1.8 years, FPG = 4.8 ± 0.2 mmol/L) using resting-state functional magnetic resonance imaging to evaluate functional connectivity strength among DMN regions. We also evaluated hippocampal volume, cognition, and insulin sensitivity by homeostasis model assessment of insulin resistance (HOMA-IR). Control subjects showed stronger correlations versus T2DM patients in the DMN between the seed (posterior cingulate) and bilateral middle temporal gyrus (β = 0.67 vs. 0.43), the right inferior and left medial frontal gyri (β = 0.75 vs. 0.54), and the left thalamus (β = 0.59 vs. 0.37), respectively, with no group differences in cognition or hippocampal size. In T2DM patients, HOMA-IR was inversely correlated with functional connectivity in the right inferior frontal gyrus and precuneus. T2DM patients showed reduced functional connectivity in the DMN compared with control subjects, which was associated with insulin resistance in selected brain regions, but there were no group effects of brain structure or cognition.
Type 2 diabetes mellitus (T2DM) and insulin resistance are associated with systemic hyperinsulinemia and reduced brain insulin levels, which are risk factors associated with Alzheimer disease (AD) (1). Because insulin resistance, one of the main features of T2DM, is modifiable, it is important to determine whether early signs of AD can be detected in T2DM patients so that treatments can be implemented to prevent onset of dementia at a preclinical phase when therapies may be more effective (2).
In other populations at risk for AD, such as carriers of the apolipoprotein E (ApoE) ApoE-ε4 allele (3), researchers have reported reduced glucose metabolism and/or reduced resting-state functional connectivity (3,4) in the brain’s default mode network (DMN) before cognitive decline is evident. The DMN, which includes the posterior cingulate cortex (PCC) and temporoparietal posterior association cortical regions of the brain, is most active at rest and is suspended during cognitive activity (5).
In addition to brain functional changes, structural atrophy in the medial temporal lobe has been observed in T2DM patients (6) as well as people with insulin resistance (7) and may predict progression from the normal elderly state to mild cognitive impairment and from mild cognitive impairment to AD (8). We measured hippocampal volume and correlated it with functional connectivity measurements to determine whether hippocampal size varies with a particular region in the DMN and whether functional connectivity and structural atrophy are evident prior to cognitive decline.
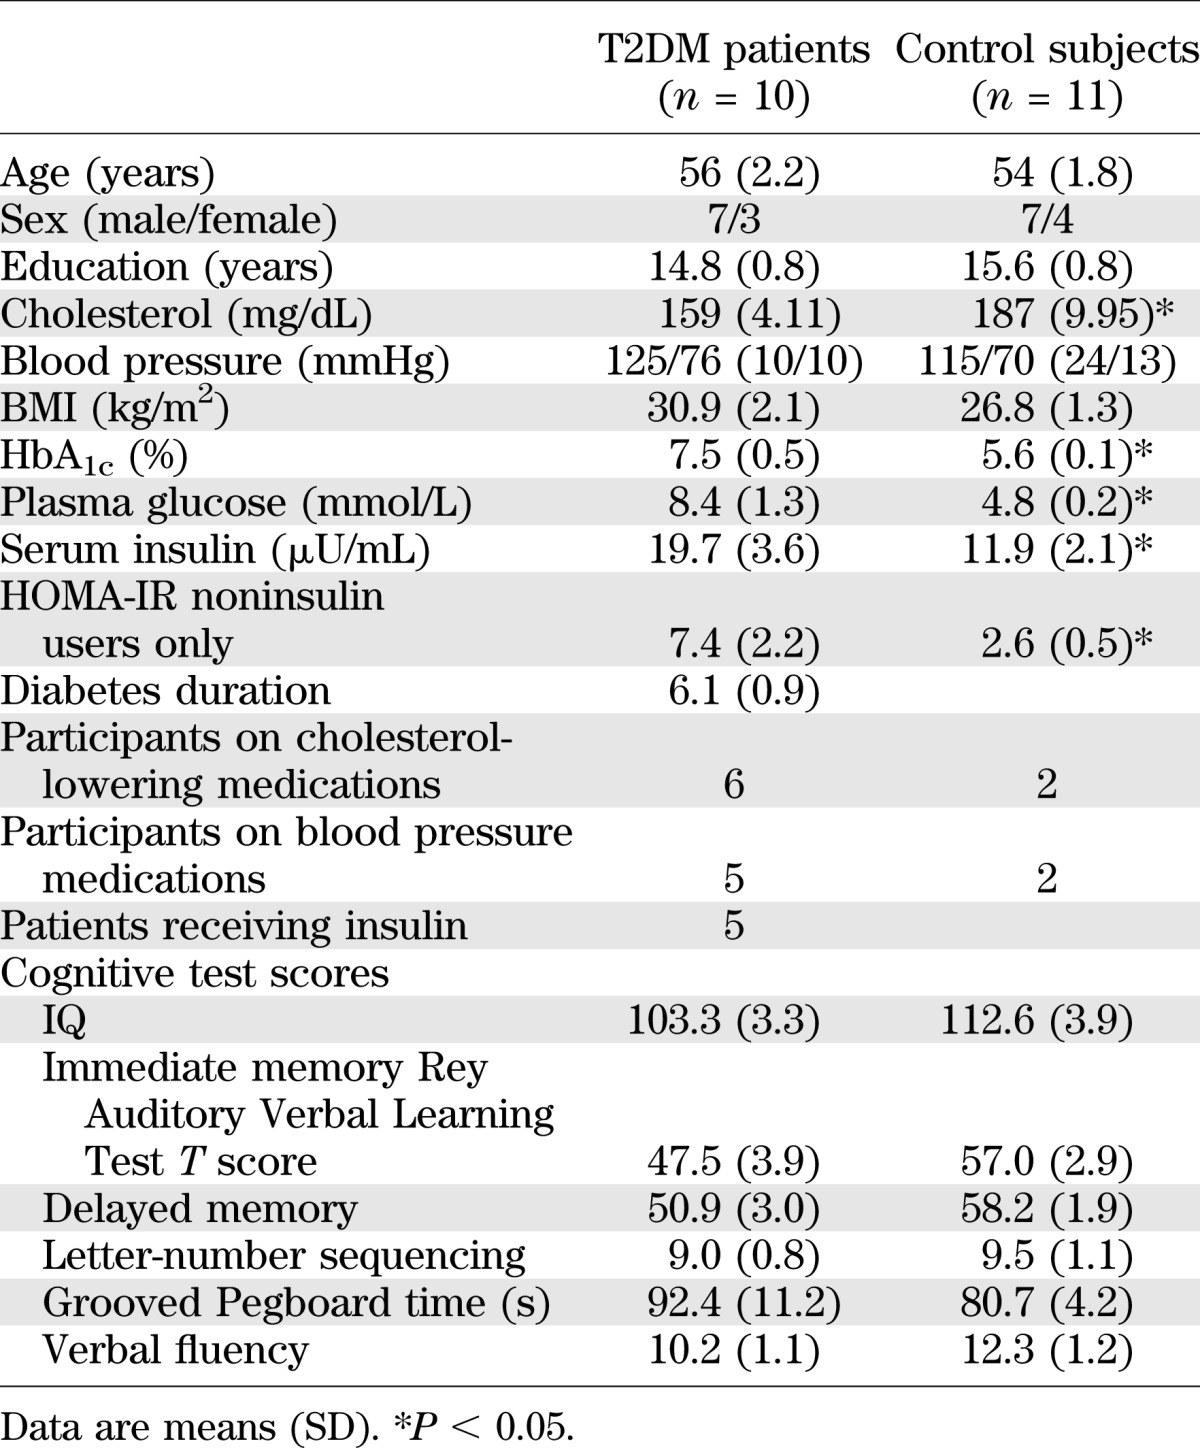
Impaired cognition is the last symptom to emerge prior to decline in clinical function (9). Thus, to establish that our patients were cognitively intact, we administered a battery of neuropsychological tests before the functional magnetic resonance imaging (fMRI) scan to assess IQ, memory, attention, executive function, and psychomotor speed.
On the basis of earlier findings in those at risk for AD, we hypothesized that 1) patients with T2DM would show reduced functional connectivity in the DMN compared with nondiabetic control subjects, 2) reduced functional connectivity would be associated with the severity of insulin resistance, and 3) hippocampal size would be reduced in the T2DM group relative to the non-T2DM group. However, because it is not yet clear whether structural atrophy precedes changes in resting-state functional connectivity (9), brain volumetric changes may not yet be detectable.
RESEARCH DESIGN AND METHODS
The study sample consisted of 10 T2DM patients and 11 healthy, age-matched control subjects. All participants were between the ages of 45 and 66 years (average ± SEM age = 54.8 ± 2.2 years), and disease duration was between 7 months and 10 years (mean = 6.1 ± 0.9 years). T2DM patients could not be treated with metformin or thiazolidinediones to qualify for the study. In both T2DM patients and control subjects, any contraindications to imaging, such as gunshot wound, pacemaker, pregnancy, and claustrophobia, were also exclusionary factors. After approval from the institutional review boards of both the Joslin Diabetes Center and McLean Hospital (where the MRI was performed), patients and nondiabetic control subjects provided their informed consent and the following information during screening: psychiatric history, handedness, medical history, current medications, height, and weight. T2DM patients also provided date of diagnosis. All participants were studied in the fasting state, and glucose and insulin levels were measured for calculation of homeostasis model assessment of insulin resistance (HOMA-IR). Patients receiving insulin were asked to refrain from taking their insulin on the day of the study.
Cognitive assessment.
We administered the Wechsler Abbreviated Scale of Intelligence (10), verbal fluency and trail making number-letter switching from the Delis-Kaplan Executive Function System (11), the Rey Auditory Verbal Learning Test (12), and the Grooved Pegboard (13).
Data analysis.
Between-group t tests were used to compare demographic and clinical characteristics between T2DM and control subjects. All tests were conducted using a two-sided α-level of 0.05. Demographic and cognitive data are presented as mean (SD); between-groups comparisons are presented as mean ± SEM. A general linear model was used to assess functional connectivity strengths (using β-weights), and Pearson correlation was used to determine whether hippocampal volume and HOMA-IR were correlated with β-weights.
MRI acquisition.
All imaging data were acquired at McLean Hospital Brain Imaging Center on a Siemens 3T Trio scanner (Erlangen, Germany) using the standard Siemens eight-element receiver phased-array head coil for high resolution anatomical scans.
Functional images.
Functional image parameters included gradient-echo planar sequence sensitive to blood oxygen level–dependent (BOLD) contrast (repetition time = 3,000 ms, echo time = 30 ms, and flip angle = 90°), whole-brain volumes with 26 contiguous 5 mm–thick transverse slices, no interslice gap, and 3.125 × 3.125 mm in-plane resolution (14). Patients lay still in the scanner with their eyes closed but remained awake.
Structural images.
Pulse sequence and parameters were contiguous sagittal three-dimensional series magnetization prepared rapid acquisition gradient echo (matrix = 256 × 256, field of view = 25.6 cm, 128 slices, slice thickness = 1.33 mm, flip angle = 12°, echo time = 2.74 ms, and repetition time = 2,100 ms). Images were realigned to Talairach space using the anterior and posterior commissures and the sagittal sulcus plane.
FMRI image processing and analysis.
We assessed functional connectivity between the PCC and all other regions in the brain using Brain Voyager QX and by drawing a cube of 10 mm on each side, centered on the PCC using Talairach coordinates 0, –56, 20. The average time course of the BOLD signal was extracted from the PCC seed region and used as the model predictor in a general linear model analysis to determine brain regions temporally correlated with it.
Structural image analysis and processing.
Structural MRI data were processed at the Psychiatry Neuroimaging Laboratory using 3D Slicer to visualize and realign the data (http://www.slicer.org). The FMRIB Software Library (FSL v.4.1; http://www.fmrib.ox.ac.uk) was used for skull stripping (15) and to estimate the intracranial volume to control for head size, and the FreeSurfer software package (version 4.5.0; http://surfer.nmr.mgh.harvard.edu/) was used for automated segmentation of the hippocampus (16).
Insulin resistance.
HOMA-IR was calculated for control subjects and non–insulin treated T2DM patients to determine whether insulin resistance was associated with functional connectivity patterns. Because HOMA-IR does not accurately reflect insulin resistance in the presence of exogenous insulin treatment, it was not measured in insulin-treated patients (17).
RESULTS
Clinical demographic characteristics and cognitive results.
The clinical demographic characteristics and cognitive scores are summarized in Table 1.
TABLE 1.
Demographic, clinical, and cognitive characteristics

Functional connectivity.
Regression analyses were carried out between the seed reference (PCC) and all other voxels to determine which regions had low-frequency fluctuations that were most closely correlated with it.
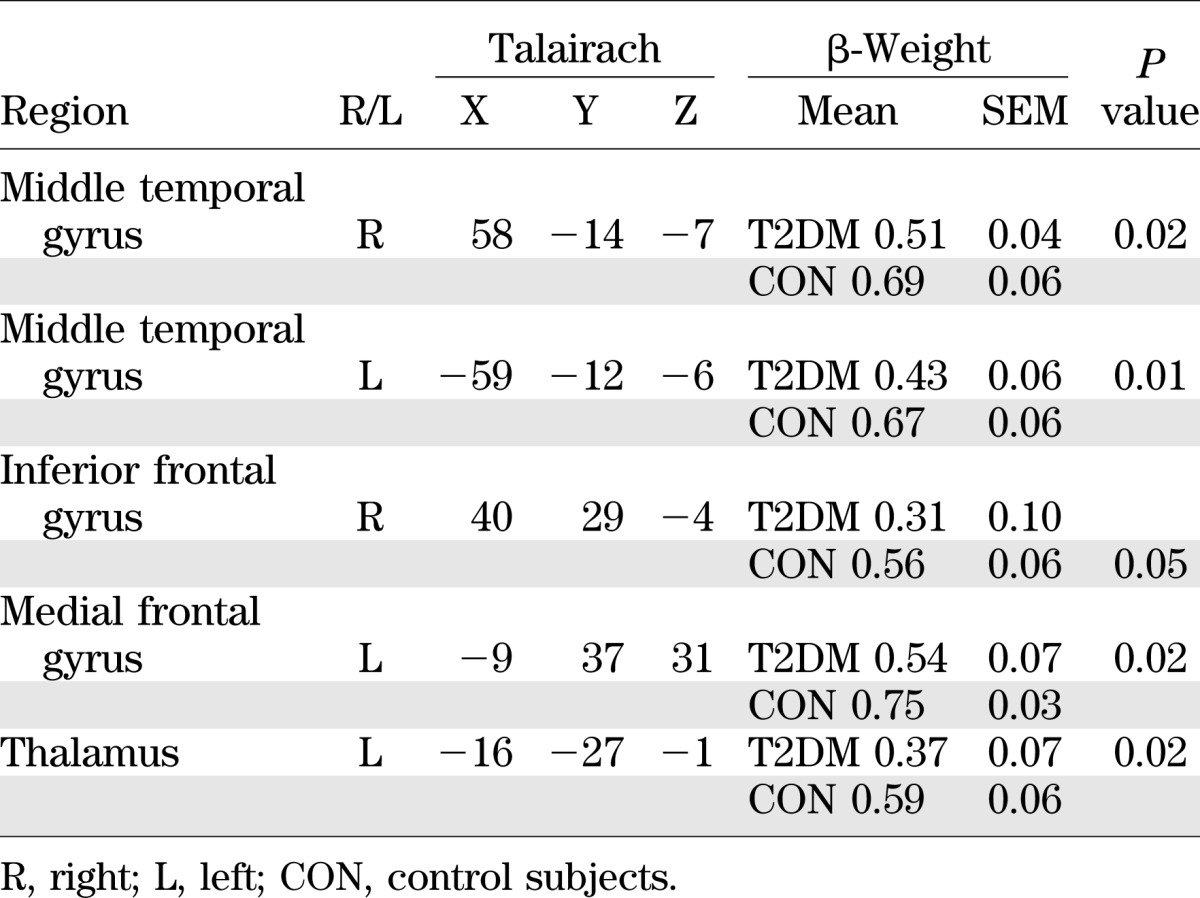
When combining both groups, the following regions were identified as being functionally connected, that is, their low-frequency temporal fluctuations were significantly correlated with those of the PCC (β > 0, P < 0.05, corrected for multiple comparisons) (18): the right and left middle temporal, right medial frontal, and left fusiform gyri; right inferior frontal cortices; right precuneus; left caudate; and left thalamus.
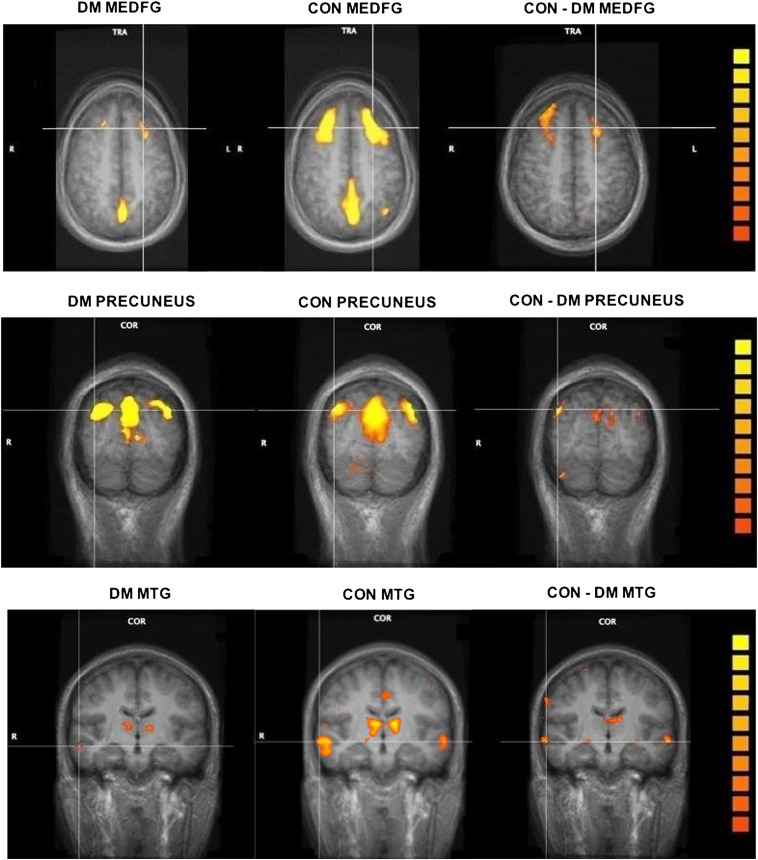
In a second-level analysis, we used a random-effects two-sample t test to determine whether there were group differences between the strength of functional connectivity of these regions (19). We found that the bilateral middle temporal gyrus, left medial and right inferior frontal gyri, and left thalamus were not as strongly correlated with the PCC seed region in T2DM patients compared with control subjects. Figure 1 shows regions that were functionally connected to the PCC in control compared with T2DM subjects in three different slices. Table 2 lists the brain regions that are functionally connected to the PCC as well as their associated β-weights and Talairach coordinates. Figure 1 and Table 2 show that the low-frequency BOLD fluctuations are more strongly correlated in the control group relative to the T2DM group, indicating reduced functional connectivity in the T2DM group. Because IQ can affect brain volume (20), we conducted a post hoc regression analysis controlling for both full-scale IQ and verbal IQ, and the results remained significant.
FIG. 1.
Differences in DMN functional connectivity between T2DM and control subjects. The left and middle columns show functional connectivity maps of T2DM (DM) and control (CON) subjects, respectively. The color scale represents the strength of functional connectivity with the PCC (increasing strength from orange to yellow). The right column shows regions for which the strength of functional connectivity with the PCC was significantly higher in control compared with T2DM subjects (P < 0.05, corrected). All images are represented in color overlaid on the anatomical slices (gray). The top row shows functional connectivity differences in medial frontal gyrus (MEDFG; axial slice); the middle row shows functional connectivity in the precuneus (coronal slice); and the bottom row shows functional connectivity differences in the middle temporal gyrus (MTG; coronal slice) with the thalamus also visible. Corresponding Talairach coordinates for MTG and MEDFG are presented in Table 2. (A high-quality digital representation of this figure is available in the online issue.)
TABLE 2.
β-Weights for the DMN regions significantly correlated with the PCC

Structural results.
There were no differences in hippocampal volume between T2DM and control groups (right hippocampal volume: control subjects = 4.4 ± 0.12 cm3 vs. T2DM patients = 4.0 ± 0.17 cm3; left hippocampal volume: control subjects = 4.3 ± 0.09 cm3 vs. T2DM patients = 4.1 ± 0.09 cm3). We found no correlations between the β-weights derived from the functional connectivity measure and either hippocampal volume or cognitive scores.
HOMA-IR.
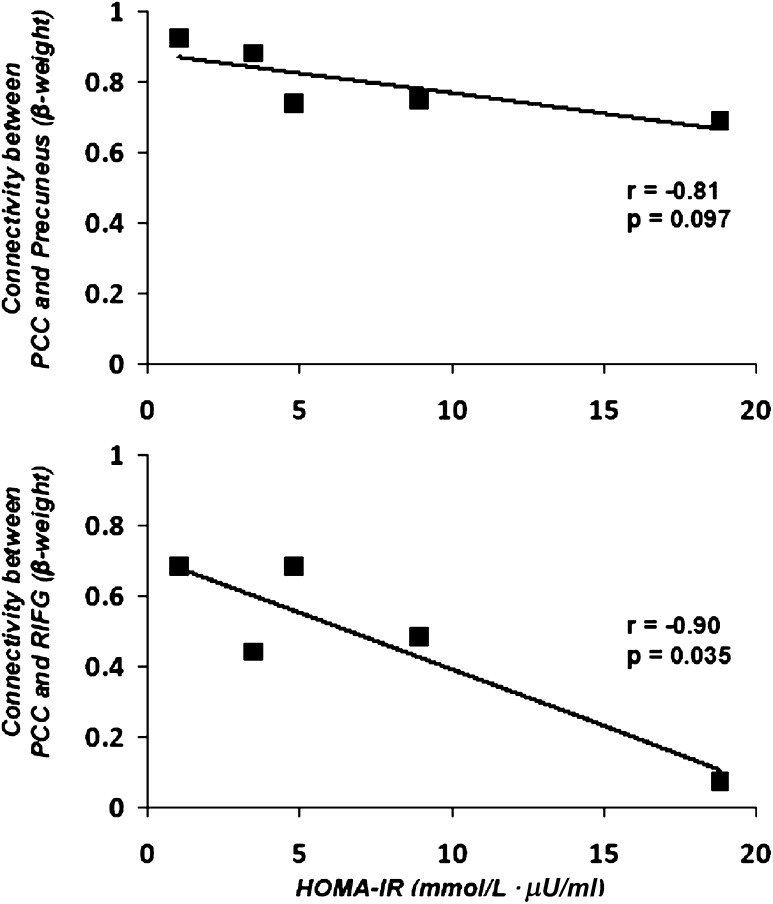
HOMA-IR was significantly higher in the five non–insulin-treated T2DM patients compared with control subjects (7.4 ± 3.1 vs. 2.6 ± 0.5 mmol/L ⋅ μU/mL; P < 0.05). In the T2DM patients, HOMA was inversely correlated with the β-weights for connectivity between the PCC and multiple other brain regions involved in the DMN, particularly the right inferior frontal gyrus (r = −0.90, P = 0.035) and the right precuneus (r = −0.81, P = 0.097) (Fig. 2).
FIG. 2.
Correlation of HOMA-IR with connectivity between the PCC and the precuneus (top panel) and connectivity between PCC and the right inferior frontal gyrus (RIFG; bottom panel) in the five T2DM patients who were not treated with insulin.
Disease duration.
Diabetes duration was not associated with functional connectivity, hippocampal volume, or cognition.
DISCUSSION
In the current study, we demonstrated that patients with T2DM show reduced functional connectivity in several default mode regions, including the middle temporal gyri, bilaterally, right inferior and left medial frontal gyri, and left thalamus, even when controlling for IQ. There were no group differences in hippocampal volumes and no differences in cognitive performance. In the T2DM group, HOMA-IR was inversely correlated with functional connectivity in several regions of the DMN, particularly the right inferior frontal gyrus and right precuneus. Disruption in functional connectivity is associated with insulin resistance and occurs before cognitive or structural deficits and may provide an early method to evaluate whether T2DM patients are at elevated risk for AD.
This abnormal brain pattern in the DMN has recently been demonstrated using positron emission tomography in older individuals (aged ∼74 years) with insulin resistance in a mixed group of people with T2DM or prediabetes (21). Our study extends these findings. We focused on younger T2DM participants, which reduces the influence of age-related comorbidities that might affect cognition and brain responses. We used resting-state fMRI rather than positron emission tomography, which makes it more scalable because it does not require radioactive tracers. This method could be used to detect abnormalities in functional connectivity in apoE-ε4 carriers who do not yet show amyloid build up (4). We also included volumetric measurements of the hippocampus. The hippocampus is one of the first brain structures affected by AD and also has been shown to be a vulnerable region to the effects of T2DM (22).
Although the mechanisms linking T2DM and risk of AD are not yet understood, several hypotheses have been suggested. The DMN is highly metabolically active and is a site of increased aerobic glycolysis, making these regions more susceptible to amyloid accumulation (23). Altered glucose metabolism inherent in diabetes may augment this process.
Unlike some other groups at risk for AD, we do not know whether increased amyloid is the basis of the underlying association between diabetes and AD. It is possible that vascular changes seen in T2DM heighten the risk for AD (24). Finally, it is unclear whether the reduced functional connectivity results we obtained are a warning signal of impending AD or of some other abnormality, such as amyloid deposition, endothelial dysfunction, advanced glycation end products, or inflammation (25).
One limitation of our study is that we do not know whether participants carry the apoE-ε4 allele. Future studies in this line of research should include this information. However, it is unclear whether apoE-ε4 has any additional effect on DMN metabolism, independent of T2DM or insulin resistance (21). In addition, our sample size is small, and this may have reduced our ability to detect changes in cognition or hippocampal volume in our T2DM group.
In summary, T2DM patients showed reduced functional connectivity between the PCC and other DMN regions despite normal cognition and hippocampal volume. The disruption in functional connectivity is correlated with the severity of insulin resistance. It is important that because level of insulin resistance is modifiable, it may be a variable under patient control. Thus, diet and exercise may ameliorate reduced functional connectivity in the DMN and lessen the risk for AD in this population. As this research field evolves, a clearer protocol will emerge outlining what steps can be taken to reduce AD risk in people with insulin resistance.
ACKNOWLEDGMENTS
This study was supported in part by National Institutes of Health grants 5R01-AG-034165-A2 (G.M.) and P30-DK-36836 (to the Joslin Diabetes and Endocrinology Research Center) and by the Herbert Graetz Fund.
No potential conflicts of interest relevant to this article were reported.
G.M., A.M.J., N.R.B., D.C.S., and M.E.S. researched data, contributed to discussion, and wrote, reviewed, and edited the manuscript. R.L.M., V.L.F., and W.S.H. researched data, contributed to discussion, and reviewed and edited the manuscript. G.M. is the guarantor of this work and, as such, had full access to all the data in the study and takes responsibility for the integrity of the data and the accuracy of the data analysis.
Parts of this study were presented in abstract form at the 70th Scientific Sessions of the American Diabetes Association, Orlando, Florida, 25–29 June 2010, and at the American Diabetes Association Research Symposium on Diabetes and the Brain, Alexandria, Virginia, 28–30 October 2011.
REFERENCES
- 1.Craft S. Insulin resistance and Alzheimer’s disease pathogenesis: potential mechanisms and implications for treatment. Curr Alzheimer Res 2007;4:147–152 [DOI] [PubMed] [Google Scholar]
- 2.Mosconi L, Berti V, Glodzik L, Pupi A, De Santi S, de Leon MJ. Pre-clinical detection of Alzheimer’s disease using FDG-PET, with or without amyloid imaging. J Alzheimers Dis 2010;20:843–854 [DOI] [PMC free article] [PubMed] [Google Scholar]
- 3.Reiman EM, Chen K, Alexander GE, et al. Functional brain abnormalities in young adults at genetic risk for late-onset Alzheimer’s dementia. Proc Natl Acad Sci U S A 2004;101:284–289 [DOI] [PMC free article] [PubMed] [Google Scholar]
- 4.Sheline YI, Raichle ME, Snyder AZ, et al. Amyloid plaques disrupt resting state default mode network connectivity in cognitively normal elderly. Biol Psychiatry 2010;67:584–587 [DOI] [PMC free article] [PubMed] [Google Scholar]
- 5.Raichle ME. What words are telling us about the brain. Cold Spring Harb Symp Quant Biol 1996;61:9–14 [PubMed] [Google Scholar]
- 6.Hempel R, Onopa R, Convit A. Type 2 diabetes affects hippocampus volume differentially in men and women. Diabetes Metab Res Rev 2012;28:76–83 [DOI] [PMC free article] [PubMed] [Google Scholar]
- 7.Rasgon NL, Kenna HA, Wroolie TE, et al. Insulin resistance and hippocampal volume in women at risk for Alzheimer’s disease. Neurobiol Aging 2011;32:1942–1948 [DOI] [PMC free article] [PubMed] [Google Scholar]
- 8.Apostolova LG, Mosconi L, Thompson PM, et al. Subregional hippocampal atrophy predicts Alzheimer’s dementia in the cognitively normal. Neurobiol Aging 2010;31:1077–1088 [DOI] [PMC free article] [PubMed] [Google Scholar]
- 9.Jack CR, Jr, Knopman DS, Jagust WJ, et al. Hypothetical model of dynamic biomarkers of the Alzheimer’s pathological cascade. Lancet Neurol 2010;9:119–128 [DOI] [PMC free article] [PubMed] [Google Scholar]
- 10.Wechsler D. WASI Manual. San Antonio, TX, Psychological Corporation, 1999 [Google Scholar]
- 11.Delis DC, Kaplan E, Kramer JH. The Delis-Kaplan Executive Function System: Examiner’s Manual. San Antonio, TX, The Psychological Corporation, 2001 [Google Scholar]
- 12.Schmidt M. Rey Auditory Verbal Learning Test: A Handbook. Los Angeles, CA, Western Psychological Services, 1996 [Google Scholar]
- 13.Matthews CG, Klove H. Instruction Manual for the Adult Neuropsychology Test Battery. Madison, WI, University of Madison Medical School, 1964 [Google Scholar]
- 14.Frederick B, Rohan M, Elman I, Lukas S, Renshaw PF. Improved localization of fMRI activation in the basal forebrain at high field using match warped anatomical images. Late-breaking abstract presented at the 66th Annual Meeting of the College on Problems of Drug Dependence, 12–17 June 2004, San Juan, Puerto Rico [Google Scholar]
- 15.Smith SM. Fast robust automated brain extraction. Hum Brain Mapp 2002;17:143–155 [DOI] [PMC free article] [PubMed] [Google Scholar]
- 16.Dale AM, Fischl B, Sereno MI. Cortical surface-based analysis. I. Segmentation and surface reconstruction. Neuroimage 1999;9:179–194 [DOI] [PubMed] [Google Scholar]
- 17.Muniyappa R, Lee S, Chen H, Quon MJ. Current approaches for assessing insulin sensitivity and resistance in vivo: advantages, limitations, and appropriate usage. Am J Physiol Endocrinol Metab 2008;294:E15–E26 [DOI] [PubMed] [Google Scholar]
- 18.Friston KJ. Testing for anatomically specified regional effects. Hum Brain Mapp 1997;5:133–136 [DOI] [PubMed] [Google Scholar]
- 19.Holmes AP, Friston KJ. Generalisability, random effects and population inference. Neuroimage 1998;7:S754 [Google Scholar]
- 20.Toga AW, Thompson PM. Genetics of brain structure and intelligence. Annu Rev Neurosci 2005;28:1–23 [DOI] [PubMed] [Google Scholar]
- 21.Baker LD, Cross DJ, Minoshima S, Belongia D, Watson GS, Craft S. Insulin resistance and Alzheimer-like reductions in regional cerebral glucose metabolism for cognitively normal adults with prediabetes or early type 2 diabetes. Arch Neurol 2011;68:51–57 [DOI] [PMC free article] [PubMed] [Google Scholar]
- 22.Gold SM, Dziobek I, Sweat V, et al. Hippocampal damage and memory impairments as possible early brain complications of type 2 diabetes. Diabetologia 2007;50:711–719 [DOI] [PubMed] [Google Scholar]
- 23.Vlassenko AG, Vaishnavi SN, Couture L, et al. Spatial correlation between brain aerobic glycolysis and amyloid-β (Aβ) deposition. Proc Natl Acad Sci U S A 2010;107:17763–17767 [DOI] [PMC free article] [PubMed]
- 24.Tan ZS, Beiser AS, Fox CS, et al. Association of metabolic dysregulation with volumetric brain magnetic resonance imaging and cognitive markers of subclinical brain aging in middle-aged adults: the Framingham Offspring Study. Diabetes Care 2011;34:1766–1770 [DOI] [PMC free article] [PubMed] [Google Scholar]
- 25.Craft S. Insulin resistance syndrome and Alzheimer’s disease: age- and obesity-related effects on memory, amyloid, and inflammation. Neurobiol Aging 2005;26(Suppl. 1):65–69 [DOI] [PubMed] [Google Scholar]


