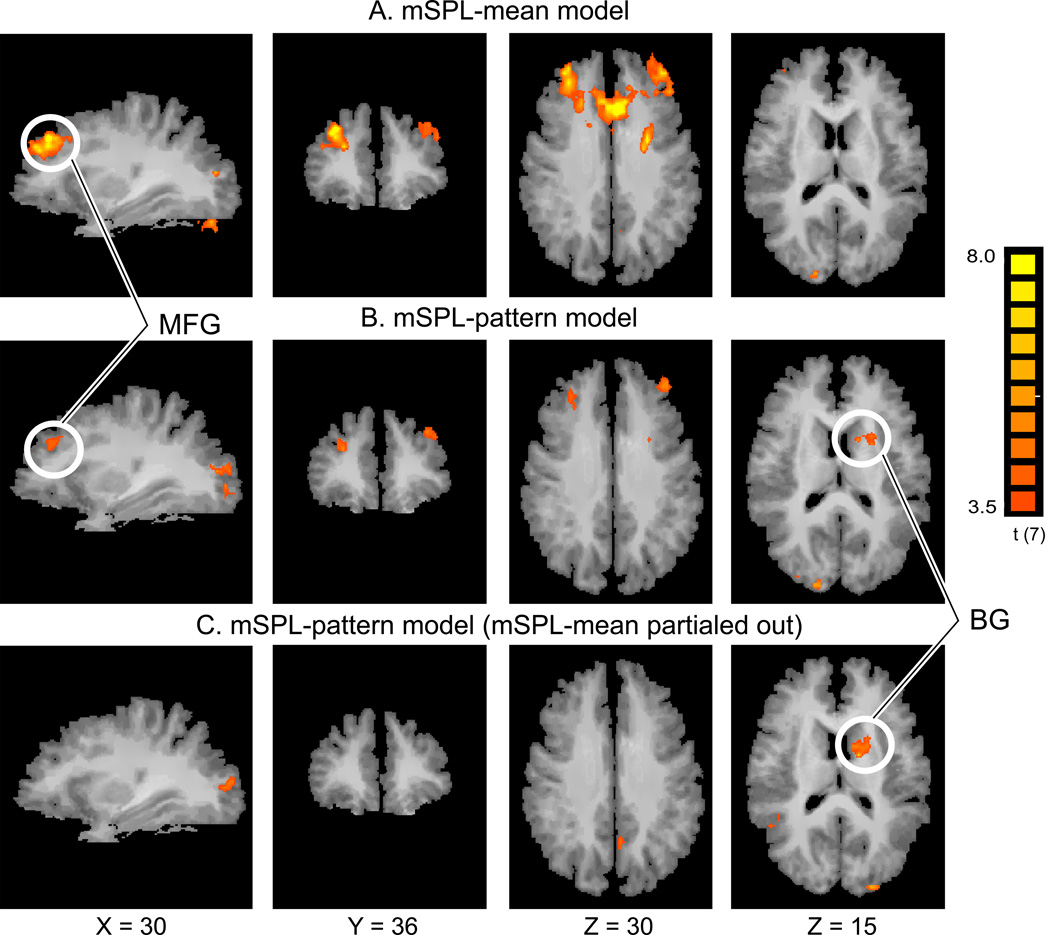
Figure 3.
Comparison of two functional connectivity analyses. (A) Conventional functional connectivity analysis results using the mean BOLD signal time course in mSPL as the seed (mSPL-mean model). The correlated regions are quite extensive both in lateral and medial frontal lobes. (B) Correlation map from the mSPL MVPTC (mSPL-pattern model) revealing more focused clusters of activation and a previously undetected cluster in the basal ganglia (BG). (C) Correlation map of voxels uniquely correlated with the mSPL-pattern model, revealing clusters in BG, similar to those in (B). The cluster size correction for multiple comparisons yielded the same family wise Type I error rate of p < 0.05 for both sets of maps shown here. Note that the mSPL seed region and the surrounding parietal regions were masked out of both analyses. MFG: Middle Frontal Gyrus.

