

Abstract
The risk of end-stage renal disease (ESRD) remains high in patients with type 1diabetes and proteinuria; however, little is known about the rate of decline in their renal function. To help determine this we enrolled patients with 1 diabetes and proteinuria whose estimated glomerular filtration rate (eGFR) was normal (equal to or above 60 ml/min/1.73m2). Using a minimum of 5 serial measurements of serum creatinine for 161 patients, we determined individual trajectories of eGFR change and the occurrence of ESRD during 5–18 years of follow-up. The rates were linear for 110 patients, for 24 the non-linear rate was mild enough to satisfy a linear model, and the rates were clearly non-linear for only 27 patients. Overall, in more than one third of patients, the eGFR decline was less than 3.5 ml/min/1.73m2 per year and the lifetime risk of ESRD could be considered negligible. In the remainder of patients, eGFR declined with widely different slopes and ESRD developed within 2 to 18 years. Based on up to five years observation when renal function was within the normal range, the estimates of early eGFR slope predicted the risk of ESRD during subsequent follow-up better than the baseline clinical characteristics of glycated hemoglobin, blood pressure, or the albumin to creatinine ratio. Thus, the early slope of eGFR decline in patients with type 1diabetes and proteinuria can be used to predict the risk of ESRD.
INTRODUCTION
In our recent follow-up study, we found that patients with Type 1 Diabetes (T1D) and proteinuria are at high risk of end stage renal disease (ESRD) despite nearly universal reno-protective treatment (1). In those with normal serum creatinine-based estimated glomerular filtration rate (eGFR ≥ 60 ml/min/1.73m2) at enrollment, the 15-year risk of ESRD was approximately 25%. FinnDiane study investigators reported a similar risk of ESRD in a comparable cohort (2).
Knowledge of the course of renal function changes in patients with proteinuria due to diabetes is limited. At one extreme of possible trajectories is a pattern with episodic declines of renal function that is referred to as intermittent episodes of acute renal failure by some authors (3). Such a pattern would suggest the involvement of stochastic processes that defy prediction of the time until onset of ESRD. At the other extreme is a pattern with a constant rate of decline in renal function. This pattern was first demonstrated empirically in a group of 34 individuals with various renal conditions (4). Subsequent study of nine individuals with diabetes and impaired renal function confirmed the linearity of the decline although there was large inter-individual variation (5). Other early studies reported a linear GFR decline but follow-up was short and study groups small (6–8).
As suggested by these examples, the shape of the trajectories over time and how it varies among patients may provide important clues about the mechanisms that underlie progression to ESRD. A stochastic process suggests a role of environmental triggers, and identification of their nature calls for a particular type of study design. A constant decline, on the other hand, suggests a constitutive determinant and calls for a different type of study design. For example, a genetic factor would be detectable when renal function is still in the normal range. Moreover, a constant slope implies that determination of the early slope while renal function is normal could predict the late slope and, therefore, the risk of ESRD.
No prior study of patients with T1D and proteinuria has traced complete trajectories of renal function changes from normal to ESRD. This report traces complete trajectories of renal function change in the Joslin cohort of patients with T1D and proteinuria who were followed for 5 to 18 years (1). Three questions guided the analysis. What patterns of trajectories of renal function changes occur in this population? If linear, how varied are the overall slopes of change during follow-up? To what extent can the early slope of eGFR decline predict ESRD?
RESULTS
Characteristics of the Study Group
The study group comprised patients with T1D and proteinuria who were enrolled into the Joslin Proteinuria Cohort study between 1991 and 2004 and followed through 2008 (1). All were of European ancestry. This study was restricted to the 244 patients with normal renal function (eGFR ≥ 60 ml/min) at enrollment. In the initial analysis to determine patterns of trajectories of renal function changes, we used 161 patients (66% of the study group) who had at least five measurements (range 5–73) of serum creatinine (see Methods). Clinical characteristics of patients with frequent and less frequent measurements of serum creatinine are summarized in Table 1. Those with less than five had shorter follow-up and a lower number of creatinine measurements per year. Otherwise, the two sub-groups had very similar clinical characteristics; therefore, we concluded that the patterns of trajectories of renal function changes in those with frequent creatinine measurements were representative of all 244 patients. All 244 patients were used for extracting the linear component of each trajectory to generate a distribution of slopes of overall eGFR change during follow-up. For evaluating the early slope of eGFR values as a predictor of ESRD risk, 28 had insufficient early eGFR measurements for estimating an early slope (see Methods) and the remaining 216 were used.
Table 1.
Characteristics of the study group according to number of serum creatinine measurements
| Number of serum creatinine determinations during follow-up | ||||
|---|---|---|---|---|
| Characteristic | Total group N=244 |
≥5 measurements N=161 |
<5 measurements N=83 |
P-value* |
| At baseline | ||||
| Men (%) | 56.6 | 55.9 | 57.8 | 0.77 |
| Age (y) | 36.8±8.4 | 36.9±8.6 | 36.6±8.0 | 0.78 |
| Diabetes duration (y) | 24.1±8.2 | 23.8±8.2 | 24.6±8.4 | 0.45 |
| Age at diagnosis (y) | 12.8±8.0 | 13.2±8.5 | 12.0±7.1 | 0.25 |
| Urinary ACR (mg/g) | 676 (430, 1238) | 682 (434, 1300) | 637 (396, 1156) | 0.45 |
| Hemoglobin A1c (%) | 9.0±1.7 | 9.1±1.6 | 8.9±1.9 | 0.34 |
| Systolic blood pressure (mmHg) | 131±18 | 132±18 | 131±16 | 0.62 |
| Diastolic blood pressure (mmHg) | 78±10 | 78±10 | 79±9 | 0.22 |
| ACE-I or ARB treatment (%) | 66.0 | 65.8 | 66.3 | 0.95 |
| eGFR (ml/min/1.73m2) | 95±19 | 95±19 | 95±19 | 0.97 |
| Body mass index (kg/m2) | 26.7±5.8 | 26.8±6.3 | 26.6±5.6 | 0.86 |
| Total cholesterol (mg/dl) | 212.2±49.0 | 212.6±52.7 | 212.0±47.2 | 0.92 |
| HDL cholesterol (mg/dl) | 55.3±17.4 | 59.1±19.6 | 53.4±15.9 | 0.02 |
| Statin treatment (%) | 17.2 | 19.3 | 16.2 | 0.54 |
| Current smoking (%) | 26.9 | 29.1 | 22.5 | 0.28 |
| During follow-up | ||||
| Length of follow-up (yrs) | 7.4 (5.5, 12.2) | 9.0 (6.1, 13.3) | 6.2 (4.6, 8.9) | --- |
| Creatinine measurements (N) | 7.5 (4, 18) | 13 (8, 22) | 3 (2, 4) | --- |
| Creatinines per year (N) | 1.1 (0.5, 1.9) | 1.6 (1.0, 2.4) | 0.5 (0.3, 0.6) | --- |
| Incidence rate of ESRD† | 2.4 (51) | 2.1 (33) | 3.2 (18) | 0.12 |
| Mortality rate unrelated to ESRD† | 0.8 (18) | 0.7 (12) | 1.1 (6) | 0.47 |
Data are percent, mean±standard deviation or median (25th, 75th percentile).
P-value is for the comparison between patients with <5 measurements and those with ≥5 measurements.
per 100 person years (number of events)
ACR=albumin to creatinine ratio, ACEI=angiotensin converting enzyme inhibitor, ARB=angiotensin receptor blocker
Patterns of Trajectories of Renal Function Changes
The first step in the characterization of the trajectories was to determine whether they were linear or non-linear. For this determination we modified an approach described by Jones and Molitoris (9) and used by Shah and Levey (10) to test for non-linearity of an individual's renal function changes during follow-up. The approach requires a minimum of five observations, so this analysis was limited to the 161 patients with five or more determinations of eGFR. It represents each patient's renal function trajectory as a simple linear model and as a spline model with linear segments connected at an individually determined point. Our modification was to allow more than two segments (three segments were required in 2 patients and 5 segments in one individual). The spline and linear models were compared, and a linear model was rejected at a nominal significance of 0.05 and degrees of freedom determined by the number of spline segments (n-1).
The second step in the characterization of the trajectories was to classify the patient's eGFR as stable or declining during follow-up. Our criterion for this distinction was based on overall slope of eGFR decline. A slope less steep than 3.5 ml/min/1.73m2/year was considered “stable” (Figure 1, A–C), while a steeper slope was considered clinically significant decline (Figure 1, D–F). See Methods for the motivation underlying this criterion.
Figure 1.

Patterns of renal function decline: A, B Linear trajectories, stable renal function; C Stable renal function, clinically inconsequential non-linear trajectory; D and F Linear decliners; E Decliner with clinically inconsequential non-linear trajectory (observed time of ESRD is within 1 year from time of reaching eGFR=10 under linear model); G–I Non-linear decline; G Deceleration; H New-onset decline (acceleration); I Acceleration. Dots represent single eGFR measurements and solid lines represent linear spline function. Dotted line represents linear regression. Vertical dotted lines mark the observed time of ESRD onset.
The third characterization applied only to individuals with significantly non-linear trajectories and was based on the clinical consequences of the deviations from linearity. For individuals with stable renal function, we concluded that the deviations from linearity had no clinical consequence (Figure 1 C). For patients with declining renal function, the non-linearity of a trajectory was considered clinically inconsequential (Figure 1, E) if the estimated time of reaching eGFR = 10 ml/min/1.73m2 (expected time of ESRD) was within one year of the observed time of ESRD (vertical dotted line). If the difference was larger, the non-linearity of the trajectory was considered clinically consequential. These non-linear trajectories were further characterized as decelerating (Figure 1, G) or accelerating (Figure 1, H and I). Typically, acceleration interrupted a period of stable renal function (new-onset decline) as in example H. Example I illustrates a rare pattern, acceleration from one rate of decline to a faster one. Neither acceleration nor deceleration was significantly associated with RAS blockade.
The frequencies of these different patterns are summarized in Table 2. The trajectories of 110 patients (68.3%) were adequately fitted by a simple linear model, 59 stable (36.6 %) and 51 (31.7 %) declining. The trajectories for another 24 (14.9%) were significantly non-linear, but the non-linearity was clinically inconsequential, 16 stable (9.9 %) and 8 declining (5.0 %). Thus, for clinical purposes, a linear model adequately represented the trajectories of a total of 134 patients (83%). The non-linearity of the trajectories for the remaining 27 (17%) patients was clinically consequential, 20 (12.4%) experiencing deceleration and 7 (4.4%) experiencing acceleration.
Table 2.
Distribution of trajectories of eGFR changes according to presence of non-linearity, significant decline, and the direction of slope change for non-linear patterns
| N | Percent | |
|---|---|---|
| A. Linear | 110 | 68.3 |
| Stable (Figure 1, A and B) | 59 | 36.6 |
| Decline* (Figure 1, D and F) | 51 (20)† | 31.7 |
| B. Clinically inconsequential non-linearity | 24 | 14.9 |
| Stable (Figure 1, C) | 16 | 9.9 |
| Decline* (Figure 1, E) | 8 (8)† | 5.0 |
| C. Clinically consequential non-linearity | 27 | 16.8 |
| Deceleration (Figure 1, G) | 20 (2)† | 12.4 |
| Acceleration (Figure 1, H and I) | 7 (3)† | 4.4 |
Criteria for classifying trajectories as non-linear and of clinical consequence are in Methods.
An eGFR decline of 3.5 ml/min/1.73m2/year or more
(Number of individuals reaching ESRD)
Inter-individual Variation in Trajectories of Renal Function Changes
To gain an appreciation of the distribution of the overall rate of eGFR decline in the whole group of 244 subjects, we extracted the linear component of each trajectory as a simple slope (Figure 2). A few individuals had a positive slope, i.e. improved in renal function at the end of follow-up (n=25), but the majority had negative slopes, i.e. declining renal function. The median (25th, 75th percentiles) was −2.9 (−7.1, −1.27) ml/min/1.73m2/year. Reflecting the long tail of negative values, the 5th percentile was −16.8 and the minimum −70.5 ml/min/1.73m2/year. The fastest eGFR decline is shown in Figure 1, F. The available clinical information for this patient did not indicate any other cause of renal function decline than T1D (See Appendix 1 for more details).
Figure 2.
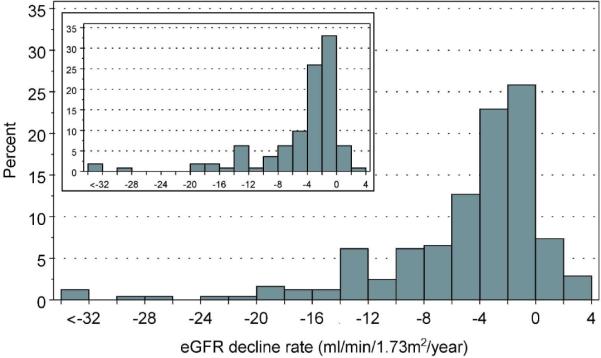
Distribution of slopes of eGFR decline according to 2 ml/min intervals in 244 subjects with proteinuria (large figure). The three patients in the interval <−32 had slopes −52.5, −56.4 and −70.5 ml/min/1.73m2/year. (Inset: the distribution of slopes in the sub-set of 112 patients with linear trajectories of eGFR decline)
Exclusion of the slope estimates for patients with non-linear or unknown trajectories did not materially change the shape of the distribution of slopes (insert in Figure 2) or the median (−2.6 as compared to −2.9 ml/min/1.73m2/year).
Prediction of ESRD risk from the early eGFR slope
The observation that a simple linear model of renal function decline gave satisfactory predictions of renal outcomes for most patients prompted the question whether data obtained during early follow-up provide useful prognostic information. When a T1D patient presents with proteinuria and normal renal function, monitoring of eGFR will generally begin. We sought to examine how well a slope fitted to these early determinations of eGFR predicts the risk of ESRD. To mimic this situation, we restricted the measurements to the first 5 years of follow-up and those made while patients remained in CKD stages 1 or 2 (eGFR ≥60 ml/min/1.73m2). Only 216 patients had at least two serum creatinine measurements for estimating a slope that met these restrictions. The median early slope was −3.8 ml/min/1.73m2/year, and it did not differ significantly from the median slope estimated from complete follow-up (p=0.45). The 25th and 75th percentiles were −8.5 and −1.0, respectively and the steepest early slope was −66.0 ml/min/1.73m2/year, observed in the patient presented in Figure 1F. With Cox proportional hazards models we evaluated this early eGFR slope as a predictor of time to ESRD during subsequent follow-up after the initial period used for estimating the early slope. We compared its performance with that of common clinical risk indicators: albumin to creatinine ratio (ACR), glycated hemoglobin (HbA1c) and systolic blood pressure. The early eGFR slope was strongly associated with time to ESRD (p<0.0001). With a C-index of 0.77 (95% CI: 0.70, 0.84), it was a stronger predictor than traditional risk indicators: ACR, HbA1c and systolic blood pressure, singly or in combination (Table 3).
Table 3.
Associations of the early slope of eGFR decline in CKD stages 1–2 and of known risk factors with the risk of ESRD
| Model | Predictor | Hazard ratio* | P-value | C-index |
|---|---|---|---|---|
| 1 | Slope of early decline | 1.31 (1.18, 1.44) | <0.0001 | 0.77 (0.70, 0.84) |
| 2 | Urinary ACR | 1.30 (1.05, 1.60) | 0.015 | 0.72 (0.64, 0.80) |
| 3 | Hemoglobin A1c | 1.43 (1.18, 1.73) | 0.0003 | 0.69 (0.62, 0.76) |
| 4 | Systolic blood pressure | 1.06 (0.74, 1.54) | 0.69 | 0.51 (0.40, 0.62) |
| 5 | BMI | 0.79 (0.54, 1.15) | 0.22 | 0.53 (0.43, 0.63) |
| 6 | ACE-I or ARB treatment | 0.67 (0.39, 1.17) | 0.16 | 0.59 (0.51, 0.66) |
| 7 | Smoking | 1.55 (0.79, 3.02) | 0.20 | 0.56 (0.48, 0.64) |
| 8 | Model 2+3 | - | - | 0.72 (0.65, 0.79) |
| 9 | Model 8+ slope | - | - | 0.80 (0.73, 0.86) |
ACR: urinary albumin to creatinine ratio
Hemoglobin A1c: glycated hemoglobin A1c
ACE-I: angiotensin converting enzyme inhibition
ARB: angiotensin receptor blocker
HR are expressed for 5 ml/min/1.73m2/year change in slope, 1000 mg/g increase in ACR, 1% increase in HbA1c, 20 mmHg increase in blood pressure and 5-unit increase in BMI. For ACE-I or ARB treatment status, or smoking the effect of “present” vs. “absent” is shown.
Only variables significant in univariate analysis enter models 8 and 9. The strength of prediction of each model, in terms of discrimination, is described by C-index, where a value 0.5 indicates a useless marker and 1.0 is perfect risk discrimination.
Data are point estimate (95% confidence interval).
Prognostic criteria for early eGFR slope
To determine simple criteria suitable for assigning an ESRD risk to values of the early eGFR slope, we searched the range of early eGFR slopes for cut-points (thresholds) that produced the maximum separation of the risk of ESRD for two resulting groups, measured by the chi-square for a log-rank test. For this analysis the time to ESRD was measured from the last observation used to estimate the early eGFR slope. A cut-point of −11 ml/min/1.73m2/year produced the largest separation, cumulative risk of 50.2% for those with steeper eGFR declines and 7.0% for those with shallower declines (Figure 3). As a screening test to diagnose patients who would reach ESRD within five years, its sensitivity was 65% and specificity 90%. Repeat application of this procedure to the range of slopes less steep then the cut-point of −11 ml/min/1.73m2/year yielded a second cut-point of −6.5 ml/min/1.73m2/year. The cumulative risk at five years for the middle range (−11 to −6.5 ml/min/1.73m2/year) was 18.4% and was only 3.6% for the shallowest slopes (Figure 3). Viewed as a screening test to distinguish patients who will remain free of ESRD for five years, this cut-point has a sensitivity of 75% and a specificity of 84%.
Figure 3.

Cumulative incidence of ESRD according to various cut-points of slopes of early eGFR decline in ml/min/1.73m2/year. Cumulative incidence of ESRD is presented according to years of follow-up after the last measurement used to estimate early eGFR slope.
DISCUSSION
In this study of patients with proteinuria due to T1D, we determined the trajectory of each individual's change in eGFR from its initially normal value for up to 18 years. We found that the majority of these trajectories are well represented by a simple regression line. Renal function was stable throughout follow-up in approximately a third of the patients, suggesting that their lifetime risk of ESRD is very low. In the remaining two thirds of the patients, renal function declined significantly, but at rates that vary widely among individuals. Observed times to onset of ESRD ranged from 1.3 to 17.3 years. These results invite consideration of both the nature of the determinants of the variation among individuals in the rate of eGFR decline and the feasibility of developing means of predicting time to ESRD in patients with T1D and proteinuria.
These findings in patients with T1D and proteinuria can be considered an extension of our previous study of renal function loss in T1D patients with a milder abnormality of urinary albumin excretion, microalbuminuria (11–13). In that 4–12 year follow-up study, we used serial measurements of serum cystatin C to examine the trajectories of eGFR changes. Significant renal function loss developed in one out of three patients. Initially, renal function was either normal or even elevated, and then began to decline at the onset of microalbuminuria. The rate of loss was highly variable among individuals yet remained constant within individuals (11). In the present study of T1D patients with normal renal function and proteinuria, significant renal function loss occurred in two out of three patients during the 5–18 year of follow-up. As in the previous study, the rate of loss was highly variable among individuals yet remained constant within individuals.
The mechanisms that initiate renal function decline in patients while function is still normal are unknown. Also uncertain is whether those initial mechanisms remain in operation as renal function decline progresses through advanced CKD stages. The “final common pathway” hypothesis posits two phases of renal function decline (14, 15). Regardless of the nature of the initial injury, a shift in pathology occurs at a certain point that is self-propelling and possibly accelerating. As noted above, however, the majority of patients experiencing eGFR decline in this study maintained a constant rate of loss as they passed from CKD stages 1 and 2 (early eGFR decline) through stages 3 and 4 (late eGFR decline).
A few hypotheses can be offered to explain an overall pattern that includes a constant rate of decline within individuals and large variability of that rate among individuals. First, the process underlying loss must be fully developed when it is initiated and usually does not evolve over time. Although its initiation is likely triggered by environmental factors, the constant rate of decline is most likely the effect of constitutional susceptibilities such as genetic factors. If the latter is true, multiple genes and probably multiple variants within genes are likely required to account for the large differences among individuals in the rate of eGFR decline (Figure 2). Dissection of the genetic architecture of diabetic nephropathy will best be achieved by studies of the rate of eGFR as a quantitative phenotype rather than by case control studies.
The patients with T1D and proteinuria in the present study had earlier been members of the population of T1D patients with microalbuminuria. They comprise two major subpopulations: 1) those in whom early renal function decline was already present when they entered this study population, and 2) those whose renal function remained normal and stable as albumin excretion progressed to proteinuria. The subpopulation with stable renal function is much larger than generally perceived, and this finding must be conveyed to physicians so they can advise patients more appropriately that not all patients with proteinuria are at high risk of ESRD. Diagnostic tools (serum or urinary biomarkers or DNA sequence variants) that distinguish patients with declining renal function from those with stable function are highly desirable. Until such tools become available, we propose that serum creatinine be measured frequently in T1D patients with proteinuria. These measurements can be used to estimate the early eGFR slope, which appears to be a stronger predictor of the risk of ESRD than other clinically available characteristics.
Whether estimates of the slope of early eGFR decline can be clinically useful for predicting the precise time for initiating renal replacement therapy well in advance remains to be evaluated. In the meantime, however, it can be used to stratify subjects according to ESRD risk and urgency for intervention. Clinical trials of progressively more invasive or drastic therapies to prevent or postpone ESRD become feasible if such patients can be selected that their risk of ESRD outweighs the associated discomfort and complications.
We used eGFR determinations made before CKD stage 3 was reached out to a maximum of five years of follow-up. The actual follow-up time used to estimate the slope was shorter than five years for fast decliners who reached CKD stage 3 early. With denser and more equally spaced eGFR determinations, it is potentially possible to improve the predictive performance of the early eGFR slope or reduce the observation time required to obtain a satisfactory estimate of the slope. This issue requires prospective investigation with an appropriate study design.
Another potential application of the slope of early eGFR decline would be its development and validation as a surrogate outcome measure. Currently, evaluations of novel therapies to prevent ESRD focus on individuals with significantly impaired renal function. Quite likely, trial interventions that retard the rate of renal function decline will be less effective in patients with already impaired renal function than in those at earlier disease stage. Thus, the slope of early eGFR changes deserves evaluation as a candidate for ESRD surrogate marker.
Most of the literature on trajectories of eGFR leading to ESRD has focused on small groups of decliners, predominantly non-diabetic, who already had significantly impaired renal function. The slope of renal function decline was constant in the majority of studies (4–8, 16), suggesting the feasibility of predicting of ESRD onset from serial renal function estimates from early stages of CKD. Some authors questioned this conclusion (10, 17) but also noted that, for the majority of subjects, predicted times to ESRD from linear and non-linear models differed by less than a year (10).
We studied patients with normal renal function and fitted linear and spline models to their trajectories of eGFR changes (9, 10). Our conclusion of the predominance of linear eGFR trajectories is robust given our relatively non-stringent statistical criteria for rejecting linearity. Instead of greater stringency, we supplemented statistical criteria with criteria based on the clinical consequences of discrepancies between linear and non-linear models.
Although our study has many strengths, we acknowledge real and perceived limitations. First, the prevalence of treatment with ACE-I and/or ARB at enrolment was lower than currently prescribed. This was because ascertainment of the cohort started in the early 1990s when the use of ACE-I was just coming into vogue. The prevalence of ACE-I and ARB treatment increased from 56% in 1991–1995 to 82% in 2001–2004. Noteworthy is the observation that despite this increase in use of RAS blockade, the risk of ESRD was unchanged and remains high (1). Moreover, RAS blockade was not associated with the slope of renal function decline or the probability of deceleration of decline. It has been suggested that the RAS blockade, although has proven efficacy in a number of trials, may not be sufficiently effective in a clinical setting (18).
Second, we recruited proteinuria cases with normal renal function. Since this group included prevalent as well as incident cases of proteinuria, and non-decliners accumulate among prevalent cases, the proportion of non-decliners is higher than would be found if all patients were incident cases. Furthermore, our study included only patients with proteinuria due to diabetes. It is not clear that the findings would be the same in patients without diabetes. Finally, we did not have direct measurements of GFR in our study. However, direct methods of measuring GFR have their own limitations. For example, as clearly demonstrated in Pima Indians (19), iothalamate clearance is affected by enormous intra-day variations within an individual, a characteristic that limits the value of direct determinations of GFR in estimating the slope of renal function decline.
In summary, the predominantly constant rate of eGFR loss observed in this study through all stages of CKD suggests that this process is, to a large extent, predictable and that the risk of ESRD, can be reasonably well inferred from the early slopes of eGFR changes over a 5-year period of observation. Early eGFR slopes calculated under the linearity assumption carry sufficient information for reliable risk stratification. Further research on the determinants and mechanisms of early renal function decline in patients with T1D and proteinuria is necessary to develop new therapies to reduce the risk of ESRD (1).
METHODS
Population
Patients in this study are members of the Joslin Proteinuria Cohort (n=423). Informed consent procedures and protocols for patient examinations at study entry and during follow-up were approved by the Joslin IRB, as were methods for ascertaining all cases of ESRD or death during 5–18 years follow-up. Details of these methods and description of the natural history of the development of ESRD in this cohort have been published (1).
Assessment of proteinuria
The diagnoses of proteinuria were made in random urines by determinations of the urinary albumin to creatinine ratio (ACR) or meter readings of Multistix test strips (Ames, Miles Laboratories, Elkhart, IN, USA). Proteinuria is diagnosed if the ACR (in mg/g) is ≥250 in men or ≥355 in women or the Multistix reading is ≥2+ (corresponding to albumin concentration ≈1000 μg/ml) in two out of three consecutive urine samples. A higher ACR is required for women due to their lower creatinine concentrations. When calibrated to timed measurements of albumin excretion, these sex-specific ACR criteria are equivalent to an albumin excretion rate (AER) of 300 μg/min (20).
Albumin was measured by immunonephelometry on a BN100 with N Albumin kits (Behring, Somerville, NJ, USA), with intra-assay and inter-assay coefficients of variation <3% and 5%, respectively. Creatinine measurements were assayed by Jaffe's modified picrate method on a Ciba Corning Express Plus Chemistry Analyzer (inter and intra-assay coefficients of variation 2.3% and 3.5%, respectively). Separate from the determinations used for the diagnosis of proteinuria, the urinary ACR was determined in a sample obtained at the baseline examination of all patients.
Assessment of renal function
We used serum creatinine concentration and the CKD-EPI formula (21) to estimate renal function (eGFR) at study entry and during follow-up. In 2009, serum creatinine was measured in all 1,379 stored study samples (423 from baseline and 956 from follow-up examinations) at the University of Minnesota using the Roche enzymatic assay (Prod No. 11775685) on a Roche/Hitache Mod P analyzer. This method is calibrated to be traceable to an isotope dilution mass spectrometry (IDMS) reference assay and was verified by measuring National Institutes of Standards and Technology Standard Reference Material (NIST SRM) No. 967.
We retrieved 4,567 measurements of serum creatinine performed in the 423 patients during routine clinic visits from the Joslin Clinical Laboratory records. These measurements were assayed by Jaffe's modified picrate method on a Ciba Corning Express Plus Chemistry Analyzer (inter and intra-assay coefficients of variation 2.3% and 3.5%, respectively). For 1133 (24.8%) samples, the clinical measurement was made on the same blood draw as the measurement at the University of Minnesota because the routine visit coincided with a study examination. We used these duplicate measurements to calibrate the clinical measurements to the assay method of the reference laboratory.
Onset of ESRD was determined by matching the study roster against the United States Renal Data System (USRDS) and recorded as the date of first renal transplant or renal dialysis, as described previously (1).
Study Group
To characterize the complete trajectories of eGFR decline from normal to ESRD, we restricted this study to the 244 patients in the Joslin Proteinuria Cohort whose renal function was normal at study entry (eGFR ≥ 60 ml/min/1.73m2). For these participants, 2955 follow-up measurements of serum creatinine (calibrated to the reference laboratory) were available to trace the course of eGFR over time.
Trajectories of eGFR Decline During Follow-up
We followed an approach described by Jones and Molitoris (9) and used by Shah and Levey (10) to model an individual's serial estimates of renal function. A minimum of five observations is required (9), so only 161 (66.0%) of our study group and their 2723 eGFR determinations were used. The approach represents each patient's renal function trajectory as a simple linear model and as a spline model with linear segments connected at a point determined by a search for minimum residual sum of squaes. Our modification was to allow more than two segments (three segments were required in 2 patients and 5 segments in one individual). The spline and linear models were compared and a linear model was rejected at a nominal significance of 0.05 and degrees of freedom determined by the number of spline segments (n-1).
Selection of a cut-point to distinguish stable from declining trajectories was necessarily somewhat arbitrary. Practical considerations support a decline of 3.5 ml/min/1.73m2 as a reasonable choice. For an individual with this rate of decline and a beginning eGFR of 95 ml/min/1.73m2 (the mean in our study group), ten years would be required to reach CKD stage 3 and 25 years to reach ESRD. This choice also has some empirical support. Studies in the general population reported mean slopes of renal function decline between −0.5 and −2.5 ml/min/1.73m2 per year (22–27). We assumed a mean age-related decline of −1.0 ml/min/1.73m2/year as other authors have (28, 29) and a standard deviation of 2.0, as extracted from published reports (22–27). If the distribution is normal, the 10th percentile of distribution of eGFR slopes would be −3.5 ml/min/1.73m2/year.
All individuals with stable renal function were considered well characterized by a linear model of renal function changes, since deviations from linearity in overall non-declining trajectory are of little clinical consequence. In decliners we considered over 1-year difference between observed time of ESRD and time of reaching eGFR = 10 ml/min/1.73m2 (expected time of ESRD) under linear model as clinically consequential.
Inter-individual Variation in Slope of eGFR Decline
To estimate and describe inter-individual variation in the slope of eGFR decline, we extracted the linear component of every subject's trajectory in the complete cohort of 244 individuals, including the 83 with less than five measurements. The onset of ESRD was typically not accompanied by a measurement of serum creatinine in the Joslin Clinic laboratory. Therefore, we assumed the eGFR was 10 ml/min/1.73m2 at that time.
Prediction of ESRD from the Early Slope of eGFR Decline
When a patient presents clinically with T1D, normal renal function and proteinuria, the eGFR is monitored. After five years, the early slope of eGFR values can be determined. To mimic this situation, we estimated early slope during the first five years of follow-up while patients remained in CKD stages 1 or 2 (eGFR ≥60 ml/min/1.73m2) and investigated its potential as a predictor of progression to ESRD from that point during subsequent follow-up. The analysis was restricted to patients with at least two serum creatinine measurements (n=216) before reaching their fifth enrollment anniversary or CKD stage 3. We compared its performance as a predictor with that of common clinical risk indicators: albumin to creatinine ratio (ACR), glycated hemoglobin (HbA1c) and systolic blood pressure in Cox proportional hazards models using the C-index, a generalized discrimination index for survival data, as defined by Harrell (30).
Statistical Methods
Statistical significance was set at a P-value less than 0.05. Analyses were conducted in SAS for Windows, version 9.2 (SAS Institute, Cary, NC). Characteristics of patients were summarized by percentages, means and standard deviations or medians and quartiles. The linear component of renal function trajectories was estimated with linear regression, and linear spline models were fitted with least squares method, as proposed by Jones and Molitoris (7) and extended to allow for multiple knots. The cumulative risk of ESRD was estimated by the Kaplan-Meier method. Predictive performance of early eGFR slope and clinical markers was evaluated with C-index (30) in simple and multiple Cox proportional hazards models. We then searched the range of early slopes of eGFR decline for cut-points (thresholds) that produced the maximum chi-square (log-rank test) for the separation between survival curves for the two resulting groups, as proposed by Contal and O'Quigley (31).
Acknowledgments
This project was supported through JDRF research grant 1-2008-1018 (ASK) and NIH grant DK41526 (ASK) and a JDRF fellowship grant 3-2009-397 (JS). We thank Drs. T.H. Hostetter and W.E. Mitch for their valuable comments.
Funding sources: JDRF research grant 1-2008-1018 (ASK) and NIH grant DK41526 (ASK) and a JDRF fellowship grant 3-2009-397 (JS).
Appendix 1
The individual with the most rapid renal function decline was a 25-year old woman with 15-year history of diabetes. At the time of study entry her eGFR was 89.4 ml/min/1.73m2, ACR was 766 mg/g and HbA1c 8.5%. She was normotensive (116/78 mmHg) and did not take ACE-I or ARB. Decline of her renal function could be tracked five months before enrollment, when her eGFR was 128 ml/min/1.73m2 and 108 ml/min/1.73m2 four months later. She progressed to ESRD within 15 months, during which time her glycemic and blood pressure control deteriorated (HbA1c in the range 9–11%, blood pressure 140–150/90–100). Within a month after study entry, her urinary protein level increased rapidly to 2.2 g/24h. Four months into follow-up, the patient became pregnant and subsequently terminated. This episode took place after the onset of renal function decline and did not change the slope (Figure 1 F). The urinalyses in her record were unremarkable (no apparently active sediments). Kidney biopsy was not available. Thus, one certainly cannot definitively rule out another kidney disease, but it is likely that diabetes was a major cause of her decline in GFR.
References
- 1.Rosolowsky ET, Skupien J, Smiles AM, et al. Risk for ESRD in Type 1 Diabetes Remains High Despite Renoprotection. J Am Soc Nephrol. 2011;22:545–553. doi: 10.1681/ASN.2010040354. [DOI] [PMC free article] [PubMed] [Google Scholar]
- 2.Forsblom C, Harjutsalo V, Thorn, et al. on behalf of the FinnDiane Study Group Poor prognosis in patients with type 1 diabetes and macroalbuminuria: a competing risk analysis. J Am Soc Nephrol. 2011;22:537–544. doi: 10.1681/ASN.2010020194. [DOI] [PMC free article] [PubMed] [Google Scholar]
- 3.Kelly KJ, Dominguez JH. Rapid progression of diabetic nephropathy is linked to inflammation and episodes of acute renal failure. Am J Nephrol. 2010;32:469–475. doi: 10.1159/000320749. [DOI] [PubMed] [Google Scholar]
- 4.Mitch WE, Walser M, Buffington GA, et al. A Simple Method of Estimating Progression of Chronic Renal Failure. Lancet. 1976;2:1326–1328. doi: 10.1016/s0140-6736(76)91974-7. [DOI] [PubMed] [Google Scholar]
- 5.Jones RH, Hayakawa H, Mackay JD, Parsons V, Watkins PJ. Progression of diabetic nephropathy. Lancet. 1979;1:1105–1106. doi: 10.1016/s0140-6736(79)91788-4. [DOI] [PubMed] [Google Scholar]
- 6.Mogensen CE. Progression of nephropathy in long-term diabetics with proteinuria and effect of initial anti-hypertensive treatment. Scand J Clin Lab Invest. 1976;36:383–388. doi: 10.1080/00365517609055274. [DOI] [PubMed] [Google Scholar]
- 7.Parving HH, Smidt UM, Friisberg B, et al. A prospective study of glomerular filtration rate and arterial blood pressure in insulin-dependent diabetics with diabetic nephropathy. Diabetologia. 1981;20:457–461. doi: 10.1007/BF00253407. [DOI] [PubMed] [Google Scholar]
- 8.Viberti GC, Bilous RW, Mackintosh D, et al. Monitoring glomerular function in diabetic nephropathy. A prospective study. Am J Med. 1983;74:256–264. doi: 10.1016/0002-9343(83)90624-1. [DOI] [PubMed] [Google Scholar]
- 9.Jones RH, Molitoris BA. A statistical method for determining the breakpoint of two lines. Anal Biochem. 1984;141:287–290. doi: 10.1016/0003-2697(84)90458-5. [DOI] [PubMed] [Google Scholar]
- 10.Shah BV, Levey AS. Spontaneous changes in the rate of decline in reciprocal serum creatinine: errors in predicting the progression of renal disease from extrapolation of the slope. J Am Soc Nephrol. 1992;2:1186–1191. doi: 10.1681/ASN.V271186. [DOI] [PubMed] [Google Scholar]
- 11.Perkins BA, Ficociello LH, Ostrander BE, et al. Microalbuminuria and the risk for early progressive renal function decline in type 1 diabetes. J Am Soc Nephrol. 2007;18:1353–1361. doi: 10.1681/ASN.2006080872. [DOI] [PubMed] [Google Scholar]
- 12.Perkins BA, Krolewski AS. Early nephropathy in type 1 diabetes: the importance of early renal function decline. Curr Opin Nephrol Hypertens. 2009;18:233–240. doi: 10.1097/MNH.0b013e3283293db1. [DOI] [PMC free article] [PubMed] [Google Scholar]
- 13.Perkins BA, Ficociello LH, Roshan B, et al. In patients with type 1 diabetes and new-onset microalbuminuria the development of advanced chronic kidney disease may not require progression to proteinuria. Kidney Int. 2010;77:57–64. doi: 10.1038/ki.2009.399. [DOI] [PMC free article] [PubMed] [Google Scholar]
- 14.Hostetter TH, Rennke HG, Brenner BM. Compensatory renal hemodynamic injury: a final common pathway of residual nephron destruction. Am J Kidney Dis. 1982;1:310–314. doi: 10.1016/s0272-6386(82)80032-2. [DOI] [PubMed] [Google Scholar]
- 15.Burns WC, Kantharidis P, Thomas MC. The role of tubular epithelial-mesenchymal transition in progressive kidney disease. Cells Tissues Organs. 2007;185:222–231. doi: 10.1159/000101323. [DOI] [PubMed] [Google Scholar]
- 16.Rutherford WE, Blondin J, Miller JP, et al. Chronic progressive renal disease: rate of change of serum creatinine concentration. Kidney Int. 1977;11:62–70. doi: 10.1038/ki.1977.8. [DOI] [PubMed] [Google Scholar]
- 17.Oksa H, Pasternack A, Luomala M, et al. Progression of chronic renal failure. Nephron. 1983;35:31–34. doi: 10.1159/000183041. [DOI] [PubMed] [Google Scholar]
- 18.Nelson RG. Is Treatment of Nephropathy in Type 1 Diabetes Efficacious but Ineffective? JASN. 2011;22:402–404. doi: 10.1681/ASN.2011010076. [DOI] [PubMed] [Google Scholar]
- 19.Lemley KV, Boothroyd DB, Blouch KL, et al. Modeling GFR trajectories in diabetic nephropathy. Am J Physiol Renal Physiol. 2005;289:F863–F870. doi: 10.1152/ajprenal.00068.2004. [DOI] [PubMed] [Google Scholar]
- 20.Warram JH, Gearin G, Laffel L, et al. Effect of duration of type I diabetes on the prevalence of stages of diabetic nephropathy defined by urinary albumin/creatinine ratio. J Am Soc Nephrol. 1996;7:930–937. doi: 10.1681/ASN.V76930. [DOI] [PubMed] [Google Scholar]
- 21.Levey AS, Stevens LA, Schmid CH, et al. CKD-EPI (Chronic Kidney Disease Epidemiology Collaboration): A new equation to estimate glomerular filtration rate. Ann Intern Med. 2009;150:604–612. doi: 10.7326/0003-4819-150-9-200905050-00006. [DOI] [PMC free article] [PubMed] [Google Scholar]
- 22.Rowe JW, Andres R, Tobin JD, et al. The effect of age on creatinine clearance in men: a cross-sectional and longitudinal study. J Gerontol. 1976;31:155–163. doi: 10.1093/geronj/31.2.155. [DOI] [PubMed] [Google Scholar]
- 23.Lindeman RD, Tobin J, Shock NW. Longitudinal studies on the rate of decline in renal function with age. J Am Geriatr Soc. 1985;33:278–285. doi: 10.1111/j.1532-5415.1985.tb07117.x. [DOI] [PubMed] [Google Scholar]
- 24.Danziger RS, Tobin JD, Becker LC, et al. The age-associated decline in glomerular filtration in healthy normotensive volunteers. Lack of relationship to cardiovascular performance. J Am Geriatr Soc. 1990;38:1127–1132. doi: 10.1111/j.1532-5415.1990.tb01376.x. [DOI] [PubMed] [Google Scholar]
- 25.Ishida K, Ishida H, Narita M, et al. Factors affecting renal function in 119 985 adults over three years. QJM. 2001;94:541–550. doi: 10.1093/qjmed/94.10.541. [DOI] [PubMed] [Google Scholar]
- 26.Hemmelgarn BR, Zhang J, Manns BJ, et al. Progression of kidney dysfunction in the community-dwelling elderly. Kidney Int. 2006;69:2155–2161. doi: 10.1038/sj.ki.5000270. [DOI] [PubMed] [Google Scholar]
- 27.Sesso R, Prado F, Vicioso B, et al. Prospective study of progression of kidney dysfunction in community-dwelling older adults. Nephrology (Carlton) 2008;13:99–103. doi: 10.1111/j.1440-1797.2008.00919.x. [DOI] [PubMed] [Google Scholar]
- 28.Rifkin DE, Shlipak MG, Katz R, et al. Rapid kidney function decline and mortality risk in older adults. Arch Intern Med. 2008;168:2212–2218. doi: 10.1001/archinte.168.20.2212. [DOI] [PMC free article] [PubMed] [Google Scholar]
- 29.Shlipak MG, Katz R, Kestenbaum B, et al. Rate of kidney function decline in older adults: a comparison using creatinine and cystatin C. Am J Nephrol. 2009;30:171–178. doi: 10.1159/000212381. [DOI] [PMC free article] [PubMed] [Google Scholar]
- 30.Harrell FE, Jr, Lee KL, Mark DB. Multivariable prognostic models: issues in developing models, evaluating assumptions and adequacy, and measuring and reducing errors. Stat Med. 1996;15:361–387. doi: 10.1002/(SICI)1097-0258(19960229)15:4<361::AID-SIM168>3.0.CO;2-4. [DOI] [PubMed] [Google Scholar]
- 31.Contal C, O'Quigley J. An application of changepoint methods in studying the effect of age on survival in breast cancer. Comput Stat Data Anal. 1999;30:253–270. [Google Scholar]