

Abstract
BACKGROUND AND PURPOSE:
VBM has been widely used to study GM atrophy in MS. MS lesions lead to segmentation and registration errors that may affect the reliability of VBM results. Improved segmentation and registration have been demonstrated by WM LI before segmentation. DARTEL appears to improve registration versus the USM. Our aim was to compare the performance of VBM-DARTEL versus VBM-USM and the effect of LI in the regional analysis of GM atrophy in MS.
MATERIALS AND METHODS:
3T T1 MR imaging scans were acquired from 26 patients with RRMS and 28 age-matched NC. LI replaced WM lesions with normal-appearing WM intensities before image segmentation. VBM analysis was performed in SPM8 by using DARTEL and USM with and without LI, allowing the comparison of 4 VBM methods (DARTEL + LI, DARTEL − LI, USM + LI, and USM − LI). Accuracy of VBM was assessed by using NMI, CC, and a simulation analysis.
RESULTS:
Overall, DARTEL + LI yielded the most accurate GM maps among the 4 methods (highest NMI and CC, P < .001). DARTEL + LI showed significant GM loss in the bilateral thalami and caudate nuclei in patients with RRMS versus NC. The other 3 methods overestimated the number of regions of GM loss in RRMS versus NC. LI improved the accuracy of both VBM methods. Simulated data suggested the accuracy of the results provided from patient MR imaging analysis.
CONCLUSIONS:
We introduce a pipeline that shows promise in limiting segmentation and registration errors in VBM analysis in MS.
GM atrophy is a well-established and clinically relevant component of MS pathology.1 It occurs early in the disease process, and most likely reflects irreversible tissue loss. Measures of cerebral atrophy have been proposed as sensitive and reliable longitudinal surrogates of disease severity and neuroprotective therapeutic effects.1 GM atrophy shows particular potential due to its proposed more sensitive role in measuring destructive effects compared with whole-brain or WM atrophy measures.1
Various advanced MR imaging postprocessing techniques have been developed that are particularly useful in assessing the pattern of GM loss. One such technique, VBM,2 is an automated tool used to assess the topography of GM atrophy. VBM performs voxelwise statistical analysis on smoothed normalized segmented brain MR images, revealing localized volume differences among subject groups.2 Prior VBM studies1,3,4 have identified regional GM atrophy in MS; however, there is a known set of technical challenges that may have limited these results, including segmentation and registration errors.5–10 One of the major sources of error in MS is the presence of WM lesions, leading to misclassification of WM tissue as GM and errors in alignment. While improved segmentation and registration of MS brains have been demonstrated by WM LI before segmentation,11–13 the effect of lesions on the reliability of VBM results has not been systematically studied.
Recent studies have suggested various ways to optimize VBM procedures,6–10,14–16 including the use of DARTEL,17 which has shown better registration and anatomic precision versus other registration approaches in the SPM software, including the USM18 and other available intersubject registration algorithms.19–23 DARTEL is just beginning to be applied to VBM studies in MS.4 No studies to date have systematically tested the reliability and accuracy of VBM of high-resolution 3T images in MS related to the combined consideration of registration improvements and addressing lesion-related errors.
Our goal was to compare the accuracy of VBM-DARTEL versus VBM-USM and the effect of LI on each method in the analysis of regional cerebral GM atrophy in MS. To validate our findings, we also provided a measure of ground truth by using simulated data.
Materials and Methods
Subjects
Demographic and clinical characteristics of the subjects are summarized in Table 1. We identified 26 patients with MS with the following criteria: 1) age, 18–55 years; 2) availability of neurologic examination, including the EDSS24 scoring; 3) diagnosis of RRMS25; 4) no other major medical disorder; and 5) no relapse or corticosteroid use in the 4 weeks before study entry to avoid transient confounding effects on MR imaging. Twenty four of the patients (92%) were receiving disease-modifying treatment at the time of the scanning. Ten patients were receiving monotherapy with β-interferon 1a, 1 with β-interferon 1b, 12 with glatiramer acetate, and 1 with β-interferon 1a in combination with mycophenolate mofetil. Twenty-eight NC with a distribution of age and sex similar to that of the patients with MS and no known neurologic or major medical disorders were also included. This study was approved by our institutional review board, and all subjects gave informed consent.
Table 1:
Demographics, conventional MR imaging and clinical findings of all subjectsa
| NC | RRMS | |
|---|---|---|
| No. of subjects | 28 | 26 |
| Men/womenb | 7:21 | 6:20 |
| Age (yr)b | 43.0 ± 7.1 | 39.2 ± 9.4 |
| Disease duration (yr) | – | 8.5 ± 5.9 |
| EDSS score | – | 1.2 ± 0.9 |
| FLAIR cerebral lesion volume (mL) | – | 15.0 ± 14.7 |
| T1 hypointense cerebral lesion volume (mL) | – | 7.7 ± 9.6 |
| Number of T1 hypointense cerebral lesions | – | 57.0 ± 57.6 |
| Intracranial volume | 1380.6 ± 124.1 | 1414.6 ± 139.6 |
Note:— – indicates not applicable.
Values are mean ± SD.
No significant group differences when comparing NC and patients with RRMS.
MR Imaging Acquisition
All subjects underwent 3T brain MR imaging (Signa; GE Healthcare, Milwaukee, Wisconsin) by using the same scanning protocol. MR imaging was performed by using a head-only phased array coil. Brain imaging included the following:
Axial FLAIR: TR = 9000 ms, TE = 151 ms, TI = 2250 ms, section thickness = 2 mm (70 sections, no gap), matrix size = 256 × 256, pixel size = 0.976 × 0.976 mm, number of signal averages = 1, acquisition time = 9 minutes.
Coronal 3D MDEFT9,26: TR = 7.9 ms, TE = 3.14 ms, flip angle = 15°, section thickness = 1.6 mm (124 sections, no gap), matrix size = 256 × 256, pixel size = 0.938 × 0.938 mm, number of signal averages = 1, acquisition time = 7.5 minutes. These sequence parameters were optimized as described in Deichmann et al.26 We used this sequence for its superiority versus other T1-weighted sequences (magnetization-prepared rapid acquisition of gradient echo and fast low-angle shot) for VBM studies.9
MR Imaging Analysis
Brain MR imaging analysis was performed by using the Jim (Version 5, http://www.xinapse.com) and the SPM (Version 8, http://www.fil.ion.ucl.ac.uk/spm) software packages.
FLAIR and T1 Hypointense Lesion Segmentation.
MS FLAIR hyperintense and MDEFT hypointense cerebral lesions were segmented by using a semiautomated edge-finding tool based on local thresholding with manual corrections applied as needed in Jim5.27,28 The presence of T1 hypointense lesions on MDEFT images was determined by consensus of 2 trained observers as part of a reading panel and was used to determine the T1 hypointense lesion number. FLAIR and T1 hypointense lesion volumes were obtained as described previously.27,28 The T1 hypointense lesion volume measurement showed mean intraobserver and interobserver coefficients of variation of 0.93% and 2.45%, respectively (n = 3 patients with MS).
Skull Stripping.
Studies have shown that VBM can be improved by deskulling T1-weighted images before entry into the VBM pipeline.6–8 Thus, T1-weighted MDEFT images were manually deskulled before VBM analysis. The intracranial volume was calculated from deskulled MDEFT images.
White Matter Lesion In-Painting.
Hypointense cerebral WM lesions in each MDEFT image were in-painted with a distribution of signal-intensity values equivalent to those in normal-appearing WM in the image.12 The normal-appearing WM mean signal intensity was estimated by fitting a 4-Gaussian model to the whole-brain histogram of a bias-field-corrected image, after brain extraction and the masking of WM lesions. Normal-appearing WM signal intensities for in-painting were randomly generated from a Gaussian distribution on the basis of the normal-appearing WM peak location and full width at half maximum. These were used to replace voxels within the hypointense WM lesion mask. To maintain a consistent appearance with normal-appearing WM, in-painted voxels were spatially smoothed with a 0.6-mm Gaussian smoothing kernel and scaled to maintain the same SD. The bias field obtained earlier was applied to the in-painted values to match spatial variation in WM intensity to the original image.12
VBM Analysis.
VBM analysis was performed in SPM8 by using DARTEL and USM with (+) and without (−) LI, allowing the comparison of 4 VBM methods (DARTEL + LI, DARTEL − LI, USM + LI, and USM −LI) as described below.
1) VBM-USM: Deskulled MDEFT images with and without LI were aligned to a template image in Montreal Neurological Institute space, segmented, normalized, and modulated by using the USM,18 which accounted for image-intensity nonuniformity, with default settings and template. Spatially modulated, normalized, and segmented GM images were then smoothed with a 8-mm full width at half maximum isotropic Gaussian kernel.
2) VBM-DARTEL: Deskulled MDEFT images with and without LI were aligned to a template image in Montreal Neurological Institute space and segmented by using the USM method.18 Next, DARTEL, implemented as a toolbox for SPM8, was used to derive a set of group-specific templates following the method given in the SPM8 manual in its standard version. After warping the segmented images to the group-specific final templates, these images were modulated by using the Jacobian determinants from the nonlinear deformation.17 VBM-DARTEL outputs were evaluated in their own template space, to avoid the negative effect of resampling interpolation to Montreal Neurological Institute space. Spatially modulated, normalized, and segmented GM images were then smoothed with an 8-mm full width at half maximum isotropic Gaussian kernel.
Assessment of Intersubject Alignment.
To assess the best registration condition, differences in the similarity measures, NMI,22 and CC29 were evaluated. We created average GM templates (smoothed at 8-mm full width at half maximum) for each of the 4 registration conditions from the individual unmodulated warped GM segmented images. NMI and CC were calculated between the individual warped GM segmented images and the corresponding average GM template for each condition. We assessed differences in GM alignment between DARTEL + LI and DARTEL − LI and then between USM + LI and USM − LI. Additionally, we also tested the differences between DARTEL + LI and USM + LI and between DARTEL − LI and USM − LI.
Simulated Data Analysis.
To test the validity of our results, we assessed VBM methods on ground truth data. We obtained 16 normal brain 3D T1-weighted images (TR/TE = 22/9.2 ms, flip angle = 30°, and 1-mm isotropic voxel size) from a public dataset (BrainWeb, http://www.bic.mni.mcgill.ca/brainweb). We simulated atrophy in these images by using an automated algorithm.30 In short, the algorithm creates volume loss in a spheric region of interest centered on a specified point. To emulate the GM loss seen in our MS cohort, we created artificial atrophy centered in 2 deep GM regions: the right thalamus and the left caudate. The radius of the region of atrophy was 10 mm in the right thalamus and 5 mm in the left caudate. So that the ground truth data replicated the MS state, we also created MS lesions in these images by using an artificial lesion-generation method.12 We generated 2 image sets from the original T1 dataset (which served as controls): 1) original T1-weighted images with simulated atrophy, and 2) original T1-weighted images with simulated atrophy and artificial lesions. Before the VBM analysis with DARTEL and USM, these images were deskulled and reoriented to the Montreal Neurological Institute space as described above in the section on skull-stripping and VBM analysis.
Group comparisons were performed between the original T1-weighted images and 1) original T1-weighted images with simulated atrophy, and 2) original T1-weighted images with simulated atrophy and artificial lesions. We calculated the number of true-positives, FPs, true-negatives, and false-negatives, to determine the specificity [true-negatives/(true-negatives + FP)] and sensitivity [true-positives/(true-positives + false-negatives)] of DARTEL and USM to subcortical atrophy. We used an atlas-based approach (WFU_PickAtlas: http://fmri.wfubmc.edu/software/PickAtlas), where we divided the brain GM into 92 regions and counted the number of GM regions in which atrophy was seen for all VBM approaches. True-positive areas were defined as the areas of significant GM atrophy in the specified regions under the ground truth (ie, the thalamus and caudate). All VBM approaches were able to identify the specified areas under the ground truth. True-negative areas were defined as those in which there was no significant GM atrophy seen. FP areas were defined as those in which significant GM atrophy was seen outside the specified regions under the ground truth. False-negative areas were not observed because all VBM approaches were able to find areas that were abnormal on the ground truth maps.
Statistical Analysis
In the subject analysis, group comparisons for age and intracranial volume were performed by using a t test and for sex by using the Fisher exact test (Version 17.0, SPSS, Chicago, Illinois). VBM statistical results were assessed in SPM8. An analysis of covariance model was used to assess regional differences in the smoothed GM images between patients with RRMS and NC. Age, sex, and intracranial volume were included as nuisance covariates. A linear regression analysis was used to assess the correlation between EDSS and GM atrophy. In the simulated analysis, a paired t test was used to assess regional differences on the smoothed GM images. Covariates were not assessed in the simulation analysis. An explicit mask was constructed by thresholding the mean GM image obtained from GM normalized maps, at a level of 0.5 for each VBM method. All VBM results were assessed after correction for multiple comparisons by using false discovery rate at voxelwise P < .05 with a cluster size >20 and with a family-wise error correction at a threshold of P < .05. Differences in the similarity measures (CC and NMI) between each method with and without LI were assessed by using Wilcoxon paired signed rank test.
Results
Demographic, Clinical, and Conventional MR Imaging Findings
Table 1 shows demographic, clinical, and conventional MR imaging findings of NC and patients with RRMS. No significant group differences were observed when comparing NC and patients with RRMS on age (P = .1), sex (P = .6), and intracranial volume (P = .4).
VBM Analysis
Figure 1 shows group comparisons (RR versus NC) among all 4 VBM methods (DARTEL + LI, DARTEL − LI, USM + LI, and USM − LI). All 4 VBM methods showed significant GM loss in patients with RRMS compared with NC (P < .05, corrected for multiple comparisons by using false discovery rate, cluster size >20). While DARTEL + LI showed more focal GM loss (total volume of the blobs detected = 11.2 mL), DARTEL − LI (total volume of the blobs detected = 14.8 mL), USM + LI (total volume of the blobs detected = 9.8 mL), and USM − LI (total volume of the blobs detected = 23.3 mL) showed a widespread pattern of GM loss. Overall, DARTEL + LI minimized group differences and showed GM loss in the bilateral thalami and caudate nuclei, thereby showing the fewest number of differences between groups (Fig 1). At the family-wise error correction (threshold of P < .05), all 4 VBM methods showed regional GM loss in the bilateral thalami (data not shown) in patients with RRMS compared with NC.
Fig 1.
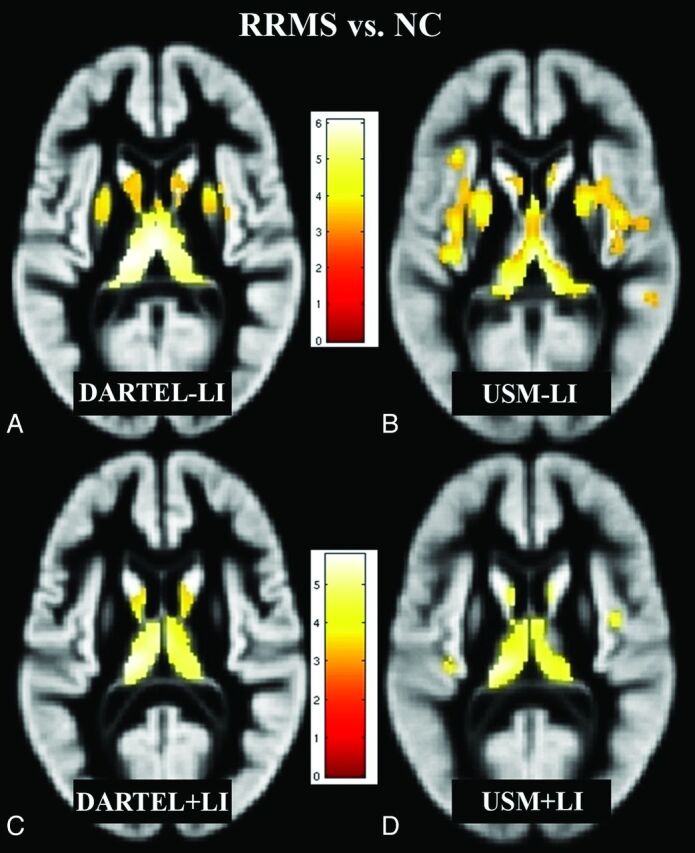
Regions of decreased GM volume in patients with RRMS (n = 26) compared with NC (n = 28) (P < .05, corrected for multiple comparisons by using false discovery rate, cluster size >20), overlaid on a GM template (A–D). Comparisons of all 4 methods (DARTEL + LI, DARTEL − LI, USM + LI, and USM − LI) are illustrated. The pattern of GM atrophy in patients with RRMS shown by DARTEL is more focal, while with USM, it is more widespread. DARTEL + LI (C) likely yielded the most accurate results compared with DARTEL − LI (A), USM − LI (B), and USM + LI (D) (see “Discussion”). Bar is color-coded for t values. Images are presented in the neurologic convention (right side of image = right side of brain). See “Materials and Methods” and “Results” sections for more details.
VBM–Clinical Disability Correlations in the MS Group
Correlations between regional GM loss detected by all 4 VBM methods (DARTEL + LI, DARTEL − LI, USM + LI, and USM − LI) and EDSS were nonsignificant.
Assessment of Intersubject Alignment
As shown in Table 2, the NMI and CC were significantly higher with DARTEL + LI compared with DARTEL − LI (P < .0001) and with USM + LI compared with USM − LI (P < .0001). DARTEL showed improved similarity (measured with CC and NMI; P < .0001) versus USM. Overall, DARTEL + LI achieved the best intersubject alignment of GM maps among the 4 methods.
Table 2:
Assessment of intersubject alignmenta
| Similarity | DARTEL + LI (n = 54) | DARTEL − LI (n = 54) | P (DARTEL + LI vs DARTEL − LI) | USM + LI (n = 54) | USM − LI (n = 54) | P (USM + LI vs USM − LI) |
|---|---|---|---|---|---|---|
| NMI | 1.2630 (0.0064) | 1.2602 (0.0063) | <.0001 | 1.1998 (0.0063) | 1.1981 (0.0062) | <.0001 |
| CC | 0.9675 (0.0039) | 0.9669 (0.0040) | <.0001 | 0.9090 (0.0106) | 0.9084 (0.0107) | <.0001 |
Values are mean (SD). Overall, DARTEL showed higher NMI and CC (P < .0001) compared with USM.
Simulated Data Analysis
Figure 2 shows a comparison between the VBM (DARTEL and USM) methods on the simulated (atrophy and lesion) data. Both VBM approaches detected significant GM loss in the specified regions (thalamus and caudate) under the ground truth with the presence of several FP errors (P < .05, corrected for multiple comparisons by using false discovery rate, cluster size >20). The presence of simulated MS lesions increased the number of FP errors in both DARTEL and USM. However, DARTEL (Fig 2A) showed fewer FP errors than USM (Fig 2B). Sensitivity was similar for both DARTEL (1.0) and USM (1.0) in the presence of simulated atrophy and simulated atrophy + simulated MS lesions. Specificity was similar for DARTEL (0.89) and USM (0.88) in the presence of simulated atrophy only. However, the specificity was higher in DARTEL (0.80) than USM (0.56) in the presence of both simulated atrophy and simulated MS lesions. At the family-wise error correction (threshold of P < .05), both VBM approaches (DARTEL and USM) showed regional GM loss only at the level of the right thalamus and left caudate (data not shown).
Fig 2.

Regions of GM atrophy by using simulated ground truth data (A–D). Comparisons based on all methods are illustrated. Sixteen normal brain T1-weighted images were used as a control group and were compared with 2 groups of simulated patients (P < .05, corrected for multiple comparisons by using false discovery rate, cluster size >20). The results are displayed on a 3D glass brain. In 1 group (C and D), we only simulated atrophy of the thalamus and caudate, and in the other (A and B), we simulated atrophy in the same regions and added artificial lesions. DARTEL in the presence of only atrophy (C) yielded the most accurate results, detecting the atrophy under the ground truth and reducing the number of FPs compared with USM (D). The presence of lesions increased the number of FP errors in both DARTEL and USM (A and B). See “Materials and Methods” and “Results” section for more details.
Discussion
In the present study, we tested the effect of registration and LI on VBM analysis in detecting regional cerebral GM atrophy in MS. While previous research studies have investigated the impact of LI on single-subject automated GM segmentation12 and registration11 in MS, our study examined how LI affects detection of patient-versus-control differences in regional GM volume at the group level. In particular, we explored the use of LI and different registration methods in the context of VBM. Our results suggest that VBM is more accurate when using DARTEL than USM. The application of the LI algorithm improves the accuracy of VBM results in MS. We provided further validation of our work by using simulated VBM data as the ground truth to demonstrate that DARTEL is more reliable than USM.
DARTEL versus USM
We compared the performance of DARTEL and USM-based VBM approaches in MS. While a direct comparison of DARTEL versus USM has not been previously described in MS, such characterization has been performed in other conditions, including Alzheimer and Huntington diseases.8,19–21 As expected from these studies, we found improved performance of DARTEL over USM in the evaluation of GM atrophy in MS. We found fewer regions showing GM atrophy in patients with MS versus NC with DARTEL than USM (Fig 1). These results obtained with DARTEL are likely reflective of greater accuracy and specificity because they reflect a better registration as suggested by similarity measures analysis. When we quantitatively evaluated the registration performance of DARTEL and USM techniques through measures of similarity (NMI and CC), DARTEL showed significantly higher NMI and CC than USM.22,29 These results indicated that the DARTEL registration algorithm, starting from the same segmentation of USM, is better able to correct for misalignment. The high similarity measures (NMI and CC) with DARTEL indicated improved intersubject alignment through registration, increasing confidence that real morphologic differences were detected between patients with MS versus NC rather than artifacts related to misalignment.
Because we did not have any criterion standard data in the subject data, we used an atrophy-simulation paradigm to validate our findings from the subject data. In the simulated data analysis, we artificially created atrophy in the thalamus and caudate, which have been shown to be affected in MS.1 While both DARTEL and USM techniques were able to detect atrophy in the thalamus and caudate, DARTEL showed improved performance with fewer FPs between groups. Our results from simulated data are in line with a recent study that has shown improved performance of VBM-DARTEL compared with other VBM approaches on simulated data.31
It should be noted that to facilitate the comparison between DARTEL and USM, we evaluated the performance of DARTEL and USM by using the same smoothing kernel of 8 mm. Because higher smoothing has been shown to minimize the risk of FP errors,32 the degree of smoothing is related to the registration accuracy. Thus, one would expect that in increasing the smoothing kernel to 12 mm, USM would show fewer FP errors. However, DARTEL has shown higher sensitivity and specificity over USM in SPM5, even when the smoothing kernel used was 8 mm for DARTEL and 12 mm for the USM.21
Effect of Lesion In-Painting
While T1-weighted sequences are widely used to perform VBM analysis in MS, there are errors in registration11 and segmentation12 associated with the presence of hypointense WM lesions affecting the accuracy of VBM outputs. With hypointense WM lesions often misclassified as GM, accurate GM atrophy measurement in MS requires the lesion volume to be reclassified as WM after segmentation. A previous report has shown the importance of LI for single-subject GM automated segmentation enabling more accurate estimation of GM/WM volumes.12 Segmentation biases associated with MS lesions may occur due to a subtle shift in tissue classification in areas with lower GM/WM contrast such as the deep GM and GM/WM boundaries.12,13 Focusing only on the registration aspect, Sdika and Pelletier11 showed that the presence of WM lesions may distort and bias the output of registration, while the use of LI may reduce the registration bias associated with WM lesions. VBM studies to date in MS have primarily relied on a postsegmentation rather than a presegmentation lesion-correction approach.3 Hence, before running VBM analysis, we used an LI algorithm to negate the effect of MS lesions. With this tool, we in-painted T1 hypointense lesions with the simulated values of the same distribution and spatial-intensity variation as normal-appearing WM to create MR images devoid of MS lesions.
Thus, by LI we sought to avoid the limitations observed with postsegmentation lesion corrections that are vulnerable to GM underestimation and WM overestimation.13 As a result of LI, we found fewer GM differences between patients with MS and NC (Fig1C, -D) than without LI (Fig 1A, -B) in both VBM procedures. The use of LI reduced differences in GM maps between patients with RRMS and NC. We also found a high intersubject similarity (NMI and CC) with LI. The simulated data analysis confirmed the findings of the subject data analysis and gave us an estimation of the FP differences. DARTEL showed fewer VBM differences compared with USM both when artificial lesions and atrophy were present at the same time in the comparisons and when only atrophy of the thalamus and the caudate differentiated the 2 groups. The presence of WM lesions increased the number of these FP differences (Fig 2).
Effect of Statistical Correction
Varying the type and level of the statistical correction has been shown to affect VBM results.16 Therefore we tested various statistical scenarios. For example, when using a stringent statistical family-wise error correction, we found atrophy only in the bilateral thalami across all the comparisons (DARTEL + LI, DARTEL − LI, USM + LI and USM − LI) in patients with MS (data not shown). Similarly, by using a stringent statistical family-wise error correction in the simulated analysis, we observed atrophy in only the areas under the ground truth for all DARTEL-versus-USM comparisons (data not shown). This effect of family-wise error correction was predictable because studies16 have shown that such correction dramatically reduces the number of differences. However, because family-wise error correction could also hide the true-positive differences, thereby reducing the sensitivity of VBM methods,16 we chose a priori a less stringent corrected threshold to allow more voxels to be detected. We show that the difference in GM atrophy between the 2 statistical corrections (false discovery rate and family-wise error) was higher for USM than for DARTEL; this confirms that DARTEL was able to show fewer FPs with the corrected results and with a lower statistical correction. We further demonstrate that the differences in statistical corrections between the 2 VBM methods were increased in the absence of LI. Conversely, we found that the effect of LI on final VBM outputs was reduced at the strict statistical correction. In this context, results from previous VBM studies employing strict level of statistical correction without using an LI algorithm for accounting for WM lesions in MS should be considered reliable.3,4
Assessment of Topographic Distribution of Volume Changes in the GM
In our cohort, we found atrophy only in deep GM areas, including the bilateral thalami and caudate nuclei by using DARTEL + LI. In patients with MS, deep GM atrophy has been demonstrated to be a prominent and early finding.1 Other studies in MS have also shown GM atrophy in the cortex, hippocampus, and cerebellum.1,3,4,33–37 Discrepancies between our findings and those studies may relate to a variety of factors. It is plausible that our technique could be affected by false-negative results (low sensitivity). This is unlikely because results from simulated ground truth analysis indicate a high sensitivity of all VBM methods. Alternatively, divergent results may reflect differences in methodologic approaches, sample sizes, and clinical characteristics (such as level of disability, phenotypes, and disease duration).33–37
Limitations
Because of the small sample size, the findings should be considered preliminary. We did not find any association between GM atrophy and clinical disability. This result should be interpreted with caution because the narrow range on the EDSS may have limited the ability to show GM-clinical correlations. Alternatively, other clinical measures such as cognitive function or fatigue, which are associated with GM damage,1 were not assessed in our study. Additional studies of patients with progressive forms of MS are necessary to understand the generalizability regarding the utility of LI in VBM analysis. We manually traced the T1 hypointense WM lesions on MDEFT images. This approach is very time-consuming and less practical; however, other approaches,38 such as creating FLAIR or T2 lesion masks and registering those to the T1-weighted images followed by manual correction, could be used to reduce analysis times. We have not used GM (cortical and deep gray) LI in our study, which may further improve the validity of our results. In addition, we did not systematically evaluate the impact of regional lesion clusters on the VBM results.
While previous studies with older VBM approaches have used corrections of lesion misclassification after the segmentation step,3 in our study, we did not perform this analysis and assessed its comparison with our technique for 2 main reasons. First, as mentioned above, various studies have already demonstrated that the lesion correction after segmentation underestimates GM volume compared with the LI procedure.12,13 Second, although in DARTEL it is possible to perform lesion correction after segmentation on the rigid-body aligned images before the warping and template-creation steps, this same procedure is not technically feasible in USM. Because USM is a generative procedure in which the segmentation and registration steps are performed together with uniformity-correction iteratively for each subject,18 the inherent technical limitation of USM did not easily permit this approach. Finally, we only performed VBM analysis for the assessment of GM atrophy. We plan to assess the effect of regional lesion clusters on the regional GM loss and to pursue VBM of WM atrophy in conjunction with LI in the future with a larger cohort of patients with MS.
Conclusions
We introduce a pipeline that can be applied to 3T brain MR imaging scans to detect MS-related regional cerebral GM atrophy by using VBM. The pipeline leverages an automated algorithm to account for the effects of MS lesions and applies a recently developed registration tool. Future longitudinal studies are warranted, with a larger sample size and patients with advancing disease to confirm our findings.
Acknowledgments
We thank Dr Christos Davatzikos and the biomedical image analysis center at the University of Pennsylvania for providing the atrophy simulation software package. We also thank Sophie Tamm for assistance with manuscript preparation.
ABBREVIATIONS:
- CC
cross-correlation
- DARTEL
diffeomorphic anatomical registration through exponentiated lie algebra
- EDSS
Expanded Disability Status Scale
- FP
false-positive
- GM
gray matter
- LI
lesion in-painting
- MDEFT
Modified Driven Equilibrium Fourier Transform
- NC
normal controls
- NMI
normalized mutual information
- RRMS
relapsing-remitting MS
- USM
unified segmentation model
- VBM
voxel-based morphometry
Footnotes
This work was supported by research grants from the National Institutes of Health (NIH-NINDS R01 NS055083-01) and National Multiple Sclerosis Society (RG3705A1; RG3798A2).
Paper previously presented in preliminary form at: 2010 Annual Meeting of the European Committee on Treatment and Research in Multiple Sclerosis, October 13–16, 2010; Gothenburg, Sweden.
Disclosures: Tanuja Chitnis—RELATED: Grant: Merck-Serono,* Comments: grant to support recruitment and clinical data collection for patients recruited to the MS Center Natural History study, UNRELATED: Consultancy: Biogen Idec, Teva Neurosciences, Novartis, Sanofi-Aventis, Comments: Consultancy regarding MS therapies. Howard Weiner—UNRELATED: Board Membership: Nasvax, Comments: company developing oral anti-cluster of differentiation 3 for the treatment of autoimmune disease, Consultancy: Biogen Idec, EMD Serono, Novartis, Teva, Genzyme, Comments: consultant for evaluation of medications to treat multiple sclerosis. Charles Guttmann—UNRELATED: Consultancy: Tibotec Therapeutics, Johnson & Johnson, Comments: ad hoc advisory committee member (1 time). Rohit Bakshi—UNRELATED: Consultancy: Bayer, Biogen Idec, Novartis, Questcor, Teva Neuroscience, Grants/Grants Pending: Biogen Idec, EMD Serono, Teva Neuroscience. *Money paid to the institution.
References
- 1. Pirko I, Lucchinetti CF, Sriram S, et al. Gray matter involvement in multiple sclerosis. Neurology 2007; 68: 634– 42 [DOI] [PubMed] [Google Scholar]
- 2. Ashburner J, Friston KJ. Voxel-based morphometry: the methods. Neuroimage 2000; 11: 805– 21 [DOI] [PubMed] [Google Scholar]
- 3. Ceccarelli A, Rocca MA, Pagani E, et al. A voxel-based morphometry study of grey matter loss in MS patients with different clinical phenotypes. Neuroimage 2008; 42: 315– 22 [DOI] [PubMed] [Google Scholar]
- 4. Riccitelli G, Rocca MA, Pagani E, et al. Cognitive impairment in multiple sclerosis is associated to different patterns of gray matter atrophy according to clinical phenotype. Hum Brain Mapp 2011; 32: 1535– 43 [DOI] [PMC free article] [PubMed] [Google Scholar]
- 5. Bookstein FL. “Voxel-based morphometry” should not be used with imperfectly registered images. Neuroimage 2001; 14: 1454– 62 [DOI] [PubMed] [Google Scholar]
- 6. Fein G, Landman B, Tran H, et al. Statistical parametric mapping of brain morphology: sensitivity is dramatically increased by using brain-extracted images as inputs. Neuroimage 2006; 30: 1187– 95 [DOI] [PMC free article] [PubMed] [Google Scholar]
- 7. Acosta-Cabronero J, Williams GB, Pereira JM, et al. The impact of skull-stripping and radio-frequency bias correction on grey-matter segmentation for voxel-based morphometry. Neuroimage 2008; 39: 1654– 65 [DOI] [PubMed] [Google Scholar]
- 8. Pereira JM, Xiong L, Acosta-Cabronero J, et al. Registration accuracy for VBM studies varies according to region and degenerative disease grouping. Neuroimage 2010; 49: 2205– 15 [DOI] [PubMed] [Google Scholar]
- 9. Tardif CL, Collins DL, Pike GB. Sensitivity of voxel-based morphometry analysis to choice of imaging protocol at 3 T. Neuroimage 2009; 44: 827– 38 [DOI] [PubMed] [Google Scholar]
- 10. Tardif CL, Collins DL, Pike GB. Regional impact of field strength on voxel-based morphometry results. Hum Brain Mapp 2010; 31: 943– 57 [DOI] [PMC free article] [PubMed] [Google Scholar]
- 11. Sdika M, Pelletier D. Nonrigid registration of multiple sclerosis brain images using lesion inpainting for morphometry or lesion mapping. Hum Brain Mapp 2009; 30: 1060– 67 [DOI] [PMC free article] [PubMed] [Google Scholar]
- 12. Chard DT, Jackson JS, Miller DH, et al. Reducing the impact of white matter lesions on automated measures of brain gray and white matter volumes. J Magn Reson Imaging 2010; 32: 223– 28 [DOI] [PubMed] [Google Scholar]
- 13. Jackson J, Chard D, Dell'Oglio E, et al. Cerebral white and gray matter MRI segmentation with lesion in-painting in multiple sclerosis: 2010 annual meeting of the American Academy of Neurology—Toranto, Canada. Neurology 2010; 74: 237 [Google Scholar]
- 14. Ridgway GR, Henley SM, Rohrer JD, et al. Ten simple rules for reporting voxel-based morphometry studies. Neuroimage 2008; 40: 1429– 35 [DOI] [PubMed] [Google Scholar]
- 15. Ridgway GR, Omar R, Ourselin S, et al. Issues with threshold masking in voxel-based morphometry of atrophied brains. Neuroimage 2009; 44: 99– 111 [DOI] [PubMed] [Google Scholar]
- 16. Henley SM, Ridgway GR, Scahill RI, et al. Pitfalls in the use of voxel-based morphometry as a biomarker: examples from Huntington disease. AJNR Am J Neuroradiol 2010; 31: 711– 19 [DOI] [PMC free article] [PubMed] [Google Scholar]
- 17. Ashburner J. A fast diffeomorphic image registration algorithm. Neuroimage 2007; 38: 95– 113 [DOI] [PubMed] [Google Scholar]
- 18. Ashburner J, Friston KJ. Unified segmentation. Neuroimage 2005; 26: 839– 51 [DOI] [PubMed] [Google Scholar]
- 19. Klein A, Andersson J, Ardekani BA, et al. Evaluation of 14 nonlinear deformation algorithms applied to human brain MRI registration. Neuroimage 2009; 46: 786– 802 [DOI] [PMC free article] [PubMed] [Google Scholar]
- 20. Yassa MA, Stark CE. A quantitative evaluation of cross-participant registration techniques for MRI studies of the medial temporal lobe. Neuroimage 2009; 44: 319– 27 [DOI] [PubMed] [Google Scholar]
- 21. Bergouignan L, Chupin M, Czechowska Y, et al. Can voxel based morphometry, manual segmentation and automated segmentation equally detect hippocampal volume differences in acute depression? Neuroimage 2009; 45: 29– 37 [DOI] [PubMed] [Google Scholar]
- 22. McLaren DG, Kosmatka KJ, Kastman EK, et al. Rhesus macaque brain morphometry: a methodological comparison of voxel-wise approaches. Methods 2010; 50: 157– 65 [DOI] [PMC free article] [PubMed] [Google Scholar]
- 23. Takahashi R, Ishii K, Miyamoto N, et al. Measurement of gray and white matter atrophy in dementia with Lewy bodies using diffeomorphic anatomic registration through exponentiated lie algebra: a comparison with conventional voxel-based morphometry. AJNR Am J Neuroradiol 2010; 31: 1873– 78 [DOI] [PMC free article] [PubMed] [Google Scholar]
- 24. Kurtzke JF. Rating neurologic impairment in multiple sclerosis: an Expanded Disability Status Scale (EDSS). Neurology 1983; 33: 1444– 52 [DOI] [PubMed] [Google Scholar]
- 25. Polman CH, Reingold SC, Edan G, et al. Diagnostic criteria for multiple sclerosis: 2005 revisions to the “McDonald Criteria.” Ann Neurol 2005; 58: 840– 46 [DOI] [PubMed] [Google Scholar]
- 26. Deichmann R, Schwarzbauer C, Turner R. Optimisation of the 3D MDEFT sequence for anatomical brain imaging: technical implications at 1.5 and 3 T. Neuroimage 2004; 21: 757– 67 [DOI] [PubMed] [Google Scholar]
- 27. Stankiewicz JM, Glanz BI, Healy BC, et al. Brain MRI lesion load at 1.5T and 3T versus clinical status in multiple sclerosis. J Neuroimaging 2011; 21: e50– 56 [DOI] [PMC free article] [PubMed] [Google Scholar]
- 28. Bakshi R, Neema M, Healy BC, et al. Predicting clinical progression in multiple sclerosis with the magnetic resonance disease severity scale. Arch Neurol 2008; 65: 1449– 53 [DOI] [PMC free article] [PubMed] [Google Scholar]
- 29. Tahmasebi AM, Abolmaesumi P, Zheng ZZ, et al. Reducing inter-subject anatomical variation: effect of normalization method on sensitivity of functional magnetic resonance imaging data analysis in auditory cortex and the superior temporal region. Neuroimage 2009; 47: 1522– 31 [DOI] [PMC free article] [PubMed] [Google Scholar]
- 30. Karacali B, Davatzikos C. Simulation of tissue atrophy using a topology preserving transformation model. IEEE Trans Med Imaging 2006; 25: 649– 52 [DOI] [PubMed] [Google Scholar]
- 31. Li W, He H, Lu J, et al. Evaluation of multiple voxel-based morphometry approaches and applications in the analysis of white matter changes in temporal lobe epilepsy. In: Proceedings of the 5th International Workshop on Medical Imaging and Augmented Reality, Bejiing, China. September 19– 20, 2010. [Google Scholar]
- 32. Salmond CH, Ashburner J, Vargha-Khadem F, et al. Distributional assumptions in voxel-based morphometry. Neuroimage 2002; 17: 1027– 30 [PubMed] [Google Scholar]
- 33. Sailer M, Fischl B, Salat D, et al. Focal thinning of the cerebral cortex in multiple sclerosis. Brain 2003; 126: 1734– 44 [DOI] [PubMed] [Google Scholar]
- 34. Battaglini M, Giorgio A, Stromillo ML, et al. Voxel-wise assessment of progression of regional brain atrophy in relapsing-remitting multiple sclerosis. J Neurol Sci 2009; 282: 55– 60 [DOI] [PubMed] [Google Scholar]
- 35. Sicotte NL, Kern KC, Giesser BS, et al. Regional hippocampal atrophy in multiple sclerosis. Brain 2008; 131: 1134– 41 [DOI] [PubMed] [Google Scholar]
- 36. Charil A, Dagher A, Lerch JP, et al. Focal cortical atrophy in multiple sclerosis: relation to lesion load and disability. Neuroimage 2007; 34: 509– 17 [DOI] [PubMed] [Google Scholar]
- 37. Calabrese M, Rinaldi F, Mattisi I, et al. The predictive value of gray matter atrophy in clinically isolated syndromes. Neurology 2011; 77: 257– 63 [DOI] [PubMed] [Google Scholar]
- 38. Yeh EA, Weinstock-Guttman B, Ramanathan M, et al. Magnetic resonance imaging characteristics of children and adults with paediatric-onset multiple sclerosis. Brain 2009; 132 (pt 12): 3392– 400 [DOI] [PubMed] [Google Scholar]