

Abstract
Recent single-cell and single-molecule studies have shown that a variety of subpopulations exist within biological systems, such as synaptic vesicles, that have previously been overlooked in common bulk studies. By isolating and enriching these various subpopulations, detailed analysis with a variety of analytical techniques can be done to further understand the role that various subpopulations play in cellular dynamics and how alterations to these subpopulations affect the overall function of the biological system. Previous sorters lack the sensitivity, sorting speed, and efficiency to isolate synaptic vesicles and other nanoscale systems. This paper describes the development of a fluorescence activated nanoscale subcellular sorter that can sort nearly 10 million objects per hour with single-molecule sensitivity. Utilizing a near-nanoscale channel system, we were able to achieve upwards of 91% recovery of desired objects with a 99.7% purity.
Keywords: Microfluidics, electro-osmotic flow, subcellular fractionation, synaptic vesicles
INTRODUCTION
Microfluidics has recently become an important component in bioanalytical research. Successful microfluidic bioanalytical applications include DNA sequencing and fragment sizing1-3, PCR amplification4,5, protein analysis6,7, immunoassays8, and cell sorting and manipulation9-12. All of these examples utilize the low sample and reagent volumes as well as the unique physical properties of microscale fluid flow to enable new research. Near-nanoscale microfluidic methods are particularly well suited for the study of subcellular organelles, macromolecular complexes, and other nanoscale materials. In our lab, we have a particular interest in applying these microfluidic methods to further enhance the techniques used to study synaptic vesicles due to the essential role that synaptic vesicles play in the propagation of chemical signals between neurons.
Over the last decade most of the proteins associated with synaptic vesicles have been identified. Studies have provided insight into the role each protein plays in the synaptic vesicle cycle with regards to vesicle formation, neurotransmitter loading, docking, fusion, and vesicle recycling. Correlations between changes in synaptic protein expression and synaptic functions, such as decreases in neurotransmission and disruptions to trafficking of other synaptic vesicle proteins13-15, have been observed. Also, variations in protein expression in synaptic vesicles have been seen in several nervous system pathologies, including schizophrenia16 and epilepsy17,18. The majority of the protein studies on synaptic vesicles are based on bulk assays in which the observed results are an average of often millions of individual organelles. As the vesicular proteins are studied in greater detail and with finer techniques, variations within protein populations have been discovered that had previously been averaged out6. Differentiating between subpopulations could provide new insight into mechanisms, regulations, and interactions that control synaptic vesicle dynamics and a better understanding in how changes in synaptic function relate to protein subpopulations. In this paper we discuss the development of a fluorescence activated nanoscale subcellular sorter (FANSS) in which subpopulations within large samples of synaptic vesicles and other sub-cellular organelles can be isolated and enriched with a high efficiency and sorting speed before further analysis by other analytical techniques, such as mass spectrometry.
Conventional flow cytometers and sorters have been used for cell sorting in a broad range of biological research and clinical applications19,20, including diagnosing and monitoring carcinomas21 and examining virus-cell interactions22. Microfabricated flow cytometers have emerged as a low-cost, disposable alternative to traditional flow cytometers and have shown a higher sensitivity when applied to sorting objects like fluorescent beads and E. coli cells23-25. However, the sensitivity of these microfabricated cytometers remains insufficient for sorting nanoscale systems such as subcellular organelles and lacks the necessary sorting speed and throughput. To address these drawbacks, we developed a platform specifically for subcellular organelles that utilizes smaller channels to improve sorting speed and smaller probe volumes to minimize Raman scattering and background fluorescence to improve sensitivity. We believe the sensitivity and throughput of the FANSS represents a new strategy for carrying out subcellular fractionation to achieve high-efficiency isolation of large numbers of any given organelle, protein complex, or nanoscale system. To our knowledge, our FANSS represents the only nanoscale sorter at present with single-dye molecule sensitivity and with a sort rate comparable to commercial flow sorters (i.e. few tens of kHz).
EXPERIMENTAL METHODS
Fabrication of Fluorescence Activated Nanoscale Subcellular Sorter
The FANSS was composed of poly(dimethylsiloxane) (PDMS) channels fabricated using techniques of soft lithography9. Briefly, the seven channel network (Fig. 1A) consisting of 2μm channels was designed using AutoCAD. A chrome mask (HTA Photomask, San Jose, CA, USA) was created from the AutoCAD design for use in contact photolithography. Silicon masters patterned with SU-8 were generated by spin-coating SU-8 2000 (Microchem) onto a silicon wafer. Solvent in the SU-8 was driven off by baking the wafer at 105°C for 1 min. The chrome mask was placed in contact with the SU-8 and then the SU-8 was UV exposed to create positive features of channels for the FANSS device. To obtain the finalized master, the wafer was baked at 105°C for 1 min after UV exposure and then developed in propylene glycol methyl ether acetate (PGMEA). The master was exposed to tridecafluoro-1,1,2,2-tetrahydrooctyl-1-trichlorosilane (Sigma-Aldrich) overnight to facilitate the release of PDMS. Next, a PDMS chip was molded from the master and holes were punched in the PDMS at the end of each channel to create reservoirs. Finally, the PDMS chip was bonded irreversibly to a glass coverslip after exposing both the PDMS and glass to oxygen plasma. The channels of the FANSS were immediately filled with buffer and experiments were run within several hours.
Figure 1.

Schematic of the FANSS platform. (A) The chip consisted of a sample chamber, flow focusing channels, fluid-flow-control channels to control sorting, and collection channels (channel widths of 2μm). The fluid flow was controlled by EOF and the sorting was driven by adjusting the applied voltages. Initially the voltage was higher in the right flow-control channel than the left flow-control channel, thus pushing the sample flow to the waste channel. When a nano-object was detected by both the green-channel and red-channel APDs, the higher voltage pulse was switched to the left-flow control channel and the target object was collected. (B) Intensity traces of the fluorescence collected by each APD, the triggered voltage pulse, and the confirmation of the successful sort with the collection APD. (C) Optical instrument consisting of two lasers, a high numerical aperture objective, and single photon counting APD detectors.
Two-Beam Line Confocal Microscopy
Rapidly sorting and analyzing single molecules and subcellular organelles required high sensitivity detection and a high signal-to-noise ratio. For this reason we chose to employ a dual line confocal arrangement to probe the sample while sorting. The use of line confocal detection maximized the signal-to-noise ratio by limiting the excitation and detection volume to the width of the channels while retaining the diffraction-limited focus in the direction orthogonal to the flow.
Construction of a two-beam line confocal microscope has previously been discussed in detail by Schiro et al26. In summary, a two-color two-beam line confocal microscope (Fig. 1C) was constructed by first sending a 488nm output and a 633nm output through cylindrical optics to form collimated elliptical beams and then a polychroic mirror was used to combine the two colors into a single beam. A pair of polarizing beam splitter cubes (PBSC) was used to split the combined beam into two dual-color beams and then recombine these beams. Mirrors were placed in between the two PBSC providing the ability to independently steer each dual-color beam to create two spatially separate detection regions, one region to trigger the sorting and a second region to confirm the sorting. The beams were then sent into a Nikon TE2000 microscope equipped with a Nikon 100× objective (NA 1.4). Fluorescence was collected through the objective and a mirror was used to reflect the fluorescence from one detection region in a direction perpendicular to the fluorescence from the other detection region. The fluorescence from the detection region used to confirm sorting was passed through a rectangular aperture and then focused on to an avalanche photodiode (APD). The fluorescence from the detection region used to trigger sorting was passed through a rectangular aperture then split with a polychroic mirror before the resulting red and green fluorescence were collected with independent APDs.
Synaptic Vesicle Preparation
Synaptic vesicles were isolated from whole rat brains purchased from Pelfreeze. The rat brains were frozen before being ground into a fine powder by blending with liquid nitrogen and then resuspended in a homogenization buffer (0.3 M sucrose, 50 mM HEPES, pH7.4, 2 mM EGTA). A Teflon-glass homogenizer was used to homogenize the solution and the resulting homogenate was centrifuged at 100,000 × g for 1 hr at 4°C to remove excess cellular debris. To further isolate and enrich the synaptic vesicles, the resulting supernatant was loaded onto a sucrose step gradient (0.6 M/1.5 M) and centrifuged at 260,000 × g for 2 hr at 4°C. Isolated synaptic vesicles were collected from the 0.6 M/1.5 M interface, then vesicles were diluted to 0.3 mg/ml as determined by a Bio-Rad protein assay kit. Vesicles were then stored at −80°C for up to 6 months before use.
Before antibody labeling was performed, synaptic vesicles were exchanged into a phosphate buffered saline by gel filtration through a 3 ml BioGel P10 (Bio-Rad) column. Synaptic vesicles were labeled against two synaptic vesicle proteins, SV2 and VAMP. Initially, the synaptic vesicles were incubated for 5 hr at 4°C in the presence of anti-VAMP monoclonal antibody (Lifespan BioSciences) and then the vesicles were incubated with anti-IgG-agarose beads (Sigma) to remove excess antibody. The vesicle sample was then incubated with an Alexa-635-conjugated secondary antibody (Invitrogen) overnight at 4°C. Vesicles were then incubated with a second confirmatory antibody, anti-SV2 polyclonal antibody (Synaptic Systems), and an Alexa-488-conjugated secondary antibody. Each incubation step took place for a minimum of 1 hr at 4°C. Finally, the vesicles were incubated with anti-goat-IgG agarose beads to remove excess secondary antibodies from the solution.
RESULTS AND DISCUSSION
Figure 1A shows the seven channel network designed for the FANSS. Five of the seven channels were input channels and electro-osmotic flow (EOF) was used to control the flow through these channels. The five input channels consisted of a main channel, two flow focusing channels to generate a centrally located stream containing the sample, and two fluid flow control channels (or sorting channels). The remaining channels led to a waste reservoir and a collection reservoir. The line confocal beam used to trigger a sorting event was positioned right before the sorting junction. The second line confocal beam was positioned in the channel leading to the collection reservoir to confirm properly sorted objects.
Before sorting began, the two flow focusing channels and the two sorting channels were filled with clean buffer and continuously flowed through both the channel leading to the waste reservoir and the channel leading to the collection reservoir. Initially, the sorting channel on the right had a higher flow rate then the sorting channel on the left causing a flow displacement of the central sample stream to the waste reservoir. The sample was introduced through the main channel and flowed down towards the sorting junction. When a fluorescent particle passed through the first detection region, a sorting event would be triggered if it met the correct criteria (typically, displayed both red and green fluorescence). When a sorting event was triggered (Fig. 1B) a change in voltage occurred at the sorting channels. The change in voltage caused the flow from the left channel to increase, thereby directing the flow of the central stream containing the sample from the waste reservoir to the collection reservoir. Once the fluorescent object was directed towards the entrance of the collection channel, the voltage control reverted to the initial state, and the central stream again flowed towards the waste reservoir. To attain single-molecule sensitivity and high throughput from the FANSS we optimized each component as follows.
Optical Probe Shape and Size
To ensure the detection of every fluorescent particle, the probe volume must match the cross section of the channel. For applications in which the channel dimensions need to be larger than the size of the diffraction limited probe volume (~500nm), the probe volume must be expanded. However, as the probe volume increases, the background also increases, and the signal-to-noise ratio decreases. To limit this effect, we created an elliptically shaped beam profile using cylindrical lenses. By matching this profile with a rectangular pinhole, the probe volume can be expanded to the size of the channel’s cross section without significantly decreasing the signal-to-noise ratio. The optical probe parameters have been analyzed extensively by Schiro et al26.
Another significant contribution to the signal-to-noise ratio is the transit time of the object through the probe volume. Given the high signal-to-noise ratio of this system, we can detect single dye molecules with a transit time of only 10 μsec. For subcellular organelles labeled with more than one dye molecule, the transit time is not a limiting factor for detection.
Electronics Response Time
The timing and synchronization of data through a computer processor is typically not accurate below ~1 msec and will limit our sorting rate. To avoid this issue while actuating the channel voltage changes, a custom electronic circuit with a reprogrammable sorting algorithm was built by connecting the output of the APDs to a field programmable gate array and power supply. Using this approach, a 1 μsec rise time for pulses up to 500 volts was achieved. The sorting algorithm can be configured to trigger a change in voltage (and a sorting event) under many different experimental conditions such as fluorescent wavelength, intensity or transit time.
Fluid Response Time and Displacement Time
In pressure-based microfluidic cell sorters, the switching mechanism is a limiting factor. Often pneumatic valves are used to control the flow, which typically have a response time of several milliseconds at best for opening and closing. Another limit to these microfluidic systems is the pressure needed to generate fast flow velocities. The highly nonlinear increase in pressure (r4) needed as the channel dimension (r) decreases makes pressure-based flow unfeasible for FANSS. In comparison, EOF flow has a very fast response time, and the characteristic time to establish steady state conditions has been solved for a rectangular channel. The characteristic time is given by
| (1) |
where Dh is the hydraulic diameter of the channel and ν is the kinematic viscosity (1 μm2/μsec)27. For a 500nm channel, the response time is theoretically 0.25 μsec.
Flow Focusing and On-Chip Filtration
The reduction in channel dimensions to the micron and submicron size scale optimizes throughput by decreasing the transit times. To decrease the transit times further, additional flow focusing channels were included in the chip design (Fig. 2A). The additional flow focusing channels increased the flow velocity for a given voltage (Fig. 2B) as well as reduced the interaction between the sample and the channel walls, which reduced the probability of clogging the channel when working with biological systems.
Figure 2.
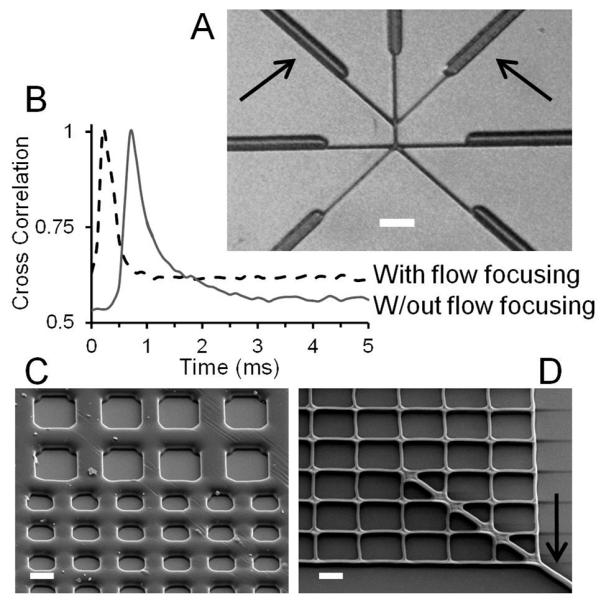
Optical and SEM images of the FANSS chip. (A) Optical image showing the 2μm-wide channels at the sorting junction as well as the broader 10μm-wide channels that lead into them. The arrows point to the flow focusing channels. The scale bar is 25μm. (B) Cross correlation data showing the flow rate increased and the faster sorting rate achieved by using the flow-focusing channels. (C and D) SEM images of the integrated filters used to prevent large aggregates from blocking the sorting channels. The filters were fabricated to have critical dimensions between 4μm (C) and 0.5μm (D) depending on the sample and application. The arrow denotes the channel leading from the filtration area to the sorting area. The scale bars are 4μm.
To further increase the robustness of the system and to facilitate longer sorting runs, we integrated a grid-based filtration design at the entrance to the main channel. Objects larger than the size of the channel would become lodged in the grid where the effect on the overall fluid flow is minimal. The channel width in the grid region was varied between 4μm (Fig. 2C) and 0.5μm (Fig. 2D) and tailored to specific sample specifications. Sorting runs exceeding 2 hours were achieved due to the integration of the filtration design.
Sorting Efficiency and Recovery
The most important criteria for the sorting of subcellular organelles are the sorting rate as well as the purity and recovery rate of the sorted fraction. The dual confocal slit arrangement allowed for analysis and optimization of these parameters. The recovery rate of the sorted fraction was determined by calculating the percentage of the objects that triggered a sorting event and were also observed in the correct collection chamber. This was calculated by counting the photon bursts as each object passed by the two detectors, the triggering APD and the collection APD.
For the data shown in Figure 3, 100nm green fluorescent beads were interrogated by the 488nm laser. An equal EOF voltage was applied to the sample channel, the two flow focusing channels, and one of the flow sorting channels. Both the collection and waste channels were grounded, and the other sorting channel was held at a higher voltage. Upon triggering, the sorting channel voltages were switched such that the higher voltage forced the object into the collection channel. The cross correlation of the intensity traces from the two detection regions provided the transit time for the particles, which were investigated over a range of voltages (Fig 3A). The maximum sustainable flow rate was 20 mm/sec giving a fastest sort time of 0.1 msec (Fig 3B) and a volumetric flow rate of 2.4 nl/min for the 2μm × 1μm channels.
Figure 3.

Characterization of the nanosorting platform. (A) A plot showing the transit time between the APDs used to trigger the sorting and the collection APD at varying EOF voltages. The cross correlation of the two intensity traces shows the distribution of transit times and determined the parameters used for sorting. (B) A plot showing the fastest sorting time and the linear flow rate as a function of EOF voltage.
Sort Rate and Purity
When sorting a sample, a high recovery of the object to be sorted with a high purity is desired. To characterize the purity of the sorted fraction, a mixture of 100nm green beads and 60nm red beads were sorted. For the characterization, green beads were collected and the collection APD was used to count the number of red beads that mistakenly made it down the collection channel (Fig. 4A (insert)). The most important controllable parameter that affected the purity and recovery rate was the length of time that the voltage was held in the switching configuration. If the switching pulse-length time was too long, then red particles were unintentionally sorted into the green channel giving a low purity. As the switching pulse-length time was reduced the recovery fell because not all the green particles made it into the correct channel. Figure 4 illustrates the control of these two parameters as a function of the sorting pulse length. At a sorting pulse length of 2000 μsec, the recovery was nearly 100% but the purity was reduced and the maximum sorting rate was also low. The optimal parameters were obtained with a sorting pulse time of 100 μsec with a recovery of 91%, a purity of 99.7%, and a sorting rate of 10,000 Hz. A fluorescence image of the sample prior to sorting is shown in Figure 4B along with images of the collected fraction for a high purity sort (Fig. 4C) and a low purity sort (Fig. 4D).
Figure 4.

Sorting rate and purity. (A) The plot shows sorting rate and recovery as a function of the sorting pulse time. As a sorting rate of 10,000 Hz, the recovery rate of the target sample was 91% with a purity of 99.7% (insert). For 20,000 Hz the recovery rate fell to 60%. (B) A fluorescence image showing the mixed 100nm green and 60nm red beads in the sample chamber prior to sorting. Images of the collection chamber after sorting with a pulse time of 100 μsec (C) and 2000 μsec (D) showing the higher purity with the faster sorting pulse time.
Bulk analysis of subcellular organelles requires a very large number of organelles (millions to billions). For this subcellular fractionation technique to be of practical value for bulk studies, a minimum of thousands of organelles need to be sorted per second. We have been able to achieve a sort rate of ~10 thousand objects per second. The limiting factor was the heterogeneity in the electric field at the sorting junction. As highly charged particles passed through this high-voltage junction, the combination of the perturbation to the EOF, imperfections in the fabrication of the channels, and the surface charge caused the trajectory of the particles to become unstable at velocities above 25 mm/sec. The voltage at this junction was ~100 kV/cm, which was approaching the dielectric breakdown for PDMS. There are several potential ways to overcome this issue, including switching to glass channels, using pressure-driven flow for the main channel and only applying voltage to induce switching, or further reducing the dimension of the channels.
Sorting Synaptic Vesicles
The SV2- and VAMP-labeled vesicles were used to test the capabilities of FANSS for sorting biological samples. For each experiment, the initial sample was imaged using total internal reflection fluorescence (TIRF) microscopy. Figure 5D shows a two-color overlay of a typical synaptic-vesicle sample before sorting. The TIRF images show some of the subpopulations that exist within a single sample: (1) the green only spots represent vesicles that only contain the SV2 label, (2) the red only spots are vesicles with only a VAMP label, and (3) the yellow spots represent vesicles with both an SV2 and VAMP label. Two experiments were run to demonstrate the capability to use FANSS to separate subpopulations from the sample. First, vesicles that showed fluorescence from both protein labels triggered sorting and collection (Fig. 5B). In the second experiment only the VAMP-labeled vesicles were sorted. A high sorting purity and enrichment of sample are seen in the TIRF images for both sorting experiments (Fig. 5C and 5E).
Figure 5.

Synaptic-vesicle sorting. (A) APD intensity traces from the sorting of synaptic vesicles labeled with SV2 (top) and VAMP (bottom). (B) Vesicles that were bound with both antibodies triggered a sorting voltage pulse and were collected. (C) TIRF microscopy image of the collected vesicles. Co-localization (shown in yellow) of the red and green image identified vesicles labeled with both SV2 and VAMP. (D) TIRF image of the vesicles prior to sorting showing the very low rate of co-localization. (E) A separate sorting experiment of synaptic vesicles in which only red fluorescence from VAMP caused the sort triggering. The TIRF image shows the very high purity of the collected sample with only a few green SV2 labeled vesicles.
CONCLUSION
Research into the heterogeneity within a bulk sample is providing new insight into the origins of disease and biomolecular interactions. Previously, lack of sensitivity and low sorting speeds had made the use of flow cytometers to sort and enrich subcellular populations for further detailed analysis difficult. By reducing the size, the sensitivity and throughput of the near-nanoscale channel system were greatly increased. The sorting speed was increased dramatically by employing EOF flow switching and by reducing the distance sorted organelles had to travel. Small probe volumes that matched the dimensions of the channels minimized background fluorescence and extended the sensitivity to the single-molecule level. The FANSS provides a technique to isolate, purify, and enrich a specific subcellular population for further detailed analysis by other analytical techniques and should allow for a more nuanced understanding of these populations and how the differences between or changes to these populations affect the function of subcellular compartments and structures, such as signaling complexes.
ACKNOWLEDMENTS
We gratefully acknowledge support of this work by the National Institutes of Health (R01NS052637).
REFERENCES
- (1).Mueller O, Hahnenberger K, Dittmann M, Yee H, Dubrow R, Nagle R, Ilsley D. Electrophoresis. 2000;21:128–134. doi: 10.1002/(SICI)1522-2683(20000101)21:1<128::AID-ELPS128>3.0.CO;2-M. [DOI] [PubMed] [Google Scholar]
- (2).Foquet M, Korlach J, Zipfel W, Webb WW, Craighead HG. Anal. Chem. 2002;74:1415–1422. doi: 10.1021/ac011076w. [DOI] [PubMed] [Google Scholar]
- (3).Woolley AT, Mathies RA. Anal. Chem. 1995;67:3676–3680. doi: 10.1021/ac00116a010. [DOI] [PubMed] [Google Scholar]
- (4).Lagally ET, Medintz I, Mathies RA. Anal. Chem. 2001;73:565–570. doi: 10.1021/ac001026b. [DOI] [PubMed] [Google Scholar]
- (5).Fuchiwaki Y, Nagai H, Saito M, Tamiya E. Biosens. Bioelectron. 2011;27:88–94. doi: 10.1016/j.bios.2011.06.022. [DOI] [PubMed] [Google Scholar]
- (6).Mutch SA, Kensel-Hammes P, Gadd JC, Fujimoto BS, Allen RW, Schiro PG, Lorenz RM, Kuyper CL, Kuo JS, Bajjalieh SM, Chiu DT. J. Neurosci. 2011;31:1461–1470. doi: 10.1523/JNEUROSCI.3805-10.2011. [DOI] [PMC free article] [PubMed] [Google Scholar]
- (7).Mutch SA, Fujimoto BS, Kuyper CL, Kuo JS, Bajjalieh SM, Chiu DT. Biophys. J. 2007;92:2926–2943. doi: 10.1529/biophysj.106.101428. [DOI] [PMC free article] [PubMed] [Google Scholar]
- (8).Ng AHC, Uddayasankar U, Wheeler AR. Anal. Bioanal. Chem. 2010;397:991–1007. doi: 10.1007/s00216-010-3678-8. [DOI] [PubMed] [Google Scholar]
- (9).Fiorini GS, Chiu DT. BioTechniques. 2005;38:429–446. doi: 10.2144/05383RV02. [DOI] [PubMed] [Google Scholar]
- (10).Sgro AE, Allen PB, Chiu DT. Anal. Chem. 2007;79:4845–4851. doi: 10.1021/ac062458a. [DOI] [PMC free article] [PubMed] [Google Scholar]
- (11).Shelby JP, Mutch SA, Chiu DT. Anal. Chem. 2004;76:2492–2497. doi: 10.1021/ac035531v. [DOI] [PubMed] [Google Scholar]
- (12).He M, Edgar JS, Jeffries GDM, Lorenz RM, Shelby JP, Chiu DT. Anal. Chem. 2005;77:1539–1544. doi: 10.1021/ac0480850. [DOI] [PubMed] [Google Scholar]
- (13).Morgans CW, Kensel-Hammes P, Hurley JB, Burton K, Idzerda R, McKnight GS, Bajjalieh SM. PLoS ONE. 2009;4:e5230. doi: 10.1371/journal.pone.0005230. [DOI] [PMC free article] [PubMed] [Google Scholar]
- (14).Littleton JT, Serano TL, Rubin GM, Ganetzky B, Chapman ER. Nature. 1999;400:757–760. doi: 10.1038/23462. [DOI] [PubMed] [Google Scholar]
- (15).Vician L, Lim IK, Ferguson G, Tocco G, Baudry M, Herschman HR. Proc. Natl. Acad. Sci. USA. 1995;92:2164–2168. doi: 10.1073/pnas.92.6.2164. [DOI] [PMC free article] [PubMed] [Google Scholar]
- (16).Mirnics K, Middleton FA, Marquez A, Lewis DA, Levitt P. Neuron. 2000;28:53–67. doi: 10.1016/s0896-6273(00)00085-4. [DOI] [PubMed] [Google Scholar]
- (17).Matveeva EA, Whiteheart SW, Slevin JT. J. Neurochem. 2003;84:621–624. doi: 10.1046/j.1471-4159.2003.01589.x. [DOI] [PubMed] [Google Scholar]
- (18).Matveeva EA, Davis VA, Whiteheart SW, Vanaman TC, Gerhardt GA, Slevin JT. Epilepsia. 2012;53:157–167. doi: 10.1111/j.1528-1167.2011.03345.x. [DOI] [PMC free article] [PubMed] [Google Scholar]
- (19).Brown M, Wittwer C. Clin. Chem. 2000;46:1221–1229. [PubMed] [Google Scholar]
- (20).Ibrahim SF, Engh G. v. d. Curr. Opin. Biotechnol. 2003;14:5–12. doi: 10.1016/s0958-1669(02)00009-5. [DOI] [PubMed] [Google Scholar]
- (21).Michels J-J, Duigou F, Marnay J. Breast Cancer Res. Treat. 2000;62:117–126. doi: 10.1023/a:1006451908322. [DOI] [PubMed] [Google Scholar]
- (22).McSharry JJ. Methods. 2000;21:249–257. doi: 10.1006/meth.2000.1005. [DOI] [PubMed] [Google Scholar]
- (23).Kuo JS, Kuyper CL, Allen PB, Fiorini GS, Chiu DT. Electrophoresis. 2004;25:3796–3804. doi: 10.1002/elps.200406118. [DOI] [PubMed] [Google Scholar]
- (24).Fu AY, Spence C, Scherer A, Arnold FH, Quake SR. Nat. Biotechnol. 1999;17:1109–1111. doi: 10.1038/15095. [DOI] [PubMed] [Google Scholar]
- (25).Dittrich PS, Schwille P. Anal. Chem. 2003;75:5767–5774. doi: 10.1021/ac034568c. [DOI] [PubMed] [Google Scholar]
- (26).Schiro PG, Kuyper CL, Chiu DT. Electrophoresis. 2007;28:2430–2438. doi: 10.1002/elps.200600730. [DOI] [PubMed] [Google Scholar]
- (27).Marcos, Yang C, Ooi KT, Wong TN, Masliyah JH. Colloid Interface Sci. 2004;275:679–698. doi: 10.1016/j.jcis.2004.03.005. [DOI] [PubMed] [Google Scholar]