Abstract
Aims
We apply digital image analysis techniques to study selected types of melanocytic lesions.
Methods and Results
We used advanced digital image analysis to compare melanocytic lesions. All comparisons were statistically significant (p < 0.0001) and we highlight four: 1) melanoma to nevi, 2) melanoma subtypes to nevi, 3) severely dysplastic nevi to other nevi, and 4) melanoma to severely dysplastic nevi. We were successful in differentiating melanoma from nevi (ROC area 0.95) using image-derived features. While many features contribute to separation, analysis revealed features related to nuclear size, shape, and distance between nuclei to be most important. Dividing melanoma into subtypes, even greater separation was obtained (ROC area 0.98 for superficial spreading melanoma; 0.95 for lentigo maligna melanoma; and 0.99 for unclassified). Severely dysplastic nevi were best differentiated from conventional and mildly dysplastic nevi by differences in cellular staining qualities (ROC area 0.84). We found that melanoma were separated from severely dysplastic nevi by features related to cell shape and cellular staining qualities (ROC area 0.95).
Conclusions
We offer a unique perspective into the evaluation of melanocytic lesions and demonstrate a technological application with increasing prevalence, with potential use as an adjunct to traditional diagnosis in the future.
Introduction
Melanoma is a significant cause of morbidity and mortality in the Western World with an increasing incidence.1 Throughout the world it affects thousands of people, not uncommonly with devastating results. The description of the diagnosis and treatment of melanoma and related neoplasms as “difficult and dangerous for all concerned2” is unfortunately very accurate, and a false negative diagnosis of melanoma is the single most common reason for filing a malpractice claim against a pathologist.3 A diagnosis of melanoma is commonly made via histological examination of clinically suspicious lesions. However, there are well known difficulties in differentiating melanoma from other benign melanocytic lesions on simple histological examination.4 Image analysis uses digital technology to identify and quantitate what the human eye may or may not see and is a tool that pathologists are likely to utilize increasingly in the future, especially with increasing digitization of slides.5
In current practice, histological analysis is most commonly based on qualitative features as interpreted (sometimes semi-subjectively) by a pathologist. Traditional histological features that pathologists look for differ based on the tissue type at hand. In the context of melanoma, both architectural and cytological features are assessed. In comparison to benign lesions, melanocytic lesions demonstrate disordered architecture, asymmetry, melanocytic epidermotropism (abnormal spreading into the epidermis), as well as cytological pleomorphism, and atypia.6 Our study concentrated on characterizing cellular (cytometric and morphometric) characteristics and how they compared among different types of melanocytic lesions.
There are many examples in pathology where subjectivity leads to high inter-rater variability. The dermatopathologist is intimately familiar with this type of dilemma, especially in the context of the ongoing arguments over the classification scheme of dysplastic nevi.7 This subjectivity complicates patient treatment and is frustrating for clinicians but even more so for patients who are forced to experience the first person effects of pathological ambiguity. It is our goal to help to clarify this ambiguity while increasing objectivity and reproducibility.
Technology has changed drastically since the historic development of a large framework of dermatopathology knowledge in the last century by Ackerman and others.8,9 Some areas of pathology are increasingly using a combination of computer technology and pathology to make diagnoses. For example, automated quantization has been applied to breast hormone markers10 and is increasingly being used by labs to facilitate this diagnostic process. This use of image analysis in immunohistochemistry has done much to facilitate decision-making in this area.
In this paper we show that image analysis in conjunction with statistical classification can give deep and useful interpretations. The mind of a well-trained pathologist can simultaneously assess dozens if not hundreds of characteristics of a given slide. In order to approximate the human mind, a computer would need to analyze and assess many characteristics of an image and use the composite of this assessment to justify an outcome.11 Our goal is not to replace the pathologist, but to help the pathologist understand what he or she is seeing and also to set a foundation for future endeavors.
Materials and Methods
Case Selection and Annotation
This study was based on a series of 49 hematoxylin and eosin stained slides representing different types of melanocytic lesions. Specifically, of malignant lesions (melanoma), 12 of these slides represented superficial spreading melanoma, 4 slides represented lentigo maligna melanoma, and 5 slides represented a combination of other types of melanoma. Of benign lesions, 11 slides represented conventional nevi, 10 slides represented mildly dysplastic nevi, and 8 slides represented severely dysplastic nevi. These slides were chosen by the groups’ dermatopathologist (JW) from cases seen at University of North Carolina at Chapel Hill (UNC-CH) Hospitals. Figure 1 shows examples of a mildly dysplastic nevi (A), severely dysplastic nevi (B), and superficial spreading melanoma (C). Slides were digitally scanned using Aperio ScanScope. Our dermatopathologist then annotated melanocytic cell groups in each image using Aperio Virtual Slide viewing software. Groups in this context is used to signify collections of multiple melanocytes, often in nests, with little intervening stroma and without a significant component of other cell types (lymphocytes, etc.). Melanocytic groups were annotated near the dermoepidermal junction or superficial dermis of conventional and dysplastic nevi. Melanoma cell groups were chosen which were thought to be representative of the lesion. The outcome was 113 groups of superficial spreading melanoma, 37 groups of lentigo maligna melanoma, and 40 groups representing a combination of other types of melanoma. We annotated 99 groups of conventional nevi, 59 groups of mildly dysplastic nevi, and 54 groups of severely dysplastic nevi. All together we examined 190 groups of melanoma and 212 groups of nevi (49 slides, 402 groups or annotated areas of melanocytic lesions). The study was approved by the internal review board (IRB) of UNC-CH.
Figure 1.
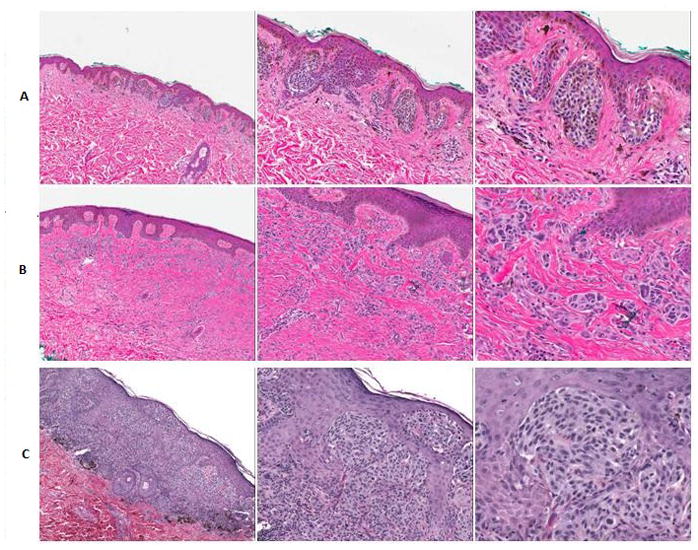
Scanning, intermediate, and high power shots of mildly dysplastic nevi (A), severely dysplastic nevi (B), and superficial spreading melanoma (C).
Standardization
Prior to image analysis, the images were standardized to account for differences in staining intensity and stain fading over time (Figure 2, Figure 3). This was accomplished through mathematical techniques developed by our group which used stain vector variation correction and eliminated secondary differences in stain intensity due to different stains, manufacturers, procedures, and storage time.12,13
Figure 2,3.
High power images of original hematoxylin and eosin stained group of benign melanocytic cells were scanned into Aperio ScanScope (A). All groups underwent a standardization stage to account for differences in staining between slides (B). The image was digitally analyzed and features extracted. An example readily shows such features as calculated nuclear area (referred to as area) and Delaunay triangulation, values which both tended to be larger in melanoma than in nevi (C). An approximation for whole cell borders (referred to as region) was also used (D). Many more features were also analyzed. Figure 2(A–D) demonstrates melanoma cells.
Feature Extraction
Once standardized, images were digitally analyzed in order to extract features. We developed software to segment the nuclei (approximations are referred to as area) and to provide a proxy for cell borders (known as region) for both benign and malignant cell types (Figure 2, Figure 3). Thirty-one quantitative features were then identified. For each feature, the full population was individually transformed as appropriate to make distributions approximately standard Gaussian. Features were summarized over each group using both the mean and standard deviations of 31 features resulting in a total of 62 values or features (Table 1A, descriptions in Table 1B). We refer the reader elsewhere for a description of the Gabor (texture quantification) and Delaunay (based on distances between nuclear centers) features 14,15 as well as Hu moment invariants (which captures aspects of nuclear shape).16
Table 1.
(A) Specifically, 32 features were examined during image analysis. For each feature, the full population was individually transformed as appropriate to make distributions approximately standard Gaussian. Features were summarized over each group using both the mean and standard deviations of 31 features resulting in a total of 62 values or features. (B) A short description of features analyzed is provided. Several of these features have been used or described elsewhere. Area is indicative of an approximated nucleus while region is indicative of an approximated whole cell.
| Table 1A |
|---|
|
| Table 1B |
|---|
|
Statistical Analysis
Once data for each of these characteristics was collected, it was statistically analyzed using DiProPerm analysis. DiProPerm is a nonparametric hypothesis test that is especially well suited to high dimensional data. In this analysis, we use DiProPerm to test the null hypothesis of equal group means. Our initial comparison, chosen a priori, was that of all melanoma to all nevi. We also explored approximately 20 pairwise comparisons between different melanoma versus nevus subtypes. We used a Bonferroni adjustment for multiple comparisons. Four pertinent pathological contexts were then chosen for explicit discussion:
Comparison of all melanoma versus all types of nevi
Comparison of melanoma World Health Organization (WHO) subtypes to all types of nevi
Comparison of lesions classified as severely dysplastic nevi to all other nevi subtypes including conventional nevi and mildly dysplastic nevi
Comparison of all melanoma to severely dysplastic nevi
In each of these contexts we measured the degree of separation using ROC area, assessed the statistical significance using the DiProPerm p-value, and identified which features drove each separation.
Results
During data analysis regarding all melanoma versus all nevi, we found that the histological features which drove the separation between these two subsets were nuclear area, mean Delaunay, convexity, and perimeter ratio(Figure 4A). All of these values were larger in melanoma than in nevi. The ROC area for this context was 0.95, p< 0.0001 (Figure 4B).
We found that dividing melanoma into subtypes produced even greater separation. ROC area for superficial spreading melanoma versus all nevi was 0.98, p < 0.0001. The ROC area for lentigo maligna melanoma versus all nevi was 0.96, p < 0.0001. Finally, the ROC area for all other types of melanoma versus all nevi was 0.99, p < 0.0001.
We also compared severely dysplastic nevi to all other types of nevi. We found that separation of these two data subtypes was driven by differences in the standard deviation of calculated whole cell eosin staining intensities (less in severely dysplastic nevi versus others), average whole cell eosin staining intensities, standard deviation of hematoxylin staining in each whole cell, and mean nuclear area (we called these Std region meanstain 2, Mean region mean stain 2, Mean region Std stain 1 and mean area, Figure 5A). All of these values except the first, Std region mean stain, were greater in severely dysplastic nevi. The ROC area for this data was 0.84, p < 0.0001 (Figure 5B).
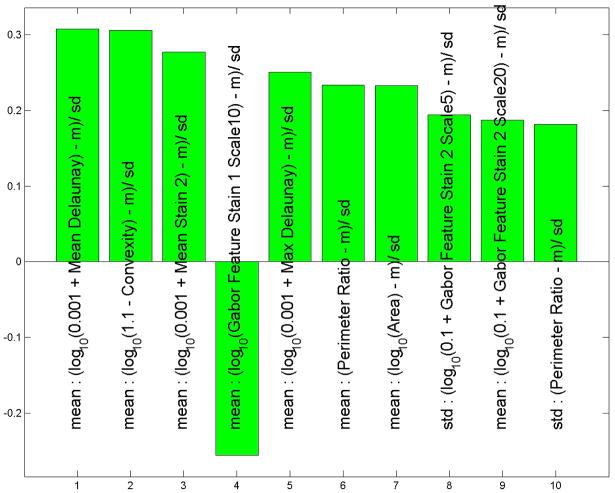
We compared all melanoma to severely dysplastic nevi. We found that separation of these lesions was driven by approximated cell shape features (mean Delaunay, convexity), nuclear eosin staining (mean stain 2), and a nuclear textural feature (mean Gabor stain 1). All of these features were greater in melanoma than in severely dysplastic nevi except for mean Gabor stain 1 (Figure 6A). The ROC area for this data was 0.95, p < 0.0001 (Figure 6B).
Figure 4.
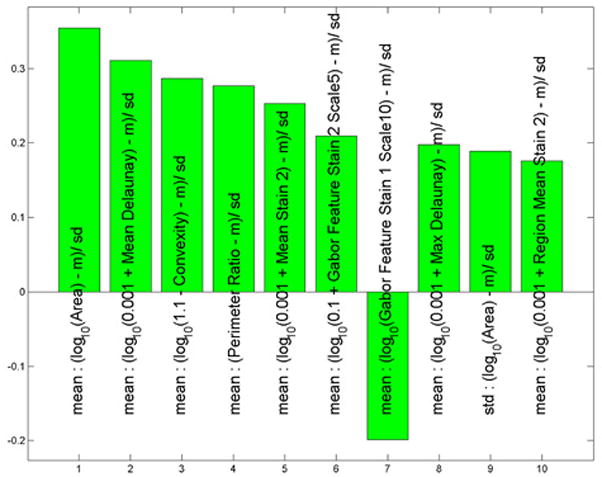
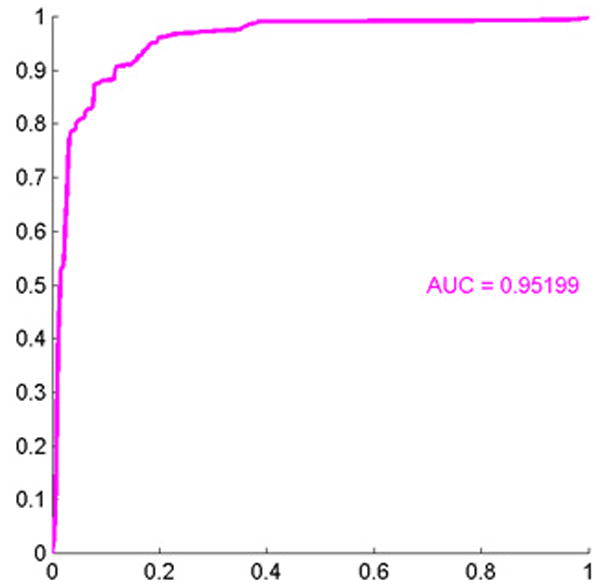
(A) These features were most useful in driving the separation of melanoma from other types of nevi. While the name provided on the bar also indicates statistical transformation, the top four features represent nuclear area, mean Delaunay, convexity, and perimeter ratio (top 10 features are shown). (B) Area under the receiver operator characteristics (ROC) curve of 0.95, p < 0.0001.
Figure 5.
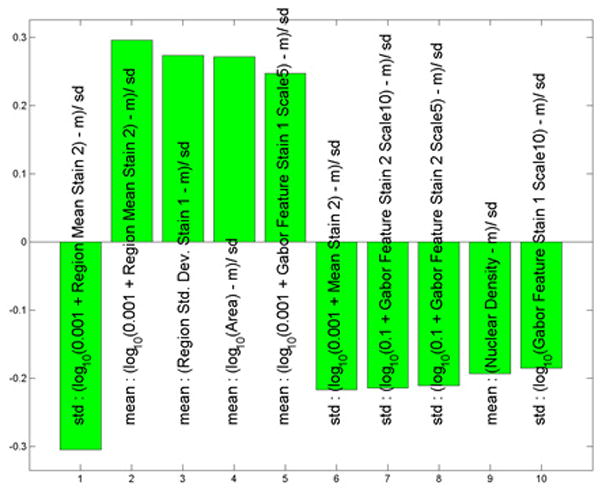
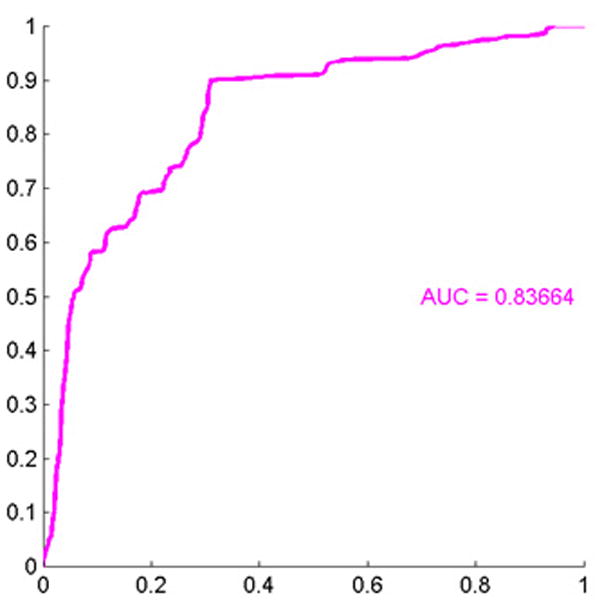
(A) These features were most useful in driving the separation of severely dysplastic nevi from other types of nevi. While the name provided on the bar also indicates statistical transformation, the top four features represent differences in the standard deviation of calculated whole cell eosin staining intensities (calculated whole cell called region and staining differences are less in severely dysplastic nevi than in others others), average eosin staining intensities, average standard deviation of hematoxylin nuclear staining in each nuclei (calculated nuclei is called area) and mean nuclear area. (B) Area under the receiver operator characteristics (ROC) curve of 0.84, p < 0.0001.
Figure 6.
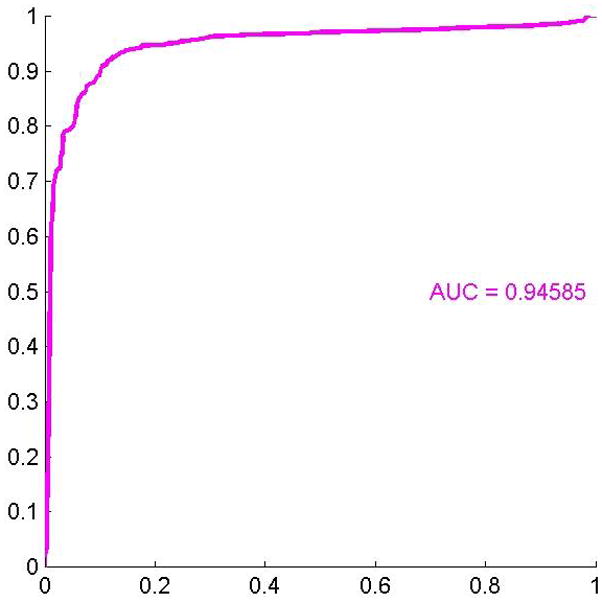
(A) These features were most useful in driving the separation of melanoma from severely dysplastic nevi. While the name provided on the bar also indicates statistical transformation, the top four features represent approximated cell shape features (mean Delaunay, convexity), nuclear eosin staining (mean stain 2), and a nuclear textural feature (mean Gabor stain 1). The top 10 features are shown. (B) Area under the receiver operator characteristics (ROC) curve of 0.95, p < 0.0001.
Discussions/Conclusions
During our analysis we found that the features which best separated malignant melanoma from nevi were:
mean area nuclear area; greater in melanoma
mean Delaunay (the mean edge length of a triangulation based on the cell centers); greater in melanoma
mean convexity (a measure of the convexity of the segmented nucleus); greater in melanoma
mean perimeter ratio [the ratio of the length of the nuclear perimeter to the square root of the area (nuclear) which indicates irregularity of nuclear boundary]; greater in melanoma
Further, we found that this separation was improved by dividing melanoma into subtypes. Each subtype of melanoma had a larger ROC area when compared to nevi than when all melanomas were included together. Features that best differentiated severely dysplastic nevi from other nevi and mildly dysplastic nevi were:
Std region mean stain 2 (differences in eosin staining intensities between whole cell regions). We found that severely dysplastic nevi demonstrated less variability, i.e. lower standard deviation, in whole cellular eosin staining than other types.
Mean region mean stain 2 (mean eosin staining intensities of the region). We found that severely dysplastic nevi demonstrated greater average eosin staining of the approximated whole cell region than other types of nevi.
Mean region Std1 stain 1 (the larger this value, the more hematoxylin staining variability there is in the whole cell region of each cell in that type of lesion). This value was greater in severely dysplastic nevi.
Mean area (nuclear area)was greater in severely dysplastic nevi.
Finally, separation of melanoma from severely dysplastic nevi was driven by:
Mean Delaunay (the mean edge length of a triangulation based on the cell centers); greater in melanoma.
mean convexity (a measure of the convexity of the segmented nucleus); greater in melanoma
Mean stain 2 (mean eosin staining intensities of the area). We found that severely dysplastic nevi demonstrated greater average eosin staining of the area (approximated nuclei) than severely dysplastic nevi.
Mean Gabor stain 1 (textural differences of the nuclei)was greater in severely dysplastic nevi and also drove separation of these two entities.
Of course, while the features listed above drove separation of these lesion types most significantly, true separation and hence ROC areas were derived from a composite of all features. One might have hoped that one dominant feature be adequate to classify lesions, however this is not the case. In fact many features are needed for effective separation and are accounted for in our method.
Some of our results confirm intuitive expectations. For example, mean nuclear area, mean Delaunay, mean convexity and mean perimeter ratio being greater in melanoma compared with nevi is very reasonable and correlates with the subjective experience of the pathologist in comparing many melanomas to benign lesions. The separation we obtained between individual melanoma subtypes and nevi, which was greater when we included all melanomas together as a whole, seems quite natural also. This is because slightly different features may drive the traditional diagnosis of melanoma subtypes6 which, when taken in aggregate, diminishes the strength of any one feature.
Our analysis regarding the separation of severely dysplastic from mildly dysplastic nevi reveals properties which are more difficult for the pathologist to visually assess: we found the standard deviation of nuclear staining intensities and average staining intensities to be significant driving forces while more easily conceptualized features like standard deviation of area and mean nuclear area played a secondary role. On the other hand, the longstanding disagreement over dysplastic nevi cytology may be related to the fact that these important features are visually difficult to assess. What is unique about our analysis is that we need not rely on any one feature to independently separate these lesions; instead we are simultaneously using 62 features to cause the greatest distinction possible. This is of extreme importance and a major difference between our study and previous cytometric analyses.
The separation between melanoma and severely dysplastic nevi is used by some clinicians to determine clinical management. Therefore, an objective method to help separate these entities may aid in clinical management. We found that these two entities were separated by calculated nuclear shape features (mean Delaunay, convexity, greater in melanoma) and by features approximating nuclear eosin staining (Mean stain 2) and texture (Mean Gabor stain 1, greater in dysplastic nevi). Moreover, combining all 62 features yields powerful separation (p < 0.0001).
There is relatively little literature that has attempted this level of analysis of melanocytic lesions. Several papers have used image analysis to clarify the debate regarding the presence or absence of cytological atypia in dysplastic nevi. A 1990 paper17 contributed to the question of whether dyplastic nevi exhibited cytological changes by looking at four morphological characteristics (nuclear area, standard deviation of nuclear area, nuclear roundness, standard deviation of nuclear roundness). They found the standard deviation of nuclear area, mean nuclear roundness, and standard deviation of nuclear roundness to be significantly greater for dysplastic nevi than for conventional nevi. They also found that melanoma differed significantly from dysplastic nevi in mean nuclear area, standard deviation of nuclear area, mean ploidy, and standard deviation of ploidy.17 While their paper used different methods to examine different characteristics, it is interesting to compare their principal findings with ours. One of their principal findings was that the nuclear area was greater in melanoma than in nevi, which was consistent with our results. This group also compared melanoma to dysplastic nevi and found that mean nuclear area and standard deviation of nuclear area were significantly greater for melanoma than dysplastic nevi. In our study, we found that the greatest factor differentiating melanoma from all types of nevi was mean nuclear area and that standard deviation of nuclear area played a significant but secondary role. Other investigators have also found that mean nuclear area is greater for melanoma and severely dysplastic nevi than other types of nevi,18
Another paper emphasized the importance of texture in the evaluation of melanocytic lesions.19 Textural features are subtle and are often emphasized less than other features; however, we also utilized texture (measured by standard deviation of stain as well as Gabor features in our analysis) and found that it was important in helping to drive the separation of categories. Despite differences in design, setup, and goals making direct comparison difficult, our major findings were largely consistent with these earlier works. We have built upon these findings and taken them in new directions. In particular our analysis is strengthened by the use of new and sophisticated color normalization/standardization techniques with advanced statistical and computational techniques that examine many features that have not previously been evaluated.
As with any study, ours has its limitations. For example, we use a data set that focuses on cytological rather than architectural features. It is widely recognized that architectural features are important for the diagnosis and differentiation of benign from dysplastic nevi from malignant melanoma. In many cases architectural features may outweigh cytological differences. A second caveat to our analysis is that the features that we have highlighted as being important differences between these types of lesions are strictly what the computer views as being important differences. It may be that when the pathologist looks at these lesions he sees these features only subconsciously, or not at all. This is especially true for less intuitive features, like standard deviation of staining intensities. Third, it is well known that melanoma can take on a variety of types and we have selected some of the more common types to use in our analysis. Some of the most difficult diagnostic dilemmas occur when examining Spitz or Spitzoid lesions, a group of lesions that our study does not include. However, the comparisons we did make with more typical lesions were strongly statistically significant. We think that Spitzoid lesions and other less common presentations would be an interesting area of study for the future; however, for this study we chose to focus on lesions of indisputable diagnosis. One final important caveat is that while there is generally little ambiguity between melanoma versus conventional nevi, there are more differences of opinion when grading dysplastic nevi into mild and severe. While the diagnosis of the dysplastic nevi can be in most cases made architecturally, we cannot rule out the notion that during the grading process different pathologists might not have subcategorized the lesions exactly as we did, thereby adding a minimal level of subjectivity to the results of our third comparison.
In ordinary life, we are used to thinking of things in three dimensions. When thinking about our data, we think about it in 62 dimensions, with each dimension being an image feature. We are then able to take all of these features in composite to best analyze the data. In our current application we are looking to separate melanoma from nevi and dysplastic nevi from conventional and mildly dysplastic nevi. One might hope for a single “magic bullet” feature would give 100% separation between groups of melanocytic entities. Unfortunately this does not exist. Instead, a composite of multiple features provides the best separation. Computational analysis allows for the comparison of multiple features to obtain a substantial degree of separation.
With increasing technology and better software, the application of this type of analysis becomes more and more practical and it follows that the use of digital analysis to aid in the interpretation of histological images is an aspect of pathology that should only increase in the future. This motivates the need to study, improve, and explore such analysis. Our study is unique in its utilization of sophisticated methods to study melanocytic histology. This analysis can be thought of as not only “food for thought” for the pathologist, but also as part of a foundation for future studies to come.
An additional future utilization of digital imaging may be to help predict prognosis, as has been done to renal and bladder cancers.20,21 Image analysis may also aid in the prediction of presence of mutations and subsequently to help to predict which melanomas will respond to certain types of treatments. Work is currently being done to improve the traditional classification of melanoma by forming subgroups that are genetically more homogeneous and therefore more significant from a bench and clinical viewpoint.22,23 Much of the recent research in melanoma has gravitated toward using specific drugs for lesions with specific mutations.24 New medications are under study for selectively treating patients with melanomas with particular mutations, and in the future this approach may provide therapeutic benefit and improve survival. It is possible that image analysis could help in the prediction of mutation status. Using the experience we have gained during this analysis, these are concepts we hope to explore in the future.
Acknowledgments
This work was supported, in part, by the University Cancer Research Fund, Lineberger Comprehensive Cancer Center, University of North Carolina, Chapel Hill, NC, CA112243, CA11243-05S109, and P30ES010126. Susan Wei was supported by an NSF Graduate Fellowship and NIH Predoctoral Training Program in Bioinformatics and Computational Biology, T32 GM067553-05S1. Marc Niethammer was supported by NIH NIBIB 5P41EB002025-27.
References
- 1.Cho YR, Chiang MP. Epidemiology, staging (new system), and prognosis of cutaneous melanoma. Clin Plast Surg. 2010 Jan;37(1):47–53. doi: 10.1016/j.cps.2009.07.001. [DOI] [PubMed] [Google Scholar]
- 2.Fleming MG. Pigmented lesion pathology: what you should expect from your pathologist, and what your pathologist should expect from you. Clin Plast Surg. 2010 Jan;37(1):1–20. doi: 10.1016/j.cps.2009.07.003. [DOI] [PubMed] [Google Scholar]
- 3.Troxel DB. Medicolegal aspects of error in pathology. Arch Pathol Lab Med. 2006 May;130(5):617–619. doi: 10.5858/2006-130-617-MAOEIP. [DOI] [PubMed] [Google Scholar]
- 4.Culpepper KS, Granter SR, McKee PH. My approach to atypical melanocytic lesions. J Clin Pathol. 2004 Nov;57(11):1121–1131. doi: 10.1136/jcp.2003.008516. [DOI] [PMC free article] [PubMed] [Google Scholar]
- 5.Zembowicz A, Ahmad A, Lyle SR. A comprehensive analysis of a web-based dermatopathology second opinion consultation practice. Arch Pathol Lab Med. 2011 Mar;135(3):379–383. doi: 10.5858/2010-0187-OA.1. [DOI] [PubMed] [Google Scholar]
- 6.Smoller BR. Histologic criteria for diagnosing primary cutaneous malignant melanoma. Mod Pathol. 2006 Feb;19( Suppl 2):S34–40. doi: 10.1038/modpathol.3800508. [DOI] [PubMed] [Google Scholar]
- 7.Friedman RJ, Farber MJ, Warycha MA, Papathasis N, Miller MK, Heilman ER. The “dysplastic” nevus. Clin Dermatol. 2009 Feb;27(1):103–115. doi: 10.1016/j.clindermatol.2008.09.008. [DOI] [PubMed] [Google Scholar]
- 8.Hollander AW. Development of dermatopathology and Paul Gerson Unna. J Am Acad Dermatol. 1986 Oct;15(4 Pt 1):727–734. doi: 10.1016/s0190-9622(86)80116-5. [DOI] [PubMed] [Google Scholar]
- 9.Weyers WA. Bernard Ackerman--the “Legend” turns 70. J Am Acad Dermatol. 2009 Mar;60(3):525–529. doi: 10.1016/j.jaad.2009.01.010. [DOI] [PubMed] [Google Scholar]
- 10.Hatanaka Y, Hashizume K, Nitta K, Kato T, Itoh I, Tani Y. Cytometrical image analysis for immunohistochemical hormone receptor status in breast carcinomas. Pathol Int. 2003 Oct;53(10):693–699. doi: 10.1046/j.1440-1827.2003.01547.x. [DOI] [PubMed] [Google Scholar]
- 11.Gil J, Wu H-S. Applications of image analysis to anatomic pathology: realities and promises. Cancer Invest. 2003;21(6):950–959. doi: 10.1081/cnv-120025097. [DOI] [PubMed] [Google Scholar]
- 12.Macenko M, Niethammer M, Marron JS, Borland D, Woosley JT, Guan X, Schmitt C, Thomas NE. A method for normalizing histology slides for quantitiative analysis. Proceedings of the International Symposium on Biomedical Imaging (ISBI) 2009:1107–1110. [Google Scholar]
- 13.Niethammer M, Borland D, Marron JS, Woolsey J, Thomas NE. Appearance Normalization of Histology Slides. MICCAI, International Workshop Machine Learning in Medical Imaging; 2010. [DOI] [PMC free article] [PubMed] [Google Scholar]
- 14.Doyle S, Hwang M, Shah K, Madabhushi A, Feldman M, Tomaszeweski J. Automated grading of prostate cancer using architectural and textural image features. Biomedical Imaging: From Nano to Macro, 2007 ISBI 2007; 4th IEEE International Symposium on. 2007; pp. 1284–1287. [Google Scholar]
- 15.Doyle S, Madabhushi A, Feldman M, Tomaszeweski J. A boosting cascade for automated detection of prostate cancer from digitized histology. Med Image Comput Comput Assist Interv. 2006;9(Pt 2):504–511. doi: 10.1007/11866763_62. [DOI] [PubMed] [Google Scholar]
- 16.Ming-Kuei Hu. Visual pattern recognition by moment invariants. IEEE Trans Inform Theory. 1962 Feb;8(2):179–187. [Google Scholar]
- 17.Fleming MG, Wied GL, Dytch HE. Image analysis cytometry of dysplastic nevi. J Invest Dermatol. 1990 Sep;95(3):287–291. doi: 10.1111/1523-1747.ep12484922. [DOI] [PubMed] [Google Scholar]
- 18.Bruijn JA, Berwick M, Mihm MC, Jr, Barnhill RL. Common acquired melanocytic nevi, dysplastic melanocytic nevi and malignant melanomas: an image analysis cytometric study. J Cutan Pathol. 1993 Apr;20(2):121–125. doi: 10.1111/j.1600-0560.1993.tb00227.x. [DOI] [PubMed] [Google Scholar]
- 19.Fleming MG, Friedman RJ. Multiparametric image cytometry of nevi and melanomas. Am J Dermatopathol. 1993 Apr;15(2):106–113. doi: 10.1097/00000372-199304000-00002. [DOI] [PubMed] [Google Scholar]
- 20.Carducci MA, Piantadosi S, Pound CR, Epstein JI, Simons JW, Marshall FF, et al. Nuclear morphometry adds significant prognostic information to stage and grade for renal cell carcinoma. Urology. 1999 Jan;53(1):44–49. doi: 10.1016/s0090-4295(98)00440-3. [DOI] [PubMed] [Google Scholar]
- 21.Blomjous CE, Vos W, Schipper NW, Uyterlinde AM, Baak JP, de Voogt HJ, et al. The prognostic significance of selective nuclear morphometry in urinary bladder carcinoma. Hum Pathol. 1990 Apr;21(4):409–413. doi: 10.1016/0046-8177(90)90203-h. [DOI] [PubMed] [Google Scholar]
- 22.Broekaert SMC, Roy R, Okamoto I, van den Oord J, Bauer J, Garbe C, et al. Genetic and morphologic features for melanoma classification. Pigment Cell Melanoma Res. 2010 Dec;23(6):763–770. doi: 10.1111/j.1755-148X.2010.00778.x. [DOI] [PMC free article] [PubMed] [Google Scholar]
- 23.Curtin JA, Fridlyand J, Kageshita T, Patel HN, Busam KJ, Kutzner H, et al. Distinct sets of genetic alterations in melanoma. N Engl J Med. 2005 Nov 17;353(20):2135–2147. doi: 10.1056/NEJMoa050092. [DOI] [PubMed] [Google Scholar]
- 24.Flaherty KT, Hodi FS, Bastian BC. Mutation-driven drug development in melanoma. Curr Opin Oncol. 2010 May;22(3):178–183. doi: 10.1097/cco.0b013e32833888ee. [DOI] [PMC free article] [PubMed] [Google Scholar]


