Abstract
We define previously unrecognized in vivo pathways of vitamin D3 (D3) metabolism generating novel D3-hydroxyderivatives different from 25-hydroxyvitamin D3 [25(OH)D3] and 1,25(OH)2D3. Their novel products include 20-hydroxyvitamin D3 [20(OH)D3], 22(OH)D3, 20,23(OH)2D3, 20,22(OH)2D3, 1,20(OH)2D3, 1,20,23(OH)3D3, and 17,20,23(OH)3D3 and were produced by placenta, adrenal glands, and epidermal keratinocytes. We detected the predominant metabolite [20(OH)D3] in human serum with a relative concentration ∼20 times lower than 25(OH)D3. Use of inhibitors and studies performed with isolated mitochondria and purified enzymes demonstrated involvement of the steroidogenic enzyme cytochrome P450scc (CYP11A1) as well as CYP27B1 (1α-hydroxylase). In placenta and adrenal glands with high CYP11A1 expression, the predominant pathway was D3 → 20(OH)D3 → 20,23(OH)2D3 → 17,20,23(OH)3D3 with further 1α-hydroxylation, and minor pathways were D3 → 25(OH)D3 → 1,25(OH)2D3 and D3 → 22(OH)D3 → 20,22(OH)2D3. In epidermal keratinocytes, we observed higher proportions of 22(OH)D3 and 20,22(OH)2D3. We also detected endogenous production of 20(OH)D3, 22(OH) D3, 20,23(OH)2D3, 20,22(OH)2D3, and 17,20,23(OH)3D3 by immortalized human keratinocytes. Thus, we provide in vivo evidence for novel pathways of D3 metabolism initiated by CYP11A1, with the product profile showing organ/cell type specificity and being modified by CYP27B1 activity. These findings define the pathway intermediates as natural products/endogenous bioregulators and break the current dogma that vitamin D is solely activated through the sequence D3 → 25(OH)D3 → 1,25(OH)2D3.—Slominski, A. T., Kim, T.-K., Shehabi, H. Z., Semak, I., Tang, E. K. Y., Nguyen, M. N., Benson, H. A. E., Korik, E., Janjetovic, Z., Chen, J., Yates, C. R., Postlethwaite, A., Li, W., Tuckey, R. C. In vivo evidence for a novel pathway of vitamin D3 metabolism initiated by P450scc and modified by CYP27B1.
Keywords: 20-hydroxyvitamin D, CYP11A1, placenta, adrenals, keratinocytes
Epidermal keratinocytes of the human skin represent the main site for the photoinduced formation of vitamin D3 (D3) from cholesta-5,7-dien-3β-ol [7-dehydrocholesterol (7DHC); refs. 1–3], which is subsequently hydroxylated at positions C25 and C1 to produce biologically active 1,25-dihydroxyvitamin D3 [1,25(OH)2D3] (D3 → 25-hydroxyvitamin D3 [25(OH)D3] → 1,25(OH)2D3). At the systemic level, 25(OH)D3 is predominantly produced in the liver, with its further transformation to 1,25(OH)2D3 occurring in the kidney (4, 5). Both reactions also occur at the local level, including skin (2). 1,25(OH)2D3, in addition to regulating calcium metabolism, plays an important role in the formation of the skin barrier and of the adnexal structures and has a wide variety of ameliorating effects on cancer and proliferative and inflammatory skin diseases (3–6). 1,25(OH)2D3 at pharmacological doses is toxic because of the resulting hypercalcemia, which limits its clinical utility.
Recently, it was demonstrated that cytochrome P450scc (CYP11A1) can perform the oxidation and cleavage of the side chain of 7DHC to produce 7-dehydropregnenolone (7DHP) (7–9) and the hydroxylation of the side chain of D3 without its cleavage (9–12). Specifically, purified P450scc hydroxylates D3 in a sequential manner at positions C17, C20, C22, and C23 to produce ≥10 metabolites, with 20-hydroxyvitamin D3 [20(OH)D3], 22-hydroxyvitamin D3 [22(OH)D3], 20,23-dihydroxyvitamin D3 [20,23(OH)2D3], 20,22-dihydroxyvitamin D3 [20,22(OH)2D3], and 17,20,23-trihydroxyvitamin D3 [17,20,23(OH)3D3] serving as the main products. It also transforms 1-hydroxyvitamin D3 [1(OH)D3] to 1,20-dihydroxyvitamin D3 [1,20(OH)2D3] (11–13) and can act on plant-derived vitamin D2, producing 20(OH)D2, 17,20(OH)2D2, and 17,20,24(OH)3D2 (14, 15). The main products of the above vitamin D metabolism can also be hydroxylated in position 1α by CYP27B1, as demonstrated by in vitro enzymatic assays, however, with significantly lower efficiency than 25(OH)D3 (16–18). The products of this in vitro enzymatic catalysis, including 20(OH)D3, 20,23(OH)2D3, 17,20,23(OH)3D3, and 20(OH)D2 and 17,20(OH)2D2, as well as their 1α-hydroxyderivatives, are biologically active, with a potency defined by the cell lineage, and are at least as potent as the classical 1,25(OH)2D3 in skin cells, with antiproliferative, prodifferentiation, anticancer, and antiinflammatory properties (13, 14, 19–22). Moreover, 20(OH)D3 and 20(OH)D2 are nontoxic in rodents at doses as high as 30 μg/kg, which defines them as potential therapeutic agents for hyperproliferative, fibrosing, or inflammatory disorders, or as adjuvants in cancer therapy (17, 19, 23).
In addition to the adrenal glands, the most active steroidogenic organ, CYP11A1 is also expressed in the placenta (24) and the skin, initiating local steroidogenic pathways, although at lower rates of transformation (7). Therefore, to establish whether the above putative pathway of vitamin D activation can also operate in vivo, we tested the ability of the human placenta, human and pig epidermal keratinocytes, and rat and bovine adrenal glands to metabolize D3 in a P450scc-dependent manner.
MATERIALS AND METHODS
Human subject and animal protocols
All studies involving specimens from humans were obtained through protocols approved by institutional review boards at participating institutions. All studies involving animals followed protocols approved by institutional animal care and use committees at the participating institutions.
Experiments with human placentas
Ex utero incubations with human placentas
For ex utero incubations, term human placentas (37–42 wk) were obtained from MedPlex (Memphis, TN, USA); for isolation of mitochondria, they were obtained from King Edward Memorial Hospital for Women (Subiaco, WA, Australia). The incubations of placental fragments or isolated mitochondria followed modifications of the protocols described previously (8, 10). Briefly, after dissection from the membranes, the placental fragments were cut with scissors into small fragments; washed with PBS; suspended in buffer (pH 7.4) containing 33 mM Tris aminomethane, 110 mM NaCl, 5 mM KCl, 2.5 mM CaCl2, 1 mM MgSO4, 1 mM KH2PO4, and 2 mg/ml glucose; and incubated with D3 as described previously (8). Briefly, 2–3 placentas were used for each experiment, with a total of 40 placentas used. The incubations were initiated by the addition of isocitrate (0.5 mM) and D3 (Sigma Chemical Co., St. Louis, MO, USA) up to 0.2 mM (as indicated in the figure legends) and incubated at 37°C for 20 h. In control experiments, either substrates were omitted from the incubation mixture or placental fragments were boiled 5 min prior to addition of substrates. After placing the tubes on ice, secosteroids were extracted with dichloromethane and dried under nitrogen.
Reverse-phase high-pressure liquid chromatography (RP-HPLC) and mass spectrometry (MS) analyses
RP-HPLC of the above samples was performed using a dual-pump chromatography system (Waters 2695 Alliance; Waters, Milford, MA, USA) equipped with a Waters Atlantis dC18 column (100×4.6 mm, 5-μm particle size). To detect the vitamin D hydroxymetabolites, a gradient of methanol in water (85–100%) was used for elution at a flow rate of 0.5 ml/min (20 min), followed by a wash with 100% methanol (10 min). Fractions were monitored with a photodiode array or UV wavelength detector at 265 nm (Waters 996) and collected manually for further MS analyses. The collected samples were analyzed using an API-4000 LC-MS/MS mass spectrometer (Applied Biosystems, Toronto, ON, Canada) equipped with an electrospray ionization (ESI) source in positive mode at the condition of declustering potential, 80 V; entrance potential, 10 V; ion spray voltage, 4.5 kV.
To further separate and identify dihydroxyvitamin D3 metabolites, the samples were analyzed on an API-3000 LC-MS/MS mass spectrometer (Applied Biosystems) equipped with an ESI source and a Zorbax Eclipse Plus C18 column (2.1×50 mm, 1.8-μm particle size; Agilent Technology, Santa Clara, CA, USA). A gradient of 65 to 100% methanol was applied over 20 min at flow rate of 0.075 ml/min to determine the relative quantity of the different dihydroxyderivatives of D3. The relative concentrations of products were calculated from the areas of HPLC peaks in relation to standard curves generated using the corresponding hydroxyvitamin D3 standards. Values are presented as means ± sd (n=3).
Separation of 20,22(OH)2D3 and 20,23(OH)2D3
20,22(OH)2D3 and 20,23(OH)2D3 were separated by RP-HPLC using a Waters C18 column (250×4.6 mm, 5-μm particle size). Elution was carried out with a gradient of acetonitrile in water (40–100%) at a flow rate of 0.5 ml/min (15 min), followed by a wash with 100% acetonitrile for 30 min at flow rate of 0.5 ml/min and for 20 min at a flow rate of 1.5 ml/min. The separated 20,22(OH)2D3 and 20,23(OH)2D3 were analyzed with an API-4000 LC-MS/MSmass spectrometer equipped with an ESI source. LC was performed under isocratic conditions using 96% methanol in water at a flow rate of 0.05 ml/min for 15 min using a Zorbax Eclipse Plus C18 column (2.1×50 mm, 1.8-μm particle size).
Incubations with isolated mitochondria from placenta
Mitochondria were prepared from the human placenta as described before and were disrupted by sonication prior to use (25). Mitochondria (4.4 mg/ml) were incubated in buffer comprised of 50 mM HEPES (pH 7.4), 0.25 M sucrose, 20 mM KCl, 5 mM MgSO4, 10 μM adrenodoxin, 0.3 μM adrenodoxin reductase, and 0.5 mg/ml bovine serum albumin (fatty acid free) in a final volume of 12.0 ml. Mitochondria were preincubated at 37°C for 8 min, then D3 or its hydroxyderivative (dissolved in 2-hydroxypropyl-β-cyclodextrin) was added to a final concentration of 200 μM (final 2-hydroxypropyl-β-cyclodextrin concentration of 0.45%). Reactions were then started immediately by the addition of isocitrate and NADP, to final concentrations of 5 mM and 500 μM, respectively. Reactions were performed for 4 h, then terminated by the addition of 24 ml ice-cold dichloromethane. After centrifugation to separate phases, the lower dichloromethane phase was retained, and the aqueous phase was reextracted twice more with 24 ml dichloromethane. The dichloromethane was removed under nitrogen, and the extract was applied as a band to a 20- × 20-cm × 0.2-mm silica gel 60 plate using three 200-μl aliquots of chloroform. Authentic standards were run separately as spots on either side of the plate, using a similar procedure to that described before (10). Plates were developed 3 times in hexane/ethyl acetate (3:1 v/v), and sections of the plate containing standards were removed, sprayed with a solution of 2 mM FeSO4 containing 5% concentrated sulfuric acid and 5% glacial acetic acid, and then charred by heating to reveal the position of standards. These strips were then aligned with the remainder of the plate, the areas corresponding to the authentic standards were removed, and products were eluted from the silica gel with three 15-ml aliquots of trichloromethane/methanol (1:1, v/v). The solvent was removed under nitrogen at 30°C and samples dissolved in solvent for LC-MS/MS. This procedure was carried out using an API-4000 LC-MS/MS system (see above) equipped with an ESI source in positive mode at the condition of declustering potential, 80 V; entrance potential, 10 V; ion spray voltage, 4.5 kV. LC was carried out with a C18 Agilent Stable Bond column (250×4.6 mm, 3.5-μm particle size). The mobile phase consisted of a gradient from 35% acetonitrile plus 0.1% formic acid in water to 100% acetonitrile plus 0.1% formic acid over 60 min at 1 ml/min. The transitions used to monitor products in the multiple reaction monitoring (MRM) mode were m/z 401 (M+1) to 273 for 20(OH)D3 and m/z 401 (M+1) to 383 for 25(OH)D3, which represent the major transitions seen in authentic standards.
In vitro P450scc assay
Human cytochrome P450scc was expressed in Escherichia coli and purified as before (26) P450scc (2 μM) was incubated with 200 μM D3 (dissolved in 2-hydroxypropyl-β-cyclodextrin, 0.45% final concentration), in a reconstituted system containing adrenodoxin (10 μM), adrenodoxin reductase (0.3 μM), and NADPH (10 μM) for 2 h at 37°C, in a similar fashion to that described before (26). The reactions were stopped, and products were extracted as for placental mitochondria. HPLC analysis was carried out on a Grace Alltima C18 column (250 mm × 4.6 mm, 5 μm particle size; Grace Davison, Columbia, MD, USA) with the UV monitor set at 265 nm. The mobile phase was a gradient of 55 to 100% acetonitrile in water for 15 min at 0.5 ml/min, followed by 100% acetonitrile at 0.5 ml/min for 30 min, then at 1.5 ml/min for 15 min. Products were identified from their retention time (RT) compared to authentic standards, originally prepared using bovine P450scc (12).
Experiments with adrenal glands
D3 metabolism by rat adrenals
Female Wistar rats (180–200 g) were used, following methods described previously (8). A stock solution of D3 (5 mM) was prepared in 45% 2-hydroxypropyl-β-cyclodextrin immediately before use. Adrenal gland fragments were incubated in Tris-buffered medium for tissues (110 mM NaCl, 5 mM KCl, 2.5 mM CaCl2, 1 mM MgSO4, 1 mM KH2PO4, and 33 mM Tris-HCl, pH 7.4) with 0.2 mM D3 and 5 mM isocitrate in a shaking water bath at 37°C for 4 h. Control incubations with boiled adrenal gland fragments were included. Reactions were stopped by adding dichloromethane and homogenizing the adrenal gland fragments with a glass homogenizer, followed by centrifugation and 2 extraction steps with dichloromethane. The dichloromethane layers were combined and dried in a rotational vacuum concentrator (RVC 2-18; Martin Christ GmbH, Osterode am Harz, Germany). The residues were dissolved in methanol and subjected to LC-MS analysis.
LC-MS analysis was performed on a high-performance liquid chromatograph (LC–MS QP8000a; Shimadzu, Kyoto, Japan) equipped with diode array and single-quadrupole MS detectors using an EC 50/4.6 Nucleodur C18 ISIS column with 1.8-μm particle size (Macherey-Nagel GmbH & Co. KG, Düren, Germany). Elution was performed at a flow rate of 0.5 ml/min and temperature of 40°C by a linear gradient from 65 to 100% of methanol (0–7 min), followed by 100% of methanol from 7 to 10 min.
The mass spectrometer was operated in the atmospheric pressure chemical ionization, positive-ion mode with nitrogen as the nebulizing gas. The MS parameters were as follows: nebulizer gas flow rate 2.5 L/min; probe high voltage, 2.5 kV; probe temperature, 400°C; curved desolvation line (CDL) heater temperature, 230°C; CDL voltage, −60 V; and voltage of all deflectors, 30 V. Analyses were performed in the scan mode from m/z 250 to 450.
D3 metabolism by bovine adrenal mitochondria
The mitochondrial fraction from bovine adrenal glands, obtained from the slaughterhouse, was prepared by homogenizing the tissue in 5 vol of ice-cold 0.25 M sucrose. The homogenate was centrifuged at 1200 g for 15 min at 4°C, and the resulting supernatant was removed and centrifuged again at 12,000 g for 20 min at 4°C. The pellet was resuspended in 0.25 M sucrose, and the centrifugation was repeated under the same conditions. The washed mitochondrial fraction was resuspended in 0.25 M sucrose and used directly for the studies on D3 metabolism. Incubations of bovine mitochondria with D3 were carried out as described above for placental mitochondria. Samples were subjected to LC-MS/MS analysis, also as described for placental mitochondria.
Experiments with cultured keratinocytes
Human epidermal keratinocytes (HaCaT line) were cultured as described previously (22). The pig epidermal keratinocytes were isolated from the skin of 2-yr-old, female, white pigs bred at Nicole Farm (Memphis, TN, USA). The pigs were killed at the animal care unit of the University of Tennessee Health Science Center. The epidermal keratinocytes were isolated following protocols used for isolation of human primary keratinocytes (27).
To test the conversion of D3 to hydroxylated derivatives, human or pig skin keratinocytes were incubated with 50 μM D3 in Tris-buffered medium (110 mM NaCl, 5 mM KCl, 2.5 mM CaCl2, 1 mM MgSO4, 1mM KH2PO4, and 33 mM Tris-HCl, pH7.4) containing 5 mM isocitrate, 0.5 mM NADPH, and 0.2% glucose, for 16 h. The incubation mixtures were then extracted twice with 2.5 vol of dichloromethane, redissolved in methanol, and separated by HPLC with a gradient of methanol in water (85–100%) for 20 min and 100% methanol for 10 min, at a flow rate of 0.5 ml/min. The fractions with RT corresponding to 20(OH)D3, 22(OH)D3, 20,23(OH)2D3, and 1,25(OH)2D3 standards were collected and further analyzed by an API-3000 LC-MS/MS (see above) with separations performed isocratically using 96% methanol in water at a flow rate of 0.05 ml/min for 15 min on a Zorbax Eclipse Plus C18 column (see above). Conditions for separation of 20,23(OH)2D3 from 20,22(OH)2D3 and their detection are described above.
Blood collection and analysis of the human serum
After informed consent, blood was obtained by veinpuncture of the antecubital vein of healthy volunteers during the month of August. Blood was collected into three 10-ml glass Vacutainer tubes (Becton Dickinson, Franklin Lakes, NJ, USA). The blood was allowed to clot at room temperature for 1 h, after which the blood-filled Vacutainer tubes were centrifuged at 200 g for 10 min. Serum was then carefully collected from each tube using a sterile plastic pipette and transferred to sterile 15-ml polystyrene conical tubes.
The human serum proteins were precipitated by 90% cold methanol and centrifuged at 8000 g for 20 min. The supernatant was dried in a vacuum concentrator (SpeedVac, SC110A; Thermo Savant, Waltham, MA, USA) or under a stream of N2. The dried sample was redissolved in methanol for HPLC analysis. For the first purification of 25(OH)D3 and 20(OH)D3, a Waters C18 column (250×4.6 mm) was used with a gradient of 85–100% methanol in water for 20 min, then 100% methanol for 10 min, at a flow rate of 0.5 ml/min. Fractions collected corresponding to 25(OH)D3 and 20(OH)D3 standards were analyzed by MS using an API-4000 LC-MS/MS system equipped with an ESI source in positive mode, with a declustering potential of 80 V, an entrance potential of 10 V, and an ion spray voltage of 4.5 kV. The fractions collected from the first column were analyzed further on the same column under isocratic conditions with 100% methanol as solvent, at a flow rate of 0.1 ml/min, with monitoring by MS in the selected ion monitoring (SIM) mode for m/z = 383 [M+1−H2O]+.
Detection of endogenous products in HaCaT keratinocytes
HaCaT keratinocytes were grown in 14 Petri dishes (10 cm in diameter) in DMEM plus 5% FBS until confluent. The cells were washed twice with PBS, harvested, and centrifuged. The pellet (84–90×106 cells) was sonicated in 5 ml of ice-cold PBS and then extracted with 15 ml hexane twice after addition of 15 ml acetonitrile. The extract was dried under nitrogen gas, redissolved in methanol, and subjected to HPLC using a Waters Atlantis dC18 column (100×4.6 mm, 5-μm particle size) with a gradient of methanol in water (85–100%) at a flow rate 0.5 ml/min (20 min), followed by a wash with 100% methanol (10 min). The peaks corresponding to hydroxyvitamin D3 standards were collected and dried. After reconstitution in methanol, they were analyzed by LC-MS/MS (API-4000) using a Zorbax Eclipse Plus C18 column (2.1×50 mm, 1.8 μm) under isocratic conditions with 96% methanol as solvent at flow rate of 0.1 ml/min, with monitoring by MRM or SIM as specified.
Quantitative PCR analysis
Human skin and subcutaneous fat obtained after surgery or circumcision were used for RNA isolation or utilized to establish primary cultures of epidermal keratinocytes or fibroblasts following methods described previously (27, 28). RNA from skin cells and tissue was isolated using an Absolutely RNA Miniprep Kit (Stratagene, La Jolla, CA, USA). The reverse transcription was performed using the Transcriptor First Strand cDNA Synthesis Kit (Roche, Basel, Switzerland). Real-time PCR was performed using cDNA and a Cyber Green Master Mix (n=3). Reactions were performed at 95°C for 5 min and then 50 cycles of 95°C for 15 s, 60°C for 30 s, and 72°C for 30 s. Data were collected on a Roche Light Cycler 480. The amounts were compared to a reference gene (cyclophilin B) using a comparative Ct method. Relative gene expression data were calculated using the ΔΔCt method. Changes in gene expression are presented as relative quantities using mean ΔCt (normalized target) as a difference between target gene and reference gene in the cycle of appearance in time (C). Sequences of the primers are in Supplemental Table S1.
Statistical analyses
Differences among groups were analyzed using ANOVA if multiple comparisons were made, Student's 2-sample t test for single comparisons between groups with normally distributed data, or by Mann-Whitney rank sum test for data not normally distributed. Level of significance was set at P < 0.05.
RESULTS AND DISCUSSION
Experiments on human placenta
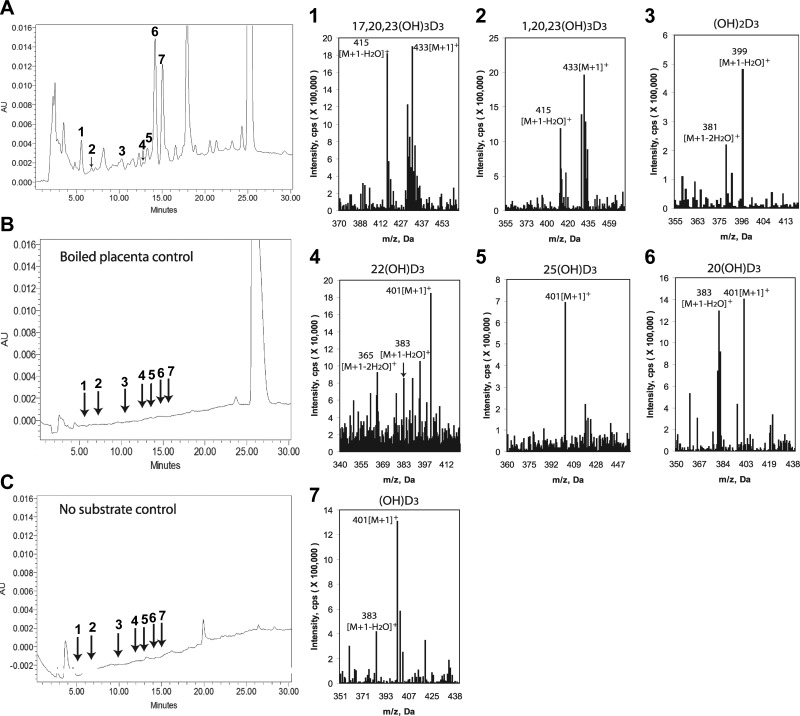
Ex utero incubation of D3 with human placental fragments resulted in production of D3 hydroxyderivatives with RTs corresponding to the following compounds, as determined by spiking the samples with known standards: 1) 17,20,23(OH)3D3; 2) 1,20,23(OH)3D3; 3) 20,23(OH)2D3, 1,20(OH)2D3, and 1,25(OH)2D3; 4) 22(OH)D3; 5) 25(OH)D3; 6) 20(OH)D3. A monohydroxyvitamin D3 that we could not identify was also observed (Fig. 1, product 7). All these products were absent in negative controls incubated either without substrate or after boiling of the placental fragments. MS analyses of the corresponding peaks substantiated the above findings by identification of ion masses corresponding to trihydroxyvitamin D3 with m/z = 433 for [M+1]+ and 415 for [M+1−H2O]+ in peaks 1 and 2; dihydroxyvitamin D3with m/z = 399 for [M+1−H2O]+ and 381 for [M+1−2H2O]+ in peak 3; and monohydroxyvitamin D3 with m/z = 401 for [M+1]+ and 383 for [M+1−H2O]+ in peaks 4–7.
Figure 1.
Detection of novel D3 hydroxyderivatives in human placenta incubated ex utero (A) that were absent in negative controls comprising boiled placenta incubated with vitamin D substrate (B) or placenta incubated without the substrate (C). Peaks with RTs corresponding to the synthetic standards were numbered as follows and submitted for LC/MS: 1) 17,20,23(OH)3D3; 2) 1,20,23(OH)3) 20,23(OH)2D3, 1,20(OH)2D3, and 1,25(OH)2D3; 4) 22(OH)D3; 5) 25(OH)D3; 6) 20(OH)D3. Other major peaks were analyzed, of which only peak 7 shows mass spectrum of monohydroxyvitamin D3 and is marked as (OH)D3 because its structure is unknown. Right panels show mass spectra of peaks 1–7.
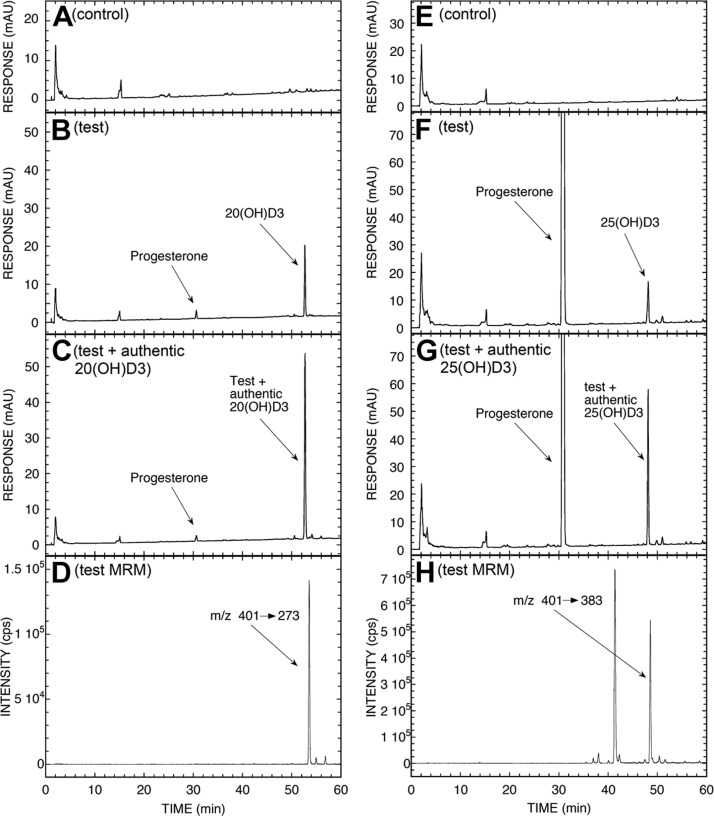
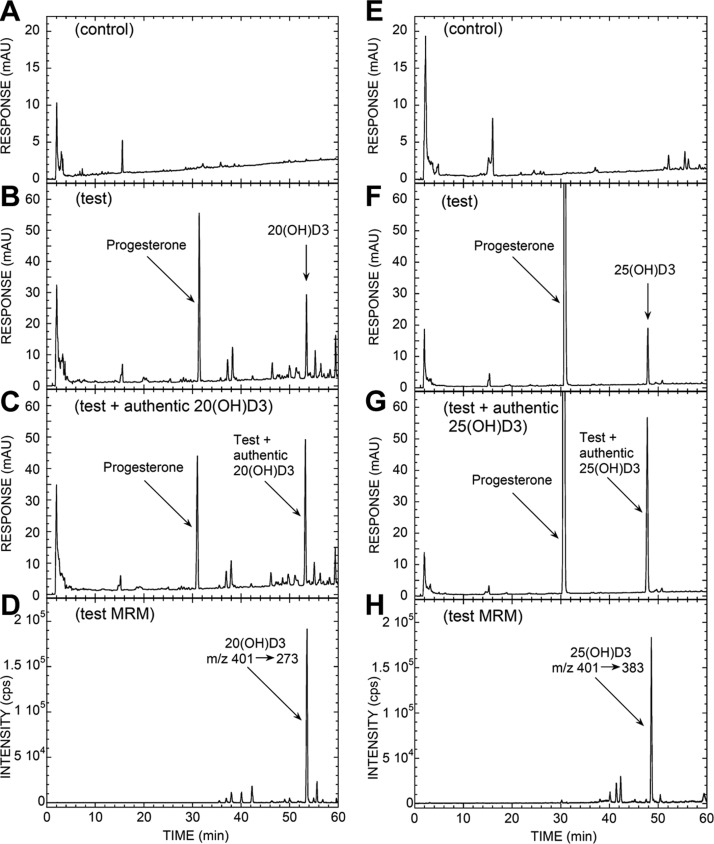
Since the major product of in vivo transformation was represented by a species corresponding to 20(OH)D3 (Fig. 1 and Supplemental Table S2), we performed additional incubations with mitochondria isolated from human placentas where 20(OH)D3 was observed in the test incubation but not in the negative control that lacked an electron source. (Fig. 2A–C). Progesterone was also present in the test incubations (Fig. 2B, F), produced from endogenous cholesterol and/or pregnenolone in the mitochondria. It was not completely separated from 20(OH)D3 or 25(OH)D3 by the TLC step performed prior to HPLC. The UV spectrum of the peak corresponding to 20(OH)D3 had λmax at 265 nm, typical of the D3 chromophore (not shown). MRM mass spectrometry showed the characteristic transition (m/z 401→273) at the correct RT, confirming that the product was 20(OH)D3 (Fig. 2D). The amount of 20(OH)D3 produced during the 4-h incubation, not corrected for procedural losses, was 81 pmol/mg protein.
Figure 2.
LC-MS/MS analysis of 20(OH)D3 (A–D) and 25(OH)D3 (E–H) produced by placental mitochondria and partially purified by TLC. Mitochondria were incubated with 200 μM D3 for 4 h and analyzed by TLC and HPLC as described in Materials and Methods. A) Chromatogram of control reaction with NADP and isocitrate omitted. B) Test reaction. C) Extract of test reaction spiked with authentic 20(OH)D3. D) Analysis via LC-MS/MS, used in the MRM mode, of the test reaction following the parent to product transition m/z 401 → 273. E) Chromatogram of control reaction with NADP and isocitrate omitted. F) Test reaction. G) Extract of test reaction spiked with authentic 25(OH)D3. H) Analysis via LC-MS/MS, used in MRM mode, of test reaction following parent to product transition m/z 401 → 383.
Although the placenta expresses 1α-hydroxylase responsible for production of 1,25(OH)D3 (29) from circulating 25(OH)D3, our finding of ex utero production of 25(OH)D3 was unexpected (Fig. 1). Therefore, we performed additional incubations of D3 substrate with purified placental mitochondria and clearly detected a product corresponding to 25(OH)D3 with MRM (m/z 401→383) identifying it as 25(OH)D3 (Fig. 2E–H). In accordance, molecular analyses of gene expression showed relatively high expression of genes encoding 25-hydroxylases (CYP27A1 and CYP2R1) in human placenta as compared to whole thickness human skin or isolate skin cells. The expected expression of CYP27B1 and CYP11A1 was also observed (Table 1). To our knowledge, this is the first demonstration that human placenta is capable of metabolizing D3 to 25(OH)D3 by either CYP27A1 or CYP2R1. This production would predominantly be for local use, since the liver is required for the systemic supply of 25(OH)D3 (30), with other minor contributions by the intestine and kidney (31).
TABLE 1.
Relative expression for genes activating D3 in human placenta in comparison to skin and adrenal gland
| Cells or tissue | CYP27A1 | CYP27B1 | CYP11A1 | CYP2R1 |
|---|---|---|---|---|
| HEKa | 12.58 ± 0.32 | 11.37 ± 0.24 | 14.98 ± 0.16 | 2.21 ± 0.30 |
| HaCaT | 14.92 ± 0.07 | 14.07 ± 0.14 | 15.65 ± 0.34 | 22.62 ± 0.22 |
| HEFn | 7.79 ± 0.28 | 14.6 ± 0.28 | 13.73 ± 0.52 | 13.97 ± 0.42 |
| Skin from white patient | 3.96 ± 0.7 | 17.03 ± 0.1 | 2.32 ± 0.35 | 8.03 ± 0.32 |
| Cutaneous fat | 4.95 ± 0.33 | 20.06 ± 0.12 | 6.5 ± 0.42 | 21.2 ± 0.73 |
| Placenta | 6.73 ± 0.24 | 18.28 ± 0.27 | 1.49 ± 0.24 | 3.37 ± 0.38 |
| Adrenal gland | 4.6 ± 0.17 | 19.86 ± 0.14 | ND | 5.74 ± 0.31 |
Values are presented as mean ± sd ΔCt (mean number of cycles/cyclophilin B mean cycle number). Note that lower values represent higher concentrations of corresponding mRNAs. HEKa, adult human epidermal keratinocytes; HEFn, neonatal human epidermal fibroblasts; HaCaT, immortalized human epidermal keratinocytes; ND, not determined.
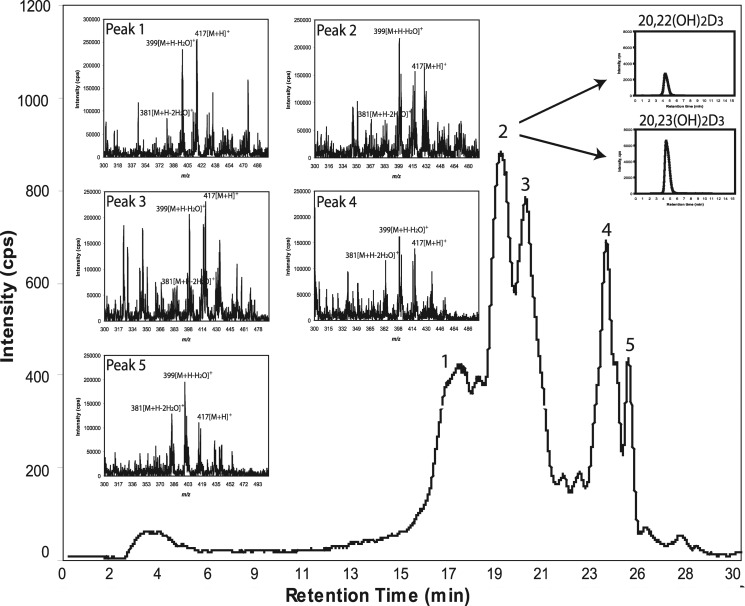
The production of 20(OH)D3 as the predominant metabolite (Fig. 1) was further supported by in vitro assays with recombinant human P450scc (Supplemental Fig. S1A). Minor products, including 22(OH)D3, 20,23(OH)2D3, 20,22(OH)2D3, 17,20(OH)2D3, and 17,20,23(OH)3D3, were clearly seen in the chromatogram with expansion of the scale (Supplemental Fig. S1B). To further identify minor dihydroxyvitamin D3 metabolites produced by the placenta ex utero, we used an API-3000 LC-MS/MS, with the production of dihydroxyvitamin D3 being determined using the MRM transition m/z 417 → 381, characteristic of dihydroxyvitamin D3 (Fig. 3). Five species with this transition were identified, with products 1–3 having the RTs of the 1,25(OH)2D3, 20,23(OH)2D3 and 20,22(OH)2D3 (combined), and 1,20(OH)2D3 standards, respectively. To estimate the relative abundance of 20,23(OH)2D3 and 20,22(OH)2D3, which do not separate with a gradient of methanol in water, we changed the separation conditions to an acetonitrile gradient, which does separate these structural isomers (12). Peaks with RTs of the corresponding standards, 22.1 and 21.6 min, respectively, were collected and analyzed separately by API-4000 LC-MS/MS using the MRM transition m/z 417 → 381. This analysis showed that 20,23(OH)2D3 was more abundant than 20,22(OH)2D3. Thus, we have identified 17,20,23(OH)3D3, 1,20,23(OH)3D3, 20,23(OH)2D3, 20,22(OH)2D3, 1,20(OH)2D3, 1,25(OH)2D3, 22(OH)D3, 25(OH)D3, and 20(OH)D3 as products of placental metabolism of D3, with 20(OH)D3 being the most prominent. Their relative production (μg/g tissue) is presented in Supplemental Table S2, with 6.6% of the substrate being converted to 20(OH)D3 and 0.5% to 25(OH)D3. Production of 22(OH)D3 was minimal.
Figure 3.
LC-MS/MS identification of dihydroxyderivatives of D3 produced by placental fragments using the MRM transition (m/z 417→381). Insets: total ion scan for each peak. Peaks with RTs of the corresponding standards were numbered as follows: 1) 1,25(OH)2D3; 2) 20,23(OH)2D3 + 20,22(OH)2D3; 3) 1,20(OH)2D3. Peaks 4 and 5 represent unknown compounds. Peak 2 was separated with a gradient of acetonitrile in water to collect fractions with RTs corresponding to 20,23(OH)2D3 or 20,22(OH)2D3 standards. These fractions were analyzed separately by LC-MS/MS in MRM mode, as shown in insets.
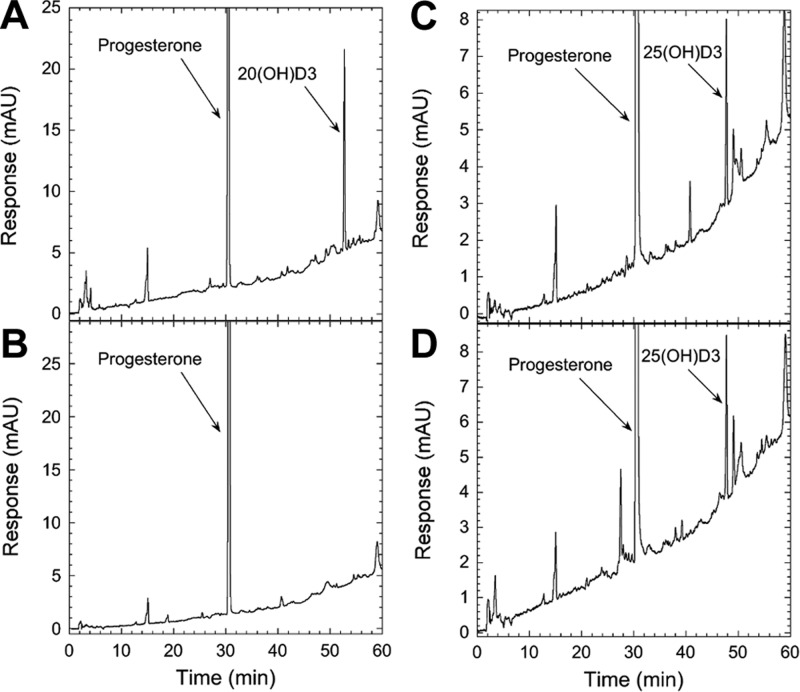
Although the above findings are in agreement with our previous in vitro studies demonstrating that P450scc first metabolized D3 to the 20(OH)D3, with subsequent transformation to di-, tri-, and tetrahydroxy products (10–12), additional tests were performed to further confirm P450scc involvement. Supplemental Fig. S2 shows that placental production of 20(OH)D3 ex utero is inhibited by aminoglutethimide (AGT), suggesting in vivo involvement of P450scc. This finding was further confirmed by assays performed with isolated mitochondria from the human placenta, which show that production of 20(OH)D3 is completely inhibited by the addition of 22R-hydroxycholesterol, a tight-binding P450scc reaction intermediate (24). It had no effect on production of 25(OH)D3, which served as negative control (Fig. 4).
Figure 4.
22R-hydroxycholesterol inhibits production of 20(OH)D3 but not of 25(OH)D3 by placental mitochondria. Placental mitochondria were incubated with 200 μM D3 for 4 h at 37°C; products were partially purified by TLC and analyzed by RP-HPLC. A) Test reaction showing HPLC chromatogram of the 20(OH)D3 TLC zone products. B) 20(OH)D3 TLC zone for reaction carried out in the presence of 100 μM 22R-hydroxycholesterol. C) Test reaction showing HPLC chromatogram of 25(OH)D3 TLC zone products. D) 25(OH)D3 TLC zone for reaction carried out in the presence of 100 μM 22R-hydroxycholesterol.
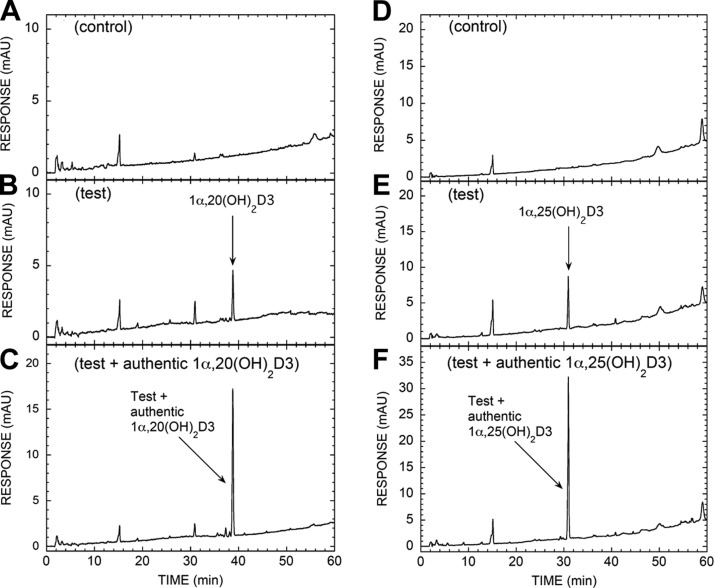
Since 1α-hydroxylation is a necessary step in the activation of 25(OH)D3 (4, 5, 32), and 25(OH)D3 is not a substrate for P450scc (10), we focused our attention on CYP27B1 in accordance with data shown in Figs. 1 and 3. Specifically, Fig. 5 demonstrates that mitochondria isolated from human placentas transform 20(OH)D3 to 1,20(OH)2D3 and 25(OH)D3 to 1,25(OH)2D3), illustrating that 1α-hydroxylase activity is present and further substantiating the identification of in vivo production of 1,20(OH)2D3 and 1,20,23(OH)3D3 in the human placenta (see Figs. 1 and 3). We also present an additional route for placental 1,20(OH)2D3 production from the transformation of 1(OH)D3 (a synthetic prodrug; ref. 33) to 1,20(OH)2D3 by placental mitochondria (Supplemental Fig. S3). This is consistent with our previous demonstration that purified bovine P450scc converts 1(OH)D3 to 1,20(OH)2D3 (13). Since 1,20(OH)2D3 is biologically active, the reported biological actions of 1(OH)D3 (34) may also be attributed to its transformation to 1,20(OH)2D3.
Figure 5.
Placental mitochondria metabolize 20(OH)D3 to 1,20(OH)2D3, with the expected transformation of 25(OH)D3 to 1,25(OH)2D3 serving as a positive control. Placental mitochondria were incubated with 60 μM 20(OH)D3 (A–C) or 150 μM 25(OH)D3 (D–F) for 4 h at 37°C; products were partially purified by TLC and analyzed by RP-HPLC, as described in Materials and Methods. A) HPLC chromatogram of 1α,20(OH)2D3 TLC zone for control reaction with NADP and isocitrate omitted, B) Test reaction showing HPLC chromatogram of 1α,20(OH)2D3 TLC zone products. C) Extract of test reaction spiked with authentic 1α,20(OH)2D3. D) HPLC chromatogram of 1α,25(OH)2D3 TLC zone for control reaction with NADP and isocitrate omitted. E) Test reaction showing HPLC chromatogram of 1α,25(OH)2D3 TLC zone products. F) Extract of test reaction spiked with authentic 1α,25(OH)2D3.
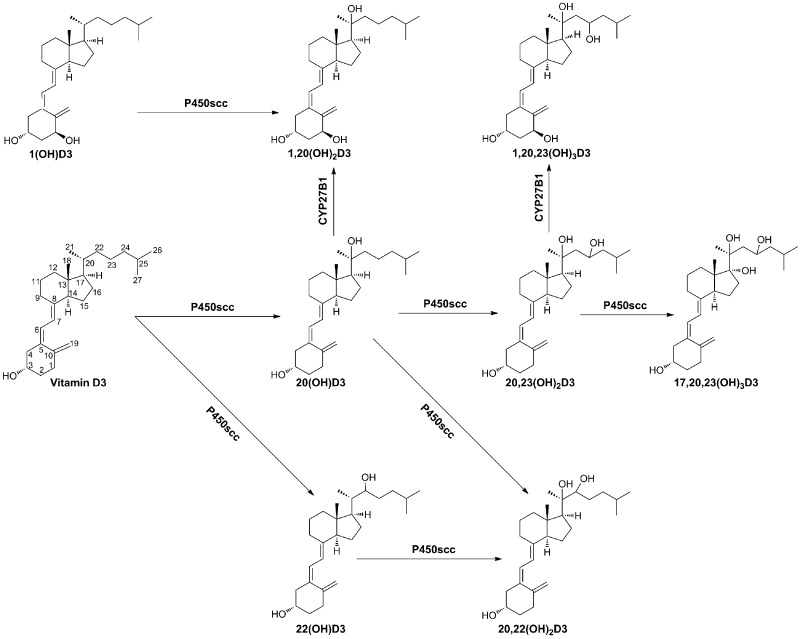
The data presented above clearly show D3 metabolism in human placenta ex utero through a novel P450scc-dependent pathway to produce 20(OH)D3 as the main product, with minor production of 22(OH)D3, 20,23(OH)2D3, and 17,20,23(OH)3D3, which can be further hydroxylated by CYP27B1 to produce 1,20(OH)2D3 and 1,20,23(OH)3D3 (Scheme 1). Additional production of 25(OH)D3 was also noted; however, the classical pathway [D3→25(OH)D3→1,25(OH)2D3] was less active than the P450scc-dependent pathway, as illustrated by the relatively lower production of 25(OH)D3 and 1,25(OH)2D3 by the placenta (Figs. 1 and 3 and Supplemental Table S1).
Scheme 1.
Proposed novel in vivo pathways of D3 metabolism initiated by cytochrome P450scc and modified by CYP27B1.
D3 metabolism in adrenal glands
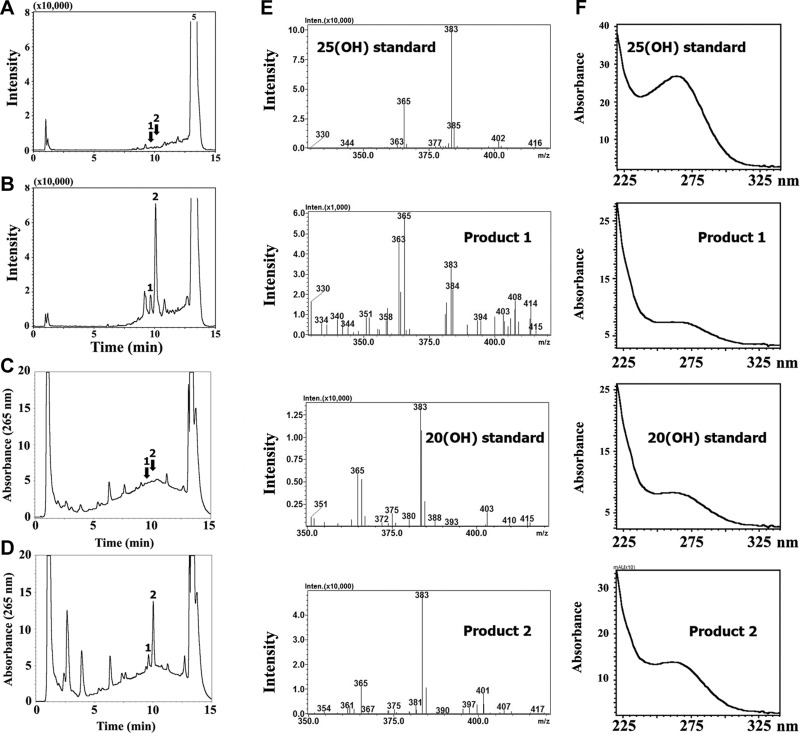
The ability of steroidogenic tissues to convert D3 to 20(OH)D3 was further investigated using rat adrenal glands incubated ex vivo with D3 (Fig. 6). LC-MS analysis carried out in the SIM mode for ions with m/z 383 representing [M+1−H2O]+ identified 4 main products that were absent for tissue boiled before incubation (Fig. 6). Two products had m/z, RT, and UV spectra identical to authentic 25(OH)D3 and 20(OH)D3 standards, which indicated the presence of 25-hydroxylase activity as well as P450scc activity. In addition, LC-MS analysis in the SIM mode for m/z = 399 ([M+1−H2O]+) detected a product (Supplemental Fig. S4, arrow) with identical RT to 20,23(OH)2D3 standard and a UV λmax 265 nm (Supplemental Fig. S4), consistent with production of 20,23(OH)2D3 by the human placenta described earlier. The conversion of D3 to 20(OH)D3 and 25(OH)D3 was also shown using isolated bovine adrenal mitochondria (Fig. 7), which also produced some progesterone from endogenous cholesterol and/or pregnenolone. The 25 hydroxylation of D3 by adrenals ex vivo was further substantiated by relatively high expression of genes encoding 25-hydroxylase (CYP27A1 and CYP2R1) in the human adrenal gland, in comparison to human skin or skin cells known to express these genes (2) and therefore serving as a positive control (Table 1).
Figure 6.
Rat adrenal glands transform D3 to 20(OH)D3 with markedly lower production of 25(OH)D3. A–D) Boiled (A, C) or viable fragments of adrenal glands (B, D) were incubated with D3, and products of the metabolism were analyzed both by LC-MS in the SIM mode for ions with m/z 383 corresponding to [M+1−H2O]+ of monohydroxyvitamin D3 (A, B), and UV analysis (C, D). Peaks 1 and 2 had RT 9.6 min and 10.03 min, corresponding to the 25(OH)D3 and 20(OH)D3 standards, respectively. E, F) Mass (E) and UV spectra (F) of the corresponding peaks and standards that were identical.
Figure 7.
LC-MS analysis of 20(OH)D3 (A–D) and 25(OH)D3 (E–H) produced by bovine adrenal mitochondria. Mitochondria were incubated with 200 mM D3 for 4 h, and products were separated by TLC prior to HPLC analysis, as described in Materials and Methods. A) Chromatogram of control reaction with NADP and isocitrate omitted. B) Test reaction. C) Extract of test reaction spiked with authentic 20(OH)D3. D) Analysis via LC-MS/MS, used in the MRM mode, of the test reaction following the parent-to-product transition m/z 401 → 273. E) Chromatogram of control reaction with NADP and isocitrate omitted. F) Test reaction. G) Extract of test reaction spiked with authentic 25(OH)D3. H) Analysis via LC-MS/MS, used in the MRM mode, of the test reaction following the parent to product transition 401 → 383.
D3 metabolism in intact epidermal keratinocytes
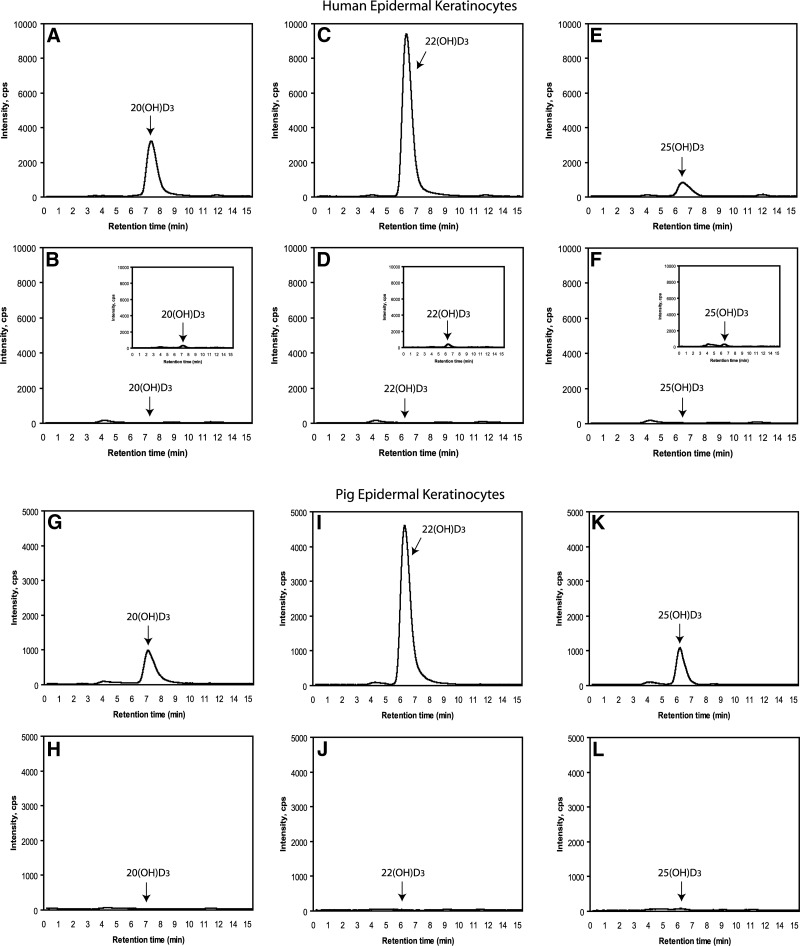
Epidermal skin keratinocytes, in addition to transforming D3 to 25(OH)D3 and 1,25(OH)2D3 (2), demonstrate steroidogenic activity (35) and express P450scc (7). Therefore, we tested whether they can metabolize D3 in a similar manner to placenta and adrenal glands (see above). Incubations of human epidermal HaCaT keratinocytes and isolated pig epidermal keratinocytes (Fig. 8) with D3 resulted in production of 22(OH)D3, 20(OH)D3, and 25(OH)D3 (positive control), as determined by LC-MS/MS. This analysis was done on samples collected from a preliminary HPLC step that had RTs identical to authentic standards. These samples displayed the RTs of the authentic standards when detected by MRM, using the characteristic m/z 401 → 383 transition for monohydroxyvitamin D3.
Figure 8.
Production of 20(OH)D3 (A, B, G, H), 22(OH)D3 (C, D, I, J), and 25(OH)D3 (E, F, K, L) by human HaCaT keratinocytes (A–F) and epidermal keratinocytes isolated from pig skin (G–L) incubated with 50 μM D3. After extraction of cell suspensions with dichloromethane, the products were separated by HPLC. Peaks with RTs corresponding to the standards were collected and were then subjected to LC-MS/MS with an ESI source using MRM for the transition m/z 401 → 383 (see Materials and Methods). A, C, E, G, I, K) Experimental incubations. B, D, F, H, J, L) Negative controls incubated without D3. Insets: cells extracted immediately after addition of D3 (time 0).
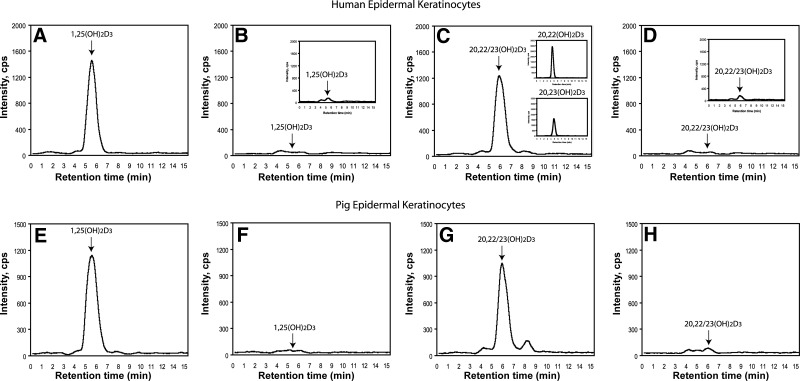
The fractions corresponding to 20,22(OH)2D3 and 20,23(OH)2D3 (unseparated) and to 1,25(OH)2D3 (positive control) were also collected and analyzed by LC-MS/MS using the MRM transition m/z 417→ 399, characteristic of dihydroxyvitamin D3, confirming their identities for both HaCaT keratinocytes and pig epidermal keratinocytes (Fig. 9). Again the fraction containing both 20,22(OH)2D3 and 20,23(OH)2D3 was subjected to HPLC, using a gradient of acetonitrile in water to permit their separation. They were then analyzed separately by LC-MS/MS in the MRM mode, which showed higher production of 20,22(OH)2D3 than 20,23(OH)2D3 in human (Fig. 9A) and pig epidermal keratinocytes (not shown).
Figure 9.
Production of 20,23(OH)2D3 and of 20,22(OH)2D3 (C, D, G, H) in comparison to 1,25(OH)2D3 (A, B, E, F) by human HaCaT keratinocytes (A–D) and epidermal keratinocytes isolated from pig skin (E–H). The HPLC fractions with RT corresponding to a mixture of 20,22(OH)2D3 and 20,23(OH)2D3 and to 1,25(OH)2D3 were further separated from each other and analyzed by LC-MS/MS by ESI with MRM for the transition m/z 417 → 399. A, C, E, G) Experimental incubations. B, D, F, H) Negative controls incubated without D3. Insets: LC-MS/MS in MRM mode of fractions with RT corresponding to 20,22(OH)2D3 and 20,23(OH)2D3 standards, after their separation by HPLC using an acetonotrile/water gradient (C); cells extracted immediately after addition of D3 (time 0; B, D).
Thus, similar to the placenta and adrenal glands, epidermal keratinocytes can transform exogenously added D3 to 20(OH)D3, 22(OH)D3, 20,22(OH)2D3, and 20,23(OH)2D3, which is in addition to the well documented production of 25(OH)D3 and 1,25(OH)2D3 (2, 4). However, noticeable differences were found, such as the relatively higher production of 22(OH)D3 and 20,22(OH)2D3 in comparison to 20(OH)D3 and 20,23(OH)2D3, indicating tissue-specific metabolism. Thus, tissues with high concentrations of P450scc predominantly transform D3 to 20(OH)D3 and 20,23(OH)2D3, while tissues with lower activity show relatively higher proportions of 22(OH)D3 and 20,22(OH)2D3. This finding may reflect either different rates of product metabolism or production rates. However, lower levels of 25(OH)D3 in keratinocytes may simply represent its rapid metabolism to 1,25(OH)2D3 by CYP27B1 and/or degradation by CYP24 (2, 4).
Endogenous production of D3 hydroxyderivatives in cultured keratinocytes
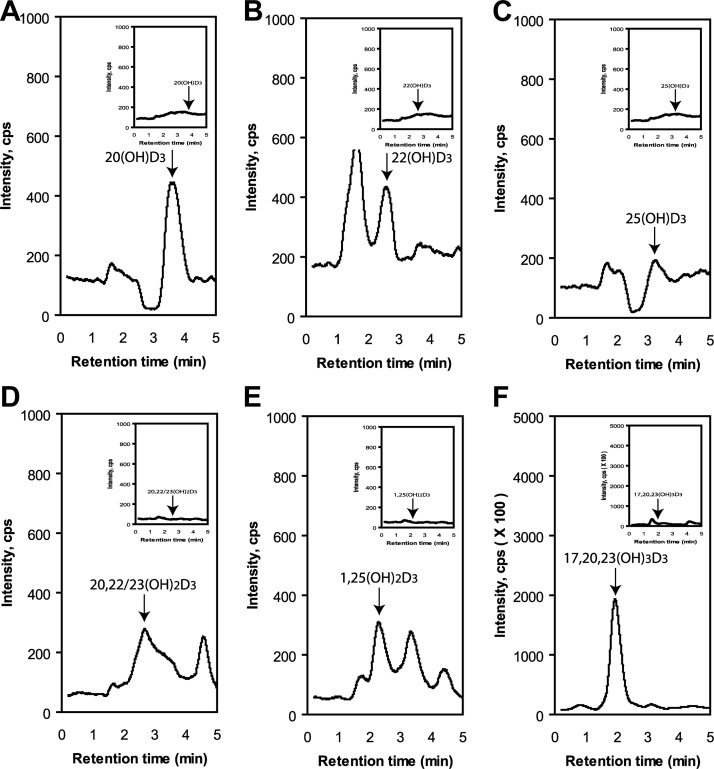
To test for endogenous production of hydroxyvitamin D3 derivatives, we analyzed extracts of HaCaT keratinocytes cultured with 5% FBS (see Materials and Methods). Components of the extract were separated by HPLC, and fractions corresponding to either 17,20,23(OH)3D3, 1,25(OH)2D3, a mixture of 20,23(OH)2D3 and 20,22(OH)2D3, 22(OH)D3, 25(OH)D3, or 20(OH)D3 were collected and analyzed by MS (Supplemental Fig. S5). The total ion count showed the presence of the expected masses for the products, identified from their RTs compared to authentic standards. To further confirm their identities, we also analyzed each fraction by LC-MS/MS in the MRM or SIM modes (Fig. 10). The monohydroxyvitamin D3 compounds displayed the expected transition (m/z =401[M+1]+→383[M+1−H2O]+) in the MRM mode, as did the dihydroxyvitamin D3 derivatives (m/z=417[M+1]+→399[M+1−H2O]+). Note that 20,22(OH)2D3 and 20,23(OH)2D3 were not separated under the HPLC conditions used (Fig. 10D). 17,20,23(OH)3D3 gave the expected ion (m/z=415[M+1−H2O]+) in the SIM mode. These results clearly demonstrate the endogenous production of P450scc-derived secosteroids, as well as the expected 25(OH)D3 and 1,25(OH)2D3.
Figure 10.
LC-MS/MS detection of endogenously produced 20(OH)D3 (A); 22(OH)D3 (B, C); 25(OH)D3, 20,22/23(OH)2D3 (D); 1,25(OH)2D3 (E); and 17,20,23(OH)3D3 (F). The HPLC fractions with RTs corresponding to each hydroxyvitamin D3 (see Supplemental Fig. S1) were analyzed by LC-MS/MS by ESI with MRM for the transition of m/z = 401 [M+1]+ → 383 [M+1−H2O]+ for monohydroxyvitamin D3, m/z = 417 [M+1]+ → 399 [M+1−H2O]+ for dihydroxyvitamin D3, and SIM for m/z = 415 [M+1−H2O]+ for trihydroxyvitamin D3. Insets: methanol control.
Detection of 20(OH)D3 in human serum
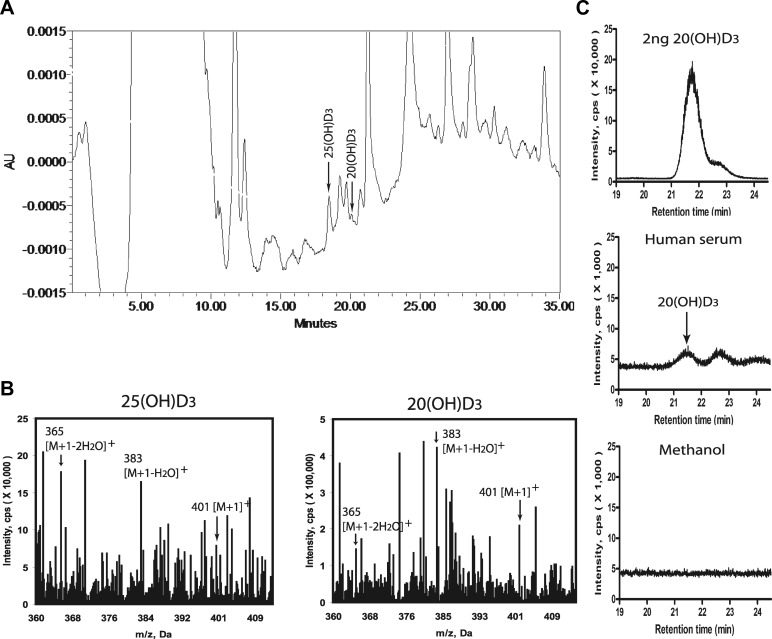
Finally, we analyzed human serum for the presence of 20(OH)D3. Initial HPLC was used to select fractions corresponding in RT to authentic 25(OH)D3 (major peak of interest) and 20(OH)D3 (minor peak of interest) (Fig. 11). These samples were subjected to LC-MS analyses and showed masses corresponding to [M+1]+, [M+1−H2O]+, and [M+1−2H2O]+ of the monohydroxyvitamin D3 (Fig. 11B). The LC-MS analysis in the SIM (m/z=383) mode of the peak corresponding to 20(OH)D3 revealed a peak with an identical RT to authentic 20(OH)D3 (Fig. 11C), indicating the presence of this metabolite in vivo. Based on the HPLC peak areas, the calculated ratio between 25(OH)D3 and 20(OH)D3 content was 1:20. 22(OH)D3 and 20,23(OH)2D3 were below the limits of detection of the methods we used.
Figure 11.
Detection of 20(OH)D3 in human serum. A) HPLC chromatogram of the serum extract. B) MS analyses of the peak corresponding to the RT of 25(OH)D3 and a minor peak corresponding to 20(OH)D3. Values for m/z 401, 383, and 365 correspond to the [M+1]+, [M+1−H2O]+, and [M+1−2H2O]+ of monohydroxyvitamin D3. C) LC-MS analysis of the peak corresponding to 20(OH)D3 in the SIM mode demonstrated m/z = 383 with an identical RT to 20(OH)D3 that was absent in the negative control (solvent run after the experimental sample).
CONCLUSIONS
It has been accepted that in vivo, D3 metabolism is restricted to its transformation to 25(OH)D3 mediated by 25-hydroxylases, subsequent hydroxylation to 1,25(OH)2D3 by CYP27B1, and degradation mediated by CYP24 (2, 4, 5). In this work, we clearly demonstrate a novel in vivo pathway of D3 metabolism (Scheme 1) initiated by P450scc. 20(OH)D3 is the major product of this pathway in adrenal glands and placenta (Figs. 1 and 6) and is also detectable in human serum. This predominant in vivo production of 20(OH)D3 is consistent with enzymatic analyses (10–12) and is further supported by modeling studies based on the crystal structure of the active site of human P450scc, predicting that C20 is the favored site for the first hydroxylation (36). In addition, we have detected production of 25(OH)D3 in placenta and rat adrenal glands for the first time, although production was significantly lower than 20(OH)D3, while the production of 22(OH)D3 was minimal. Thus, the predominant pathway of D3 metabolism in placenta and adrenal glands includes D3 → 20(OH)D3 → 20,23(OH)2D3 → 17,20,23(OH)3D3,with further 1α-hydroxylation of mono- and dihydroxy products by CYP27B1 (Scheme 1). The metabolic sequence D3 → 22(OH)D3 → 20,22(OH)2D3 is a minor one, with the possible generation of 20,22(OH)2D3 from 20(OH)D3 (Scheme 1). The above analysis is substantiated by previous findings with purified P450scc and CYP27B1 enzymes (9–12, 16–18, 36). Thus, we provide evidence that a novel pathway of D3 metabolism (Scheme 1) is operating in the placenta and adrenal glands, with possible systemic implications indicated by detection of a species corresponding to 20(OH)D3 in human serum. Conversion of D3 to 25(OH)D3 by the placenta and adrenal glands also represents a significant finding because this is the first step in its activation, but the pathophysiological significance of this phenomenon remains to be defined.
In peripheral tissues expressing P450scc at low levels, such as epidermal keratinocytes (10), the novel P450scc-dependent metabolism of D3 gave a higher proportion of 22(OH)D3 than 20(OH)D3, and of 20,22(OH)2D3 than 20,23(OH)2D3. There was also the expected production of 25(OH)D3 and 1,25(OH)2D3. Notably, we also detected endogenous production of 20(OH)D3, 22(OH)D3, 17,20,23(OH)3D3, 20,23(OH)2D3, and 20,22(OH)2D3, at similar levels to 25(OH)D3 and 1,25(OH)2D3, using serum-derived D3 as the substrate. Our results demonstrate cell type and organ specificity marked by higher production of 20(OH)D3 in tissues expressing high levels of P450scc (adrenals, placenta), and different ratios of the products in keratinocytes.
The significance of the above findings is further amplified by findings that the P450scc-generated D3 hydroxyderivatives are at least as biologically potent as the classical 1,25(OH)2D3 in antiproliferative, prodifferentiation, antifibrotic, and antineoplastic properties (17, 19, 21, 22, 27, 28, 37–39), while being noncalcemic at doses far above therapeutic limits for 25(OH)D3 and 1,25(OH)2D3. Thus our current and previous studies define the P450scc-derived D3 metabolites as natural products/endogenous bioregulators with exciting possibilities in biological chemistry, medicine and life sciences. In summary, we have provided the final evidence that a novel pathway of D3 metabolism operates in vivo that is initiated and regulated by P450scc, modified by CYP27B1, and of which the products and intermediates are biologically active.
Supplementary Material
Acknowledgments
The authors thank Drs. D. D. Bikle, T. C. Chen, and H. F. DeLuca for valuable information on vitamin D3 metabolism in placenta and adrenal glands.
The project was supported by U.S. National Institutes of Health (NIH) grant R01AR052190 to A.S., by the University of Western Australia, by the College of Pharmacy at the University of Tennessee Health Science Center, and by Curtin University of Perth. Additional partial support was also obtained from NIH grant 1R01AR056666-01A2 to A.S.
This article includes supplemental data. Please visit http://www.fasebj.org to obtain this information.
- 1(OH)D3
- 1-hydroxyvitamin D3
- 1,20(OH)2D3
- 1,20-dihydroxyvitamin D3
- 1,20,23(OH)3D3
- 1,20,23-trihydroxyvitamin D3
- 1,25(OH)2D3
- 1,25-dihydroxyvitamin D3
- 7DHC
- cholesta-5,7-dien-3β-ol (7-dehydrocholesterol)
- 7DHP
- 7-dehydropregnenolone
- 17,20,23(OH)3D3
- 17,20,23-trihydroxyvitamin D3
- 20(OH)D3
- 20-hydroxyvitamin D3
- 20,22(OH)2D3
- 20,22-dihydroxyvitamin D3
- 20,23(OH)2D3
- 20,23-dihydroxyvitamin D3
- 22(OH)D3
- 22-hydroxyvitamin D3
- 25(OH)D3
- 25-hydroxyvitamin D3
- CDL
- curved desolvation line
- D3
- vitamin D3
- ESI
- electrospray ionization
- MRM
- multiple reaction monitoring
- MS
- mass spectrometry
- RP-HPLC
- reverse-phase high-pressure liquid chromatography
- RT
- retention time
- SIM
- selective ion monitoring
REFERENCES
- 1. Holick M. F., Tian X. Q., Allen M. (1995) Evolutionary importance for the membrane enhancement of the production of vitamin D3 in the skin of poikilothermic animals. Proc. Natl. Acad. Sci. U. S. A. 92, 3124–3126 [DOI] [PMC free article] [PubMed] [Google Scholar]
- 2. Bikle D. D. (2011) Vitamin D metabolism and function in the skin. Mol. Cell. Endocr. 347, 80–89 [DOI] [PMC free article] [PubMed] [Google Scholar]
- 3. Holick M. F. (2003) Vitamin D: A millennium perspective. J. Cell. Biochem. 88, 296–307 [DOI] [PubMed] [Google Scholar]
- 4. Holick M. F. (2007) Vitamin D deficiency. N. Engl. J. Med. 357, 266–281 [DOI] [PubMed] [Google Scholar]
- 5. Plum L. A., DeLuca H. F. (2010) Vitamin D, disease and therapeutic opportunities. Nat. Rev. Drug Discov. 9, 941–955 [DOI] [PubMed] [Google Scholar]
- 6. Bikle D. D. (2008) Vitamin D receptor, UVR, and skin cancer: a potential protective mechanism. J. Invest. Dermatol. 128, 2357–2361 [DOI] [PMC free article] [PubMed] [Google Scholar]
- 7. Slominski A., Zjawiony J., Wortsman J., Semak I., Stewart J., Pisarchik A., Sweatman T., Marcos J., Dunbar C. C., Tuckey R. (2004) A novel pathway for sequential transformation of 7-dehydrocholesterol and expression of the P450scc system in mammalian skin. Eur. J. Biochem. FEBS 271, 4178–4188 [DOI] [PMC free article] [PubMed] [Google Scholar]
- 8. Slominski A. T., Zmijewski M. A., Semak I., Sweatman T., Janjetovic Z., Li W., Zjawiony J. K., Tuckey R. C. (2009) Sequential metabolism of 7-dehydrocholesterol to steroidal 5,7-dienes in adrenal glands and its biological implication in the skin. PloS One 4, e4309. [DOI] [PMC free article] [PubMed] [Google Scholar]
- 9. Guryev O., Carvalho R. A., Usanov S., Gilep A., Estabrook R. W. (2003) A pathway for the metabolism of vitamin D3: unique hydroxylated metabolites formed during catalysis with cytochrome P450scc (CYP11A1). Proc. Natl. Acad. Sci. U. S. A. 100, 14754–14759 [DOI] [PMC free article] [PubMed] [Google Scholar]
- 10. Slominski A., Semak I., Zjawiony J., Wortsman J., Li W., Szczesniewski A., Tuckey R. C. (2005) The cytochrome P450scc system opens an alternate pathway of vitamin D3 metabolism. FEBS J. 272, 4080–4090 [DOI] [PMC free article] [PubMed] [Google Scholar]
- 11. Tuckey R. C., Li W., Zjawiony J. K., Zmijewski M. A., Nguyen M. N., Sweatman T., Miller D., Slominski A. (2008) Pathways and products for the metabolism of vitamin D3 by cytochrome P450scc. FEBS J. 275, 2585–2596 [DOI] [PMC free article] [PubMed] [Google Scholar]
- 12. Tuckey R. C., Li W., Shehabi H. Z., Janjetovic Z., Nguyen M. N., Kim T. K., Chen J., Howell D. E., Benson H. A., Sweatman T., Baldisseri D. M., Slominski A. (2011) Production of 22-hydroxy-metabolites of vitamin D3 by cytochrome P450scc (CYP11A1) and analysis of their biological activities on skin cells. Drug Metab. Dispos. 39, 1577–1588 [DOI] [PMC free article] [PubMed] [Google Scholar]
- 13. Tuckey R. C., Janjetovic Z., Li W., Nguyen M. N., Zmijewski M. A., Zjawiony J., Slominski A. (2008) Metabolism of 1alpha-hydroxyvitamin D3 by cytochrome P450scc to biologically active 1alpha,20-dihydroxyvitamin D3. J. Steroid Biochem. Mol. Biol. 112, 213–219 [DOI] [PMC free article] [PubMed] [Google Scholar]
- 14. Slominski A., Semak I., Wortsman J., Zjawiony J., Li W., Zbytek B., Tuckey R. C. (2006) An alternative pathway of vitamin D metabolism. Cytochrome P450scc (CYP11A1)-mediated conversion to 20-hydroxyvitamin D2 and 17,20-dihydroxyvitamin D2. FEBS J. 273, 2891–2901 [DOI] [PMC free article] [PubMed] [Google Scholar]
- 15. Nguyen M. N., Slominski A., Li W., Ng Y. R., Tuckey R. C. (2009) Metabolism of vitamin D2 to 17,20,24-trihydroxyvitamin D2 by cytochrome p450scc (CYP11A1). Drug Metab. Dispos. 37, 761–767 [DOI] [PMC free article] [PubMed] [Google Scholar]
- 16. Tang E. K., Li W., Janjetovic Z., Nguyen M. N., Wang Z., Slominski A., Tuckey R. C. (2010) Purified mouse CYP27B1 can hydroxylate 20,23-dihydroxyvitamin D3, producing 1alpha,20,23-trihydroxyvitamin D3, which has altered biological activity. Drug Metab. Dispos. 38, 1553–1559 [DOI] [PMC free article] [PubMed] [Google Scholar]
- 17. Slominski A. T., Kim T. K., Janjetovic Z., Tuckey R. C., Bieniek R., Yue J., Li W., Chen J., Nguyen M. N., Tang E. K., Miller D., Chen T. C., Holick M. (2011) 20-Hydroxyvitamin D2 is a noncalcemic analog of vitamin D with potent antiproliferative and prodifferentiation activities in normal and malignant cells. Am. J. Physiol. Cell Physiol. 300, C526–C541 [DOI] [PMC free article] [PubMed] [Google Scholar]
- 18. Tang E. K., Voo K. J., Nguyen M. N., Tuckey R. C. (2010) Metabolism of substrates incorporated into phospholipid vesicles by mouse 25-hydroxyvitamin D3 1alpha-hydroxylase (CYP27B1). J. Steroid Biochem. Mol. Biol. 119, 171–179 [DOI] [PubMed] [Google Scholar]
- 19. Slominski A. T., Janjetovic Z., Fuller B. E., Zmijewski M. A., Tuckey R. C., Nguyen M. N., Sweatman T., Li W., Zjawiony J., Miller D., Chen T. C., Lozanski G., Holick M. F. (2010) Products of vitamin D3 or 7-dehydrocholesterol metabolism by cytochrome P450scc show anti-leukemia effects, having low or absent calcemic activity. PloS One 5, e9907. [DOI] [PMC free article] [PubMed] [Google Scholar]
- 20. Li W., Chen J., Janjetovic Z., Kim T. K., Sweatman T., Lu Y., Zjawiony J., Tuckey R. C., Miller D., Slominski A. (2010) Chemical synthesis of 20S-hydroxyvitamin D3, which shows antiproliferative activity. Steroids 75, 926–935 [DOI] [PMC free article] [PubMed] [Google Scholar]
- 21. Janjetovic Z., Zmijewski M. A., Tuckey R. C., DeLeon D. A., Nguyen M. N., Pfeffer L. M., Slominski A. T. (2009) 20-Hydroxycholecalciferol, product of vitamin D3 hydroxylation by P450scc, decreases NF-kappaB activity by increasing IkappaB alpha levels in human keratinocytes. PloS One 4, e5988. [DOI] [PMC free article] [PubMed] [Google Scholar]
- 22. Zbytek B., Janjetovic Z., Tuckey R. C., Zmijewski M. A., Sweatman T. W., Jones E., Nguyen M. N., Slominski A. T. (2008) 20-Hydroxyvitamin D3, a product of vitamin D3 hydroxylation by cytochrome P450scc, stimulates keratinocyte differentiation. J. Invest. Dermatol. 128, 2271–2280 [DOI] [PMC free article] [PubMed] [Google Scholar]
- 23. Wang J., Slominski A., Tuckey R. C., Janjetovic Z., Kulkarni A., Chen J., Postlethwaite A. E., Miller D., Li W. (2012) 20-hydroxyvitamin D inhibits proliferation of cancer cells with high efficacy while being non-toxic. Anticancer Res. 32, 739–746 [PMC free article] [PubMed] [Google Scholar]
- 24. Tuckey R. C. (2005) Progesterone synthesis by the human placenta. Placenta 26, 273–281 [DOI] [PubMed] [Google Scholar]
- 25. Tuckey R. C., Sadleir J. (1999) The concentration of adrenodoxin reductase limits cytochrome p450scc activity in the human placenta. Eur. J. Biochem. 263, 319–325 [DOI] [PubMed] [Google Scholar]
- 26. Tuckey R. C., Nguyen M. N., Chen J., Slominski A. T., Baldisseri D. M., Tieu E. W., Zjawiony J. K., Li W. (2012) Human cP450scc (CYP11A1) catalyses epoxide formation with ergosterol. Drug Metab. Dispos. 40, 436–444 [DOI] [PMC free article] [PubMed] [Google Scholar]
- 27. Janjetovic Z., Tuckey R. C., Nguyen M. N., Thorpe E. M., Jr., Slominski A. T. (2010) 20,23-dihydroxyvitamin D3, novel P450scc product, stimulates differentiation and inhibits proliferation and NF-kappaB activity in human keratinocytes. J. Cell. Physiol. 223, 36–48 [DOI] [PMC free article] [PubMed] [Google Scholar]
- 28. Slominski A. T., Li W., Bhattacharya S. K., Smith R. A., Johnson P. L., Chen J., Nelson K. E., Tuckey R. C., Miller D., Jiao Y., Gu W., Postlethwaite A. E. (2011) Vitamin D analogs 17,20S(OH)2pD and 17,20R(OH)2pD are noncalcemic and exhibit antifibrotic activity. J. Invest. Dermatol. 131, 1167–1169 [DOI] [PMC free article] [PubMed] [Google Scholar]
- 29. Zehnder D., Evans K. N., Kilby M. D., Bulmer J. N., Innes B. A., Stewart P. M., Hewison M. (2002) The ontogeny of 25-hydroxyvitamin D(3) 1alpha-hydroxylase expression in human placenta and decidua. Am. J. Pathol. 161, 105–114 [DOI] [PMC free article] [PubMed] [Google Scholar]
- 30. Ponchon G., Kennan A. L., DeLuca H. F. (1969) “Activation” of vitamin D by the liver. J. Clin. Invest. 48, 2032–2037 [DOI] [PMC free article] [PubMed] [Google Scholar]
- 31. Tucker G., 3rd, Gagnon R. E., Haussler M. R. (1973) Vitamin D 3-25-hydroxylase: tissue occurrence and apparent lack of regulation. Arch. Biochem. Biophys. 155, 47–57 [DOI] [PubMed] [Google Scholar]
- 32. Yamamoto K., Uchida E., Urushino N., Sakaki T., Kagawa N., Sawada N., Kamakura M., Kato S., Inouye K., Yamada S. (2005) Identification of the amino acid residue of CYP27B1 responsible for binding of 25-hydroxyvitamin D3 whose mutation causes vitamin D-dependent rickets type 1. J. Biol. Chem. 280, 30511–30516 [DOI] [PubMed] [Google Scholar]
- 33. Seino Y., Tanaka H., Yamaoka K., Yabuuchi H. (1987) Circulating 1 alpha,25-dihydroxyvitamin D levels after a single dose of 1 alpha,25-dihydroxyvitamin D3 or 1 alpha-hydroxyvitamin D3 in normal men. Bone Min. 2, 479–485 [PubMed] [Google Scholar]
- 34. Kubodera N. (2009) D-hormone derivatives for the treatment of osteoporosis: from alfacalcidol to eldecalcitol. Mini Rev. Med. Chem. 9, 1416–1422 [DOI] [PubMed] [Google Scholar]
- 35. Slominski A., Wortsman J., Paus R., Elias P. M., Tobin D. J., Feingold K. R. (2008) Skin as an endocrine organ: implications for its function. Drug Discov. Today Dis. Mech. 5, 137–144 [DOI] [PMC free article] [PubMed] [Google Scholar]
- 36. Strushkevich N., MacKenzie F., Cherkesova T., Grabovec I., Usanov S., Park H. W. (2011) Structural basis for pregnenolone biosynthesis by the mitochondrial monooxygenase system. Proc. Natl. Acad. Sci. U. S. A. 108, 10139–10143 [DOI] [PMC free article] [PubMed] [Google Scholar]
- 37. Janjetovic Z., Brozyna A. A., Tuckey R. C., Kim T. K., Nguyen M. N., Jozwicki W., Pfeffer S. R., Pfeffer L. M., Slominski A. T. (2011) High basal NF-kappaB activity in nonpigmented melanoma cells is associated with an enhanced sensitivity to vitamin D3 derivatives. Br. J. Cancer 105, 1874–1884 [DOI] [PMC free article] [PubMed] [Google Scholar]
- 38. Zmijewski M. A., Li W., Zjawiony J. K., Sweatman T. W., Chen J., Miller D. D., Slominski A. T. (2009) Photo-conversion of two epimers (20R and 20S) of pregna-5,7-diene-3beta, 17alpha, 20-triol and their bioactivity in melanoma cells. Steroids 74, 218–228 [DOI] [PMC free article] [PubMed] [Google Scholar]
- 39. Zmijewski M. A., Li W., Chen J., Kim T. K., Zjawiony J. K., Sweatman T. W., Miller D. D., Slominski A. T. (2011) Synthesis and photochemical transformation of 3beta,21-dihydroxypregna-5,7-dien-20-one to novel secosteroids that show anti-melanoma activity. Steroids 76, 193–203 [DOI] [PMC free article] [PubMed] [Google Scholar]
Associated Data
This section collects any data citations, data availability statements, or supplementary materials included in this article.


